


County Inclusion Fraction Reference - Hazard Services
County Inclusion Fraction
Purpose
This is a page containing the WarnGen county inclusion fractions for all CWAs that focal points can use to explore in order to decide how or if to modify their office's values when transitioning to Hazard Services Convective.
If you have questions or feedback about this table you can contact the AWIPS team via email: nws.wdtd.awips@noaa.gov
What Is An Inclusion Fraction?
This is a value (either in % of county area and/or square kilometers of county area) that determines the amount of space a polygon needs to cover in order to trigger hatching and include the county in the warning. The default for this is 0% AND 0 km**2 - that is, any area touched by the polygon will be included in the warning.
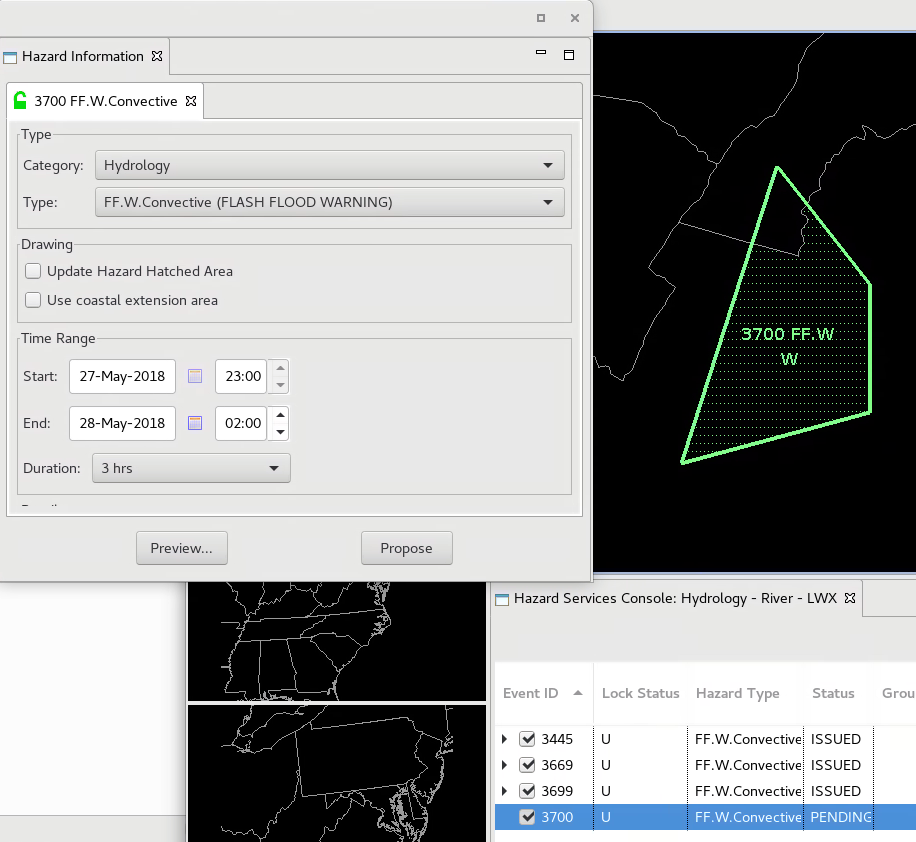
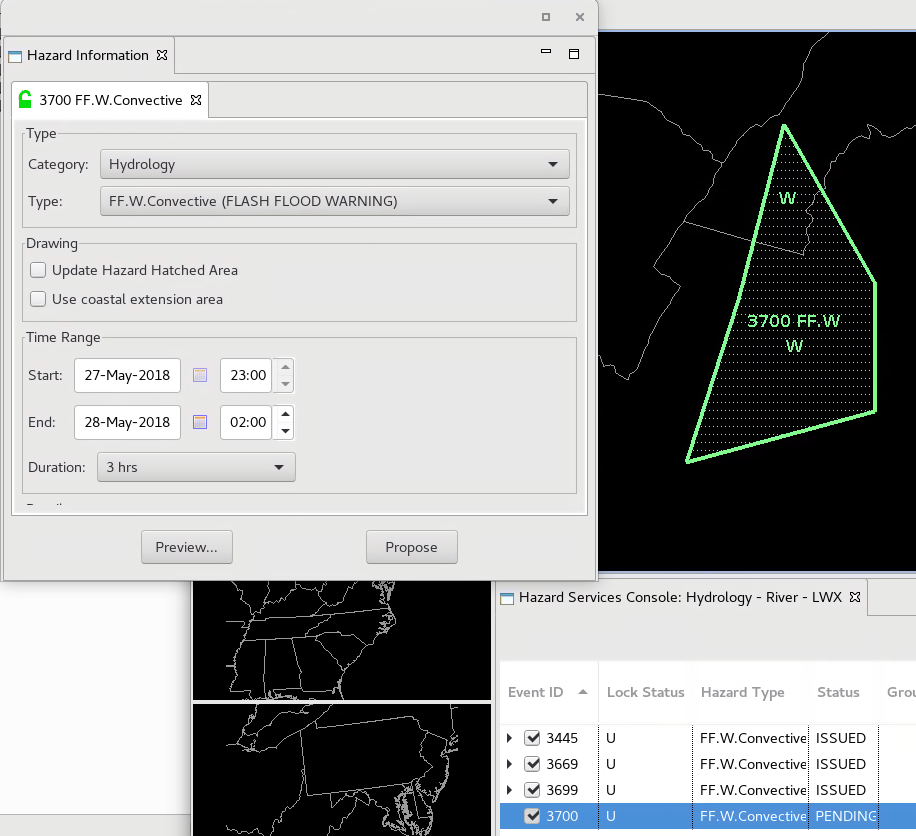
Here, you can view how a polygon requires the set inclusion fraction amount in order to include the county in the hatched area. Note how the top vertex of the polygon (left) is dragged upward until the warning threshold is met (right) to include that area in the warning.
This page focuses primarily on the inclusion fractions for county based products. There are separate inclusion fraction settings for land zone and marine zone products.
Inclusion Fraction Considerations
When drawing threat areas for warnings, many times areas of lesser threat exist on the edges of polygons that can sometimes clip counties in undesirable ways that include or exclude a county. Other times, particularly in CWAs with small county sizes, large numbers of counties can be included and as a result it can be difficult to limit the number of counties included to match directives. A third common challenge are curved counties, which are particularly prone to sliver issues that include or exclude the county.
While the behavior is a complex function of county size, shape, and number, there is a general trade off in behavior with the inclusion fraction settings:
- Small values: a smaller value can include too many counties for CWAs with predominately smaller county sizes and will require manually editing numerous vertices
- Large values: a larger value will limit the number of counties included, but when a county needs to be included it will require dragging the vertex far outside the threat area to trigger hatching and inclusion.
When choosing your values, it is a generally a good practice to try different values and line up the edge of standard-sized polygons along the intersections of multiple counties in your CWA to asses the trade off. You can coordinate with focal points at other CWAs who share your county characteristics for some inspiration on making changes, or start by browsing the values in the table below.
Changing Your County Inclusion Fraction
A Jobsheet explaining how to configure your inclusion area for a short-fused hazard in Hazard Services can be found here. For adjusting values in WarnGen, modify the corresponding values in your GeospatialConfig_COUNTY.xml file.
For changing your zone products in WarnGen, change the appropriate values in your land zone (geospatialConfig_ZONE.xml) and marine zone (geospatialConfig_MARINE.xml) files. Alaska also has its own unique marine file, geospatialConfig_ALASKA_MARINE.xml.
County Inclusion Fractions Across The NWS
To help you decide or rethink your WFO's inclusion fractions, we have pulled the values from all WFO's Warngen Inclusion Fraction settings (as of July 2023) and they are provided below in the following table.
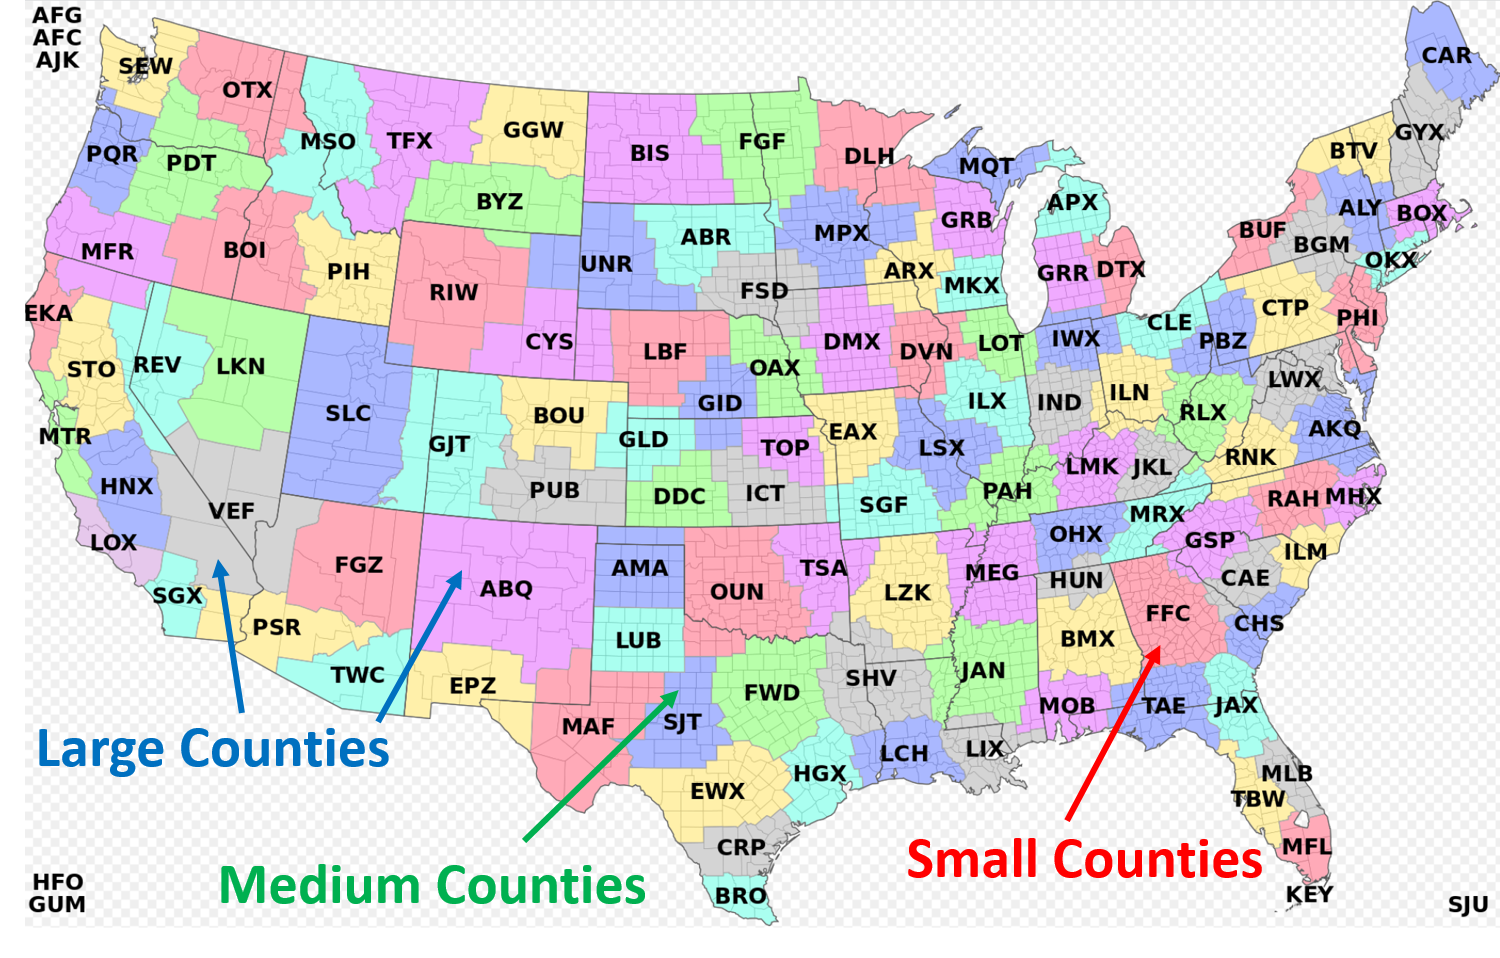
Additionally, we have added a few columns you may find useful. This includes median county size and a breakdown of the typical county sizes in each CWA. County size categories were determined with some simple statistics in order to appropriately bin counties into small (size< 0.75*Mean), medium (0.75*Mean<size<2*Mean), and large (size>2*Mean). Each WFO was broken down by percentage of counties in each category and the largest value was used for the label; if the other categories fell within 20% of the highest value, the WFO was also labeled with the corresponding category. If you have any questions about the methodology used, please reach out to the AWIPS team via email: nws.wdtd.awips@noaa.gov
To view a larger blank version of the WFO map, click here.
Some trends to get you started:
- Percentage Inclusion ranges from 0-10%
- Area Inclusion ranges from 0-65 km**2
- 88% of WFOs use the AND setting, while 12% used OR
- 34% of WFOS use the default setting of 0% AND 0 km**2
- 17% of WFOs use 0%, AND, and an area inclusion value > 0 km**2
- WFOs with large counties in their CWA trended towards using the default setting of 0% AND 0 km**2
- WFOs with small counties uses settings that generally ranged from 0-2% (with a few exceptions), but the area inclusions range greatly from 0 to 65 km**2
- WFOs with county sizes that fell in between the very large and very small ("medium counties") tended to use either larger area inclusions, many with values greater than 20 km**2, or the default value of 0 km**2
Ways To Get Started
Either with the table below or with a downloaded copy, here are a few ideas to get started with using the data:
- First, set the table row setting "Show __ Entries" to "All" (dropdown menu at the bottom left of the table) to see all WFOs at the same time.
- Review your CWA and counties from the map above and identify other CWAs with similar county number/size/shape. Look up their values from the table. Consider reaching out to those CWAs and see if they like their behavior.
- Sort by median county size and look at the range of values of Percentage Inclusion and Area Inclusion for CWAs with similar median county sizes.
- Sort by Percentage Inclusion with a secondary sort by Area Inclusion and look for ranges of values, noting general characteristics of uniquely large/medium/small counties.
- To perform a secondary sort on tables in VLab, click the primary column, then shift+click the secondary column. Make sure to note the arrow orientation for sorting direction (e.g. largest to smallest, A-Z, etc.)