National Blend of Models (NBM) Upgraded to Version 4.2 - MDL
Jun 21, 2024
On May 15, 2024, NOAA upgraded the National Blend of Models (NBM) — a nationally consistent and calibrated suite of forecast products generated from combining numerical weather prediction and post-processed data — to version 4.2 in operations. The upgrade includes a number of improvements to help forecasters improve the national gridded forecast including:
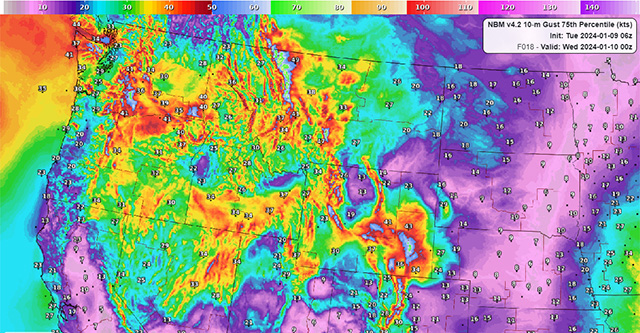
- New percentile and probabilistic sustained 10-meter wind and wind gust products
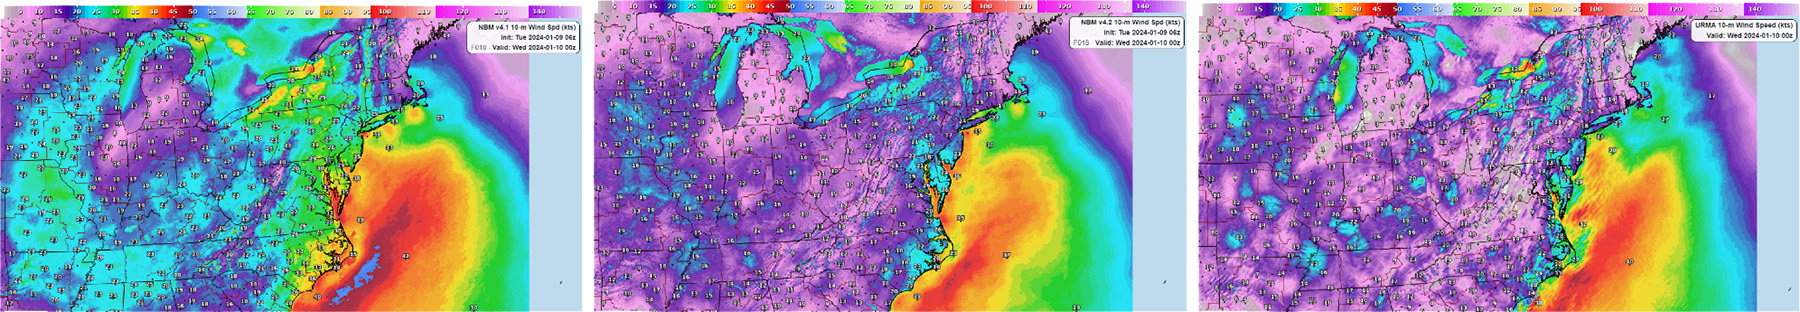
- Improved wind speed and gusts for “day-to-day” forecasts
- Better snow accumulation forecasts in environments with temperatures just above freezing
- Mitigation of lattice-like artifacts in winter weather output
- Reduction of erroneously high probabilities for freezing rain
- Improve snow forecasts over higher terrain
Improving wind forecasts was a high priority for MDL’s NBM team, given the feedback from customers during the past year that the wind forecasts were consistently too strong on a daily basis and required forecasters to spend considerable time making adjustments to the NBM forecasts. The NBM team instituted a quantile mapping approach for winds and gusts. This approach calibrates the forecasted distribution of values, using the observed distribution of values. The NBM team worked with its Science Advisory Group (SAG) to work out some initial problems with the ability of the quantile mapping approach to properly handle higher wind speeds, particularly at night. The result was a significantly-improved product.
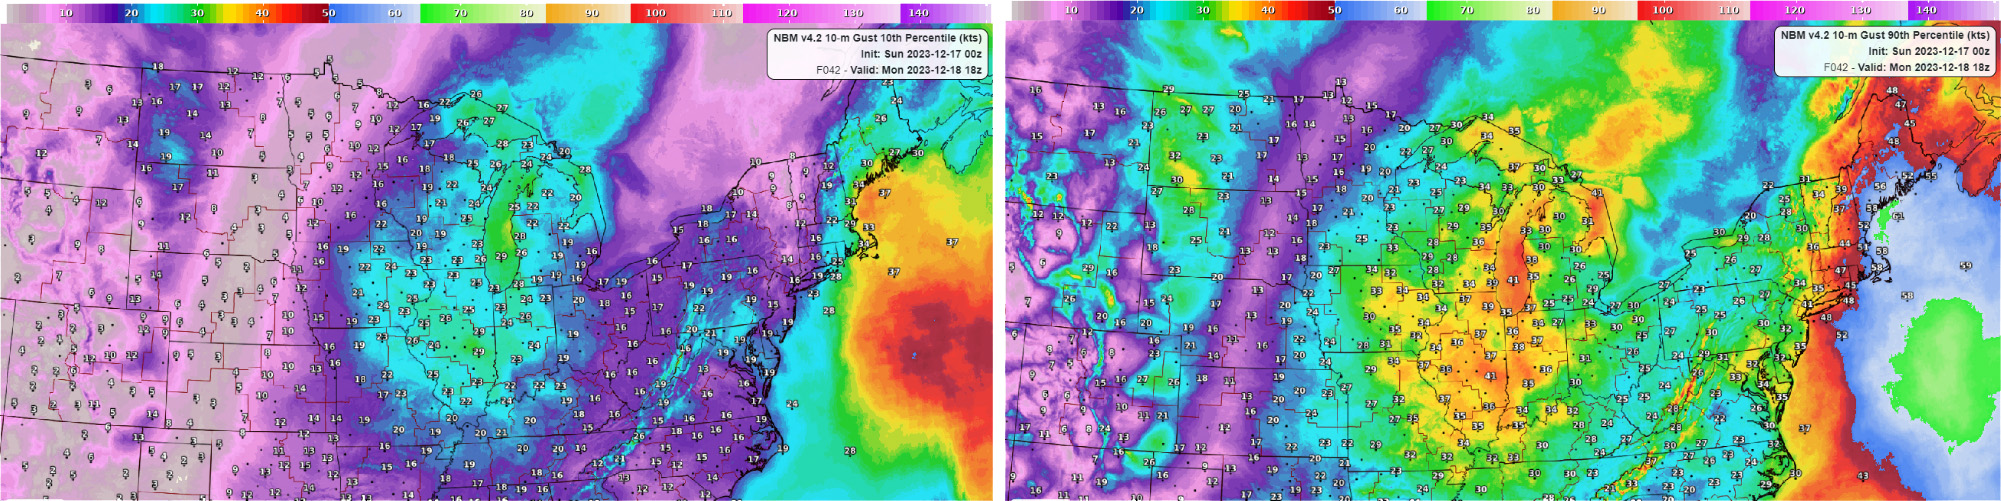
Having a full set of percentile values from the quantile mapping approach helps the forecasters assess the potential range of outcomes, including the lowest and highest potential values. In the example below, the 10th and 90th percentile values are shown for a wind event. As expected, the 10th percentile values (which correspond to near the lower end of the distribution) are significantly lower than the 90th percentile values (which correspond to near the higher end of the distribution).
The next major upgrade of the NBM, Version 5.0, will include new probabilistic products supporting fire weather and ocean wave forecasting, additional improvements to the suite of winter fields, an extension of hourly guidance from 36 to 48 hours, and much more.