P-Surge - MDL
P-Surge
DATA AVAILABILITY
- OPERATIONAL P-Surge DATA.
- EXPERIMENTAL P-Surge Guidance website.
ABOUT
The Probabilistic storm Surge (P-Surge) model (Taylor and Glahn) brings a probabilistic approach to the modeling of storm surge, and is run on a case-by-case basis in advance of hurricanes and tropical storms that may impact the Atlantic and Gulf Coasts of the contiguous US, and as of 2023 Puerto Rico and the U.S. Virgin Islands.
To account for the uncertainty in the wind forecast, it uses the official wind forecast from NOAA's National Hurricane Center (NHC) as well as NHC's historic 5-year average errors in track, size, and intensity of storms to create a collection of roughly 500-1000 representative wind and pressure inputs. P-Surge provides those inputs to the Sea, Lake, and Overland Surges from Hurricanes (SLOSH) model, which is a hydrodynamic model that computes water levels and inundation due to storm surge and tide. As of 2023, for Puerto Rico and the U.S. Virgin Islands only, P-Surge's version of SLOSH is coupled to a nearshore wave model allowing a wave component to be included in the computations of water levels and inundation. Each input represents a specific portions of the error space defined by the 5-year average error, allowing P-Surge to create probabilistic products by combining the resulting water level outputs from SLOSH with the likelihood of the representative inputs in a well defined statistical manner. The results are probabilistic products that utilize the best available parametric information (NHC's official forecast has historically outperformed other guidance) and are consistent with NHC's message.
HISTORY
The National Weather Service's (NWS) Meteorological Development Lab (MDL), in furtherance of its mission to help protect life and property, developed the Probabilistic storm Surge (P-Surge) model version 1.0 between 2003 and 2008 in response to Hurricane Isabel (2003). The intent was to provide storm surge inundation guidance for tropical cyclones based on storm surge which took into account the uncertainty in the forecast. MDL then enabled SLOSH to utilize gridded tide predictions which enabled the development of P-Surge version 2.0. Version 2.0 (2014) in addition to including the gridded tidal component in the inundation calculations, it updated the basins to use the NAVD-88 (vs NGVD-29) vertical datum, produced more time steps, and provided Above Ground Level (in addition to the above NAVD-88) guidance.
Several years of incremental improvements followed with v2.5 (2015) introducing coarser 2.5 km grids and 1-hour exceedance products; v2.6 (2017) extending the forecast from 78 to 102, providing support for Sub-Tropical storms, depressions, and potential/post tropical cyclones; and utilizing the high resolution South Florida basin; and v2.7 (2018) adding support for 90% exceedance, and dropping > 21,...,25 feet above datum products.
Then, with v2.8 (2020) and v2.9 (2021), NHC and MDL started to address how P-Surge utilized the Radius of Maximum Wind (RMW). The issue is that while NHC's advisory contains the current and forecast maximum wind speed (Vmax), it only provides the current central pressure and omits the RMW. To resolve this, P-Surge before v2.8 would use the current DeltaP (ambient - central pressure) and Vmax to estimate RMW. Then it would "predict" RMW by holding it constant, and compute a DeltaP prediction. With v2.8, the initial estimate of the RMW was replaced with an estimate provided by NHC's storm surge unit. It also introduced grouping the error statistics from (TS, TD, HU) to (0-50, 50-95, and > 95 kts). With v2.9, the prediction of RMW was replaced with a prediction of the RMW provided by NHC's storm surge unit. This was followed by v2.10 (2022) which supported the NCEP system upgrade from WCOSS to WCOSS-2.
With v3.0 (2023), MDL modified P-Surge's version of SLOSH to handle a non-spatially varying bottom friction, while NHC made sure it utilized NCEP's Environmental Modeling Center (EMC) coupling to the retired second generation Great Lakes Wave model (GLW). To get it all to work in a reasonable time, MDL enhanced SLOSH with MPI to enable multiple CPUs to work simultaneously on a storm / basin pair. This enabled P-Surge v3.0 to provide for Puerto Rico and the US Virgin Islands probabilistic inundation guidance based on surge, tide, and wave run-up, while improving the extent of inundation due to more realistic friction.
ERROR STATISTICS
NHC determines the 5 year error statistics by considering the following:
- Official forecasts initiated and verified within 10-45N and 60-100W.
- Official forecasts which started with at least hurricane strength.
Intensity Error Sampling:
- Three samples for Strong (30%), Medium (40%), Weak (30%) Intensity.
Along Track Error Sampling:
- Seven equally weighted samples (14%) for different forward speeds.
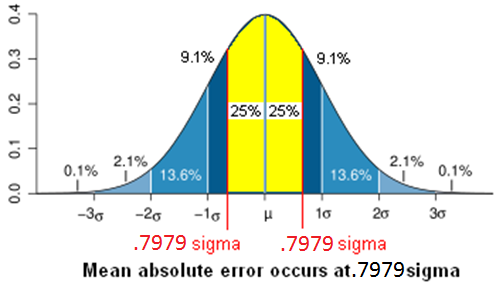
Cross Track Error Sampling:
- Cross track samples cover 90% of the area (± 1.64 sigma) under the normal distribution assigning the 5 year mean absolute error to 0.7979 sigma.
- To be dense enough, the storms were chosen to be one radius of maximum winds apart from each other at the 48 hour forecast projection.
Size Error Distribution and Sampling:
- The size error is bounded, invalidating the normal distribution assumption. Instead, five error distributions were derived by grouping storms based on initial size and determining the historic size guidance skill in the Atlantic. Once an appropriate error distribution is chosen, it's sampled three times similarly to the Intensity errors.
The result is the number of ensemble members is 3*7*X*3 where X depends on the density of the cross track sampling. The weight of each member is the product of the weight of each error sample: e.g. 0.3 * 0.14 * 0.1 * 0.4 = 0.00168
OFFICIAL FORECASTS
STORM SURGE GUIDANCE
- P-Surge CONUS | Puerto Rico
- P-ETSS
- ET-Surge New (2.0) | Original (1.0)
- STOFS
WATER OBSERVATIONS
WIND GUIDANCE
HURRICANE TRACKS
CONTACT
-
For more information about MDL's Storm Surge, please contact: Arthur.Taylor@noaa.gov