Storm Surge - FAQ - MDL
What is storm surge vs. storm tide?
- STORM SURGE is an abnormal rise of water generated by a storm, over and above the predicted astronomical tide.
- STORM TIDE is the water level rise during a storm due to the combination of storm surge and the astronomical tide.
What impacts storm surge and how are these impacts generalized?
- Intensity (higher winds speeds=increased storm surge)
- Central pressure (little impact)
- Forward speed (slower storms=higher and broader storm surge inland including bays and estuaries; faster storms=more storm surge along the open coast)
- Size (storm with large wind field=more storm surge; storm with small wind field=less storm surge)
- Angle of approach (perpendicular to coastline=more storm surge; parallel to coastline=less storm surge)
- Width and slope of continental shelf (wide shelf/gentle slope=more storm surge with relatively small waves; narrow shelf/sharp slope=less storm surge with relatively big waves)
- Local features (concavity of coastlines, bays, rivers, headlands, islands, etc.=greater storm surge impact); see figure below
![[Storm Coastal Features]](https://www.weather.gov/images/mdl/SLOSHCoastalfeatures.png)
How is storm surge forecast at the National Hurricane Center?
- The Sea, Lake and Overland Surges from Hurricanes (SLOSH) model is the computer model utilized by the National Oceanic and Atmospheric Administration (NOAA) for coastal inundation risk assessment and the operational prediction of storm surge.
- Operationally, the SLOSH model computes the maximum potential impact due to storm surge for a particular area from tropical cyclones based on storm intensity, track, and estimates of storm size provided by hurricane specialists/forecasters at the National Hurricane Center. These input parameters are needed to create a model of the wind field. This parameterized wind field is what drives the storm surge heights within the SLOSH model. A sample output can be seen here for Hurricane Ike.
- SLOSH has been applied to the entire U.S. Atlantic and Gulf of Mexico coastlines. In addition, coverage extends to Hawaii, Puerto Rico, the U.S. Virgin Islands, and the Bahamas. The SLOSH model coverage is subdivided into 37 regions or basins. These basins represent sections of coastline that are centered upon particularly susceptible features: inlets, large coastal centers of population, low-lying topography, and ports. An example of a typical computational domain, or basin, is the New Orleans basin.
How often are SLOSH basins updated?
- Currently, SLOSH basins are being updated at an average rate of 6 basins per year. SLOSH basin updates are ultimately governed by the Interagency Coordinating Committee on Hurricanes (ICCOH). The ICCOH manages hazard and post-storm analysis for the Hurricane Evacuation Studies under FEMA's Hurricane Program. Updates are driven by a number of different factors. These factors include changes to a basin's topography/bathymetry due to a hurricane event, degree of vulnerability to storm surge, availability of new data, changes to the coast, and addition of engineered flood protection devices (e.g., levees). The National Weather Service's Meteorological Development Laboratory (MDL) incorporates the latest topography/bathymetry and other data in the basin building process. These updates are provided to the National Hurricane Center's Storm Surge Unit in order to conduct storm surge simulation studies.
What is included in these SLOSH basin updates?
- Grid spacing is sometimes decreased to better resolve surge
- Hypothetical tracks covering a larger area which can more accurately model surge risk zones
- Conversion to updated vertical reference datum: NGVD29 to NAVD88
- Latest topography/bathymetry data resulting in a more accurate representation of barriers, gaps, passes, and other local features
- Higher resolution grids especially near the coast and center of the basin
What storm surge products are generated using the SLOSH model?
- Probabilistic Tropical Cyclone Storm Surge (P-Surge)
- Probabilistic Extra-Tropical Storm Surge (P-ETSS)
- Maximum of MEOWs (MOMs)
- Maximum Envelopes of High Water (MEOWs)
For more information about storm surge products and how they could be used operationally click here.
What are some of the key strengths associated with the SLOSH model?
- Computationally efficient and fast
- Resolves flow through barriers/gaps/passes
- Models deep passes between bodies of water
- Resolves inland inundation (wetting/drying of a cell)
- Models the overtopping of barrier systems, levees, and roads
- Resolves coastal reflections (e.g., coastally trapped Kelvin waves)
What are some of the limitations associated with the SLOSH model?
- Does not model the impacts from waves
- Does not model astronomical tide explicitly
- Operational runs can be run at varying water level anomalies to model the water level conditions at the onset of operational runs
- Does not model normal river flow and rain
What are vertical datums, and why are they so important?
- A vertical datum is an established surface that serves as a reference to measure or model heights and depths. All water level observations, including SLOSH storm surge heights, are referenced as height above a vertical reference datum. Currently, the SLOSH model utilizes the National Geodetic Vertical Datum of 1929 (NGVD29) and the North American Vertical Datum of 1988 (NAVD88). All basins are being updated to NAVD88 because NGVD29 is dated and no longer being supported.
- It is important to note that when comparing water level observations (e.g. tide stations) with other observations, observations with models, or models to models, one MUST always use consistent vertical datums.
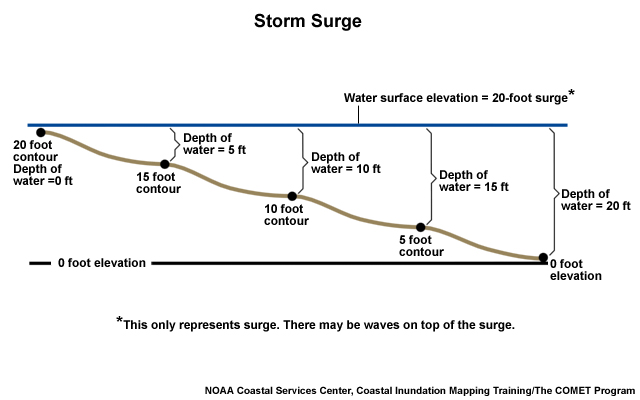
What is storm surge inundation?
- This is simply referencing storm surge as height above ground level. For the SLOSH model, this is done by subtracting the average elevation of each SLOSH grid cell from the water level computed by the SLOSH model which is referenced to a vertical datum. This helps to alleviate the confusion inherent with vertical datums. Now, when we say twenty feet of water, we mean twenty feet above ground level.
How is storm surge observed and measured?
- Tide Stations (NOAA): A network of 175 long-term, continuously operating water level stations throughout the U.S. serving as the foundation for NOAA's tide prediction products and providing data for storm surge estimates.
- Measure still water (e.g., no waves)
- Traditionally most reliable
- Limited stations
- FEMA/USGS High Water Marks (HWM): These marks are lines found on trees and other structures marking the highest elevation (peak) of the water surface for a flood event created by foam, seed, or other debris. Survey crews are deployed after a storm to locate and record reliable HWMs. GPS methods are used to determine location for coastal HWMs, which are then mapped relative to a vertical reference datum such as NAVD88.
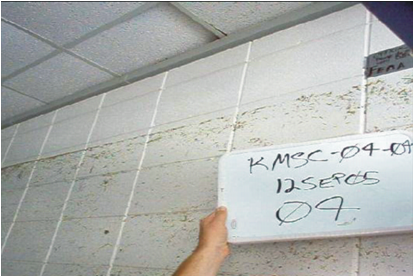
- Perishable
- Traditionally best method for capturing highest surge
- Subjective and often include impacts of waves
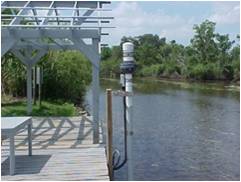
- Pressure Sensors (USGS): These are temporary water-level and barometric-pressure sensors which provide information about storm surge duration, times of surge arrival/retreat, and maximum depths.

- Relatively new method
- Deployed in advance of storms at expected location of highest surge
- Can contain impacts of waves
What are some issues related to storm surge data?
- Incomplete data or data does not capture height of event resulting from instrument failures during an event
- Complicated conversion methods resulting from different reference levels
- Different or even unknown error characteristics resulting from incompatible data sources
- "Still water" data versus the impacts of waves
Where can one find storm surge data and storm related products during a tropical event?
- Probabilistic Surge (P-Surge): http://www.nhc.noaa.gov
- NHC Public Advisories: http://www.nhc.noaa.gov/
- WFO Products: https://www.weather.gov/
- NOAA Tide Stations: https://tidesonline.nos.noaa.gov
Can I obtain the data used to create the storm surge interactive risk maps?
- Storm surge interactive risk maps are available from NHC’s website here: https://www.hurricanes.gov/nationalsurge/
The storm surge interactive risk maps show storm surge risk as a function of categories in the Saffir-Simpson Hurricane Scale. How is this possible considering the recent removal of storm surge from the Saffir-Simpson Scale?
- Earlier versions of the Saffir-Simpson Hurricane Scale incorporated storm surge as a component of each category. Storm surge was quantified by category in the earliest published versions of the scale dating back to 1972. However, hurricane size (extent of hurricane-force winds), local bathymetry (depth of near-shore waters), topography, the hurricane's forward speed and angle to the coast also affect the surge that is produced. For example, the very large Hurricane Ike (with hurricane force winds extending as much as 125 mi from the center) in 2008 made landfall in Texas as a Category 2 hurricane and had peak storm surge values of about 20 ft. In contrast, tiny Hurricane Charley (with hurricane force winds extending at most 25 mi from the center) struck Florida in 2004 as a Category 4 hurricane and produced a peak storm surge of only about 7 ft. These storm surge values were substantially outside of the ranges suggested in the original scale. Thus to help reduce public confusion about the impacts associated with the various hurricane categories as well as to provide a more scientifically defensible scale, the storm surge ranges have been removed from the scale and only peak winds are employed in the Saffir-Simpson Hurricane Wind Scale.
Unlike earlier versions of the Saffir-Simpson Hurricane Scale which only provide average storm surge values by category, the storm surge interactive risk maps show potential storm surge vulnerability for all areas and incorporate varying landfall locations, local bathymetry and topography, varying storm sizes, forward speeds, tracks, approach angles, and tide levels. This is accomplished by performing thousands of different SLOSH simulations for a given area and then compositing the results into a worst case snapshot, by Saffir-Simpson Category, indicating storm surge vulnerability. Thus, for a given area of interest, the storm surge interactive risk maps make use of thousands of hurricane landfall scenarios.
The storm surge interactive risk maps are different from my local hurricane evacuation zones. Which is correct?
- Under no circumstances should the storm surge interactive risk maps be compared with local hurricane evacuation zones. Hurricane evacuation zones consider other critical factors which affect hurricane evacuation decision-making. These maps are provided for informational and educational purposes only and do not supersede hurricane evacuation zones set by local and state emergency management.
According to the storm surge interactive risk maps, I live along the edge of an area susceptible to inundation. Does this mean my home is safe from the potential impacts from storm surge?
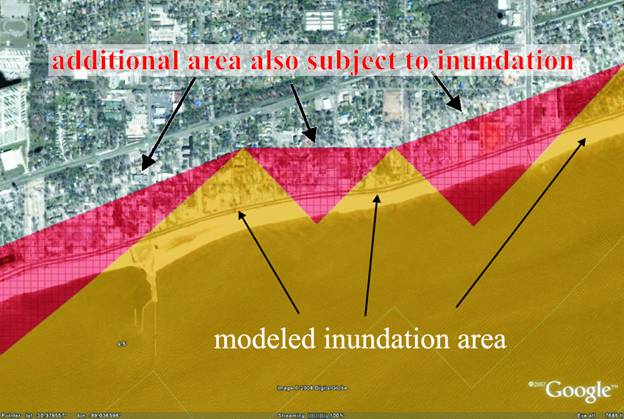
- No. Points of interest that are displayed as dry but are close to the edge of an inundated area should also be considered extremely vulnerable to hurricane storm surge. As an example, in the accompanying illustration the actual model data do not show the red areas as inundated. Yet they are as vulnerable to storm surge as are the actual inundation areas, which are shown in yellow.
OFFICIAL FORECASTS
WATER OBSERVATIONS
WIND GUIDANCE
HURRICANE TRACKS
- HVX - Hurrevac
- HFIP Tracks (broken - used to be https://ruc.noaa.gov/tracks)
- NOS Quick Looks
CONTACT
-
For more information about MDL's Storm Surge, please contact: Arthur.Taylor@noaa.gov