LAMP Job Sheets - MDL
GFS-LAMP AWIPS OB7.2 Training Job Sheets
GFS-LAMP AWIPS OB7.2 Training Job Sheets
 |
|---|
| GFS-LAMP Products Available in the NCEP/Hydro Menu |
| Viewing a GFS-LAMP Text Bulletin |
| Displaying Station and Ceiling Height/Visibility Plots |
| GFS-LAMP Products in the Volume Browser |
| Displaying Thunderstorm Probabilities/Best Category |
| Creating GFS-LAMP Time Series Plots |
| Troubleshooting |
| Cannot Display Text Bulletins |
| More Information |
| Introduction to GFS-LAMP |
| GFS-LAMP Website |
Viewing a GFS-LAMP Text Bulletin
Select the Tools Menu
Select the Text Window option
Enter an AWIPS ID (ex: LAVBWI)
Select FOUS11 followed by the appropriate station ID
Choose desired cycle
Click Load and Continue or Load and Close
To view a previously loaded text bulletin, click Load History and select the station

Displaying Station and Ceiling Height/Visibility Plots
Set frames to 26
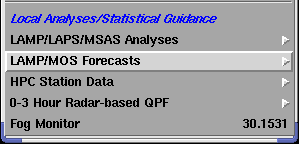
Select the NCEP/Hydro Menu
Under Local Analyses/Statistical Guidance, select LAMP/MOS Forecasts
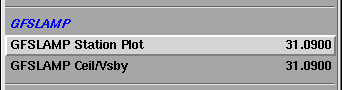
Under GFSLAMP, choose GFSLAMP Station Plot or GFSLAMP Ceil/Vsby
 |  |  |
Displaying Thunderstorm Probabilities/Best Category
Set frames to 14
Select the Volume Menu
Click on Browser... to open the Volume Browser
Select "Plan View" and "Time"
Under Sources, click Grid and choose GFS LAMP-Grid
Under Fields, click Sfc/2D and select GFSLAMP Gridded
Choose one of the following:
Tstorm Prob for 2-HR Thunderstorm Probabilites
Tstorm Occur for Categorical Y/N Forecasts
Make sure Surface Plane is selected (under Planes->Misc)
Click Load to display graphic

Creating GFS-LAMP Time Series Plots
Set frames to 26
Select the Volume Menu
Click on Browser... to open the Volume Browser
Select "Time Series" view. A box labeled "Point A" should appear to the right.
Under the Tools dropdown menu, select "Points." You can choose which station's time series to view in either of the following ways:
On the US map, click and drag one of the points to place it on a station of your choosing -OR-
Under the Tools dropdown, select "Choose Station by ID." In the first box next to one of the point labels, input the four letter station ID and then press Enter. Close the window and make sure the appropriate point is selected at the top of the browser.
Under Sources, click Other and select GFS LAMP-Stn
Under Fields, Select element(s) to display in time series plot by doing any of the following
Click Basic and choose any of the available elements (colored green)
Click Sfc/2D and select GFSLAMP Station or GFSLAMP Gridded
Click Other and choose any of the available elements
(OPTIONAL) If you would like to view an overlay of available verifying observational reports, you can select METAR under Sources->Other to load the observed data for the selected elements under Fields
Make sure Surface Plan is selected (under Planes->Misc)
Click Load to display plot

Cannot Display Text Bulletins
Check the /awips/fxa/data/collective_table.dat file. If this file is from before 2006, it is likely the source of this problem.
To correct this error, do one of the following
Download updated collective_table.dat file from NOAA1
Add header entry of FOUS11 AAALAVXXX in alphabetical order to the collective_table.dat file
Restart data ingest on dx3
Introduction to GFS-LAMP
LAMP is a statistical system which provides forecast guidance for sensible weather elements. The LAMP system was originally designed to update the NGM MOS by using the most recent surface observations, simple locally run model output, and the NGM MOS guidance itself. The NGM-LAMP system has been redeveloped to update the GFS-MOS guidance instead of the NGM-MOS. This system, the Localized Aviation MOS Program (LAMP), is referred to here as GFS-LAMP. GFS-LAMP consists of a series of programs to analyze hourly weather data, run simple numerical models, evaluate statistical forecast equations, and display the resulting information. The statistical forecasts are produced by multiple linear regression equations that combine information from the central GFS-MOS guidance, local model output, and the most recent hourly surface observations. GFS-LAMP guidance updates each hour by using the latest observational information and also furnishes forecasts for hourly projections for over 1500 stations in the CONUS, Hawaii, Alaska, Puerto Rico, and the Virgin Islands with a record of hourly data.
GFS-LAMP provides hourly forecasts for up to 25 projections at locations currently receiving GFS-MOS guidance.
The three simple numerical models used in GFS-LAMP are a sea level pressure model, a moisture model for saturation deficit, and a model producing advective forecasts for variables such as surface temperature and cloud amount. These models are driven by NCEP's GFS model.
The table below details the available GFS-LAMP products and where they can be accessed in AWIPS-D2D.
| Product | Display via: |
|---|---|
Text Bulletin | text database, AWIPS PIL of LAV, NCEP/Hydro Menu |
Station plots of forecast guidance | NCEP/Hydro Menu |
Station Ceiling/Visibility forecast guidance | NCEP/Hydro Menu |
Time series of station guidance | Volume Browser |
Gridded thunderstorm guidance | Volume Browser |
GFS-LAMP Website
For more information about the GFS-LAMP, visit the GFS-LAMP Documentation Page.
To view GFS-LAMP products online, visit the GFS-LAMP Homepage.