


Satellite Operations Updates - Total Operational Weather Readiness - Satellites (TOWR-S)
Loop Heat Pipe Anomaly Impacts on GOES-17 ABI Bands 12 & 16
July 24, 2020
3 minute read
Background
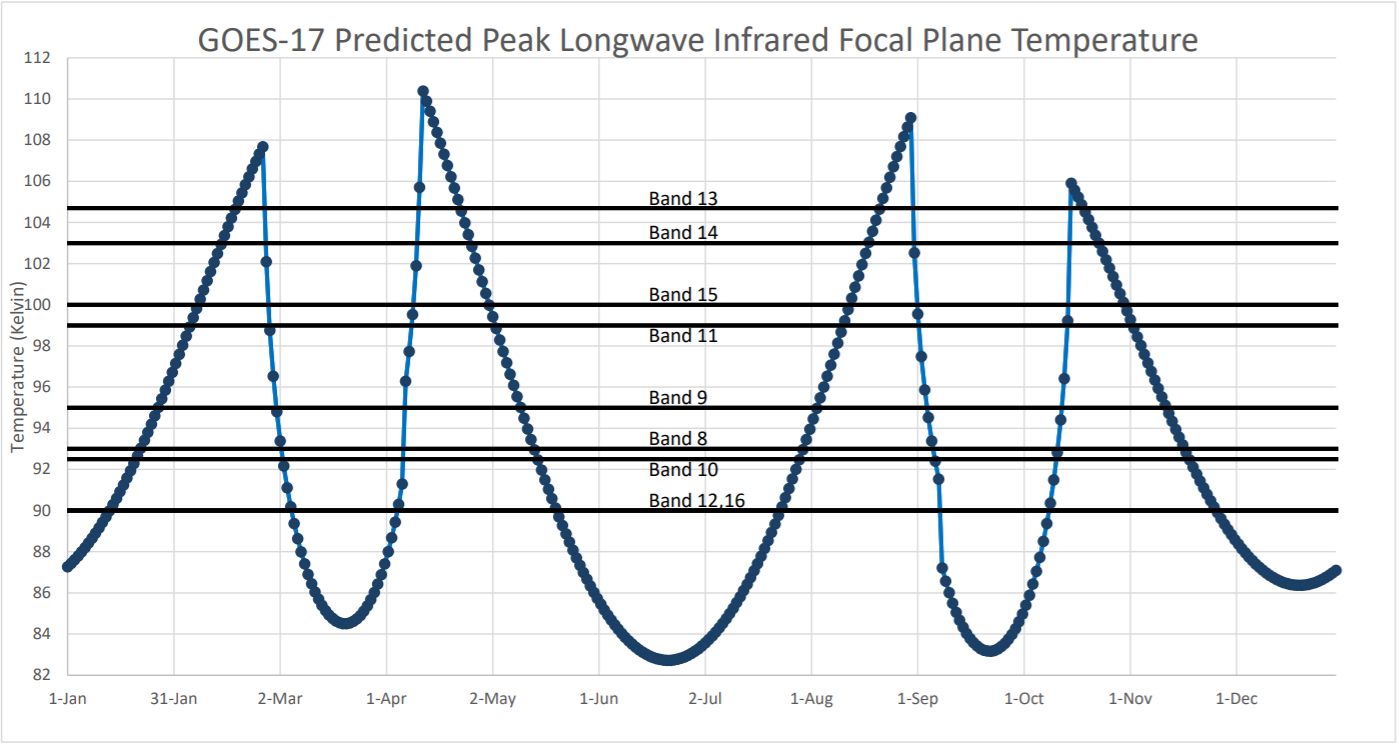
Over the next few days, users of GOES-17 imagery from ABI Band 12 (Ozone IR) and Band 16 (Carbon Dioxide IR) will begin to notice the degradation of the imagery as a result of the seasonal loop heat pipe anomaly. As shown in Figure 1, below, the imagery will continue to deteriorate over the next several weeks until the end of August. It will quickly improve during the first week of September. The TOWR-S team will continue to provide additional updates with information on anticipated impacts as the imagery from the other infrared (IR) bands begin to degrade in the coming weeks.
Figure 1: GOES-17 Predicted Peak Longwave Infrared Focal Plane Temperature
A visual representation of the anticipated daily impacts for Band 12 can be found here and in Figure 2, below. A yellow cell with a "1" indicates estimated minimal to moderate degradation in the imagery for a given hour on a given day. Similarly, a red cell with a "2" indicates estimated severe degradation to the point that the imagery becomes unusable. The hour of day is at the top along the horizontal axis in UTC. The date is to the left along the vertical axis in ascending order.
Figure 2: Anticipated impacts for Band 12 from July 24 - September 7
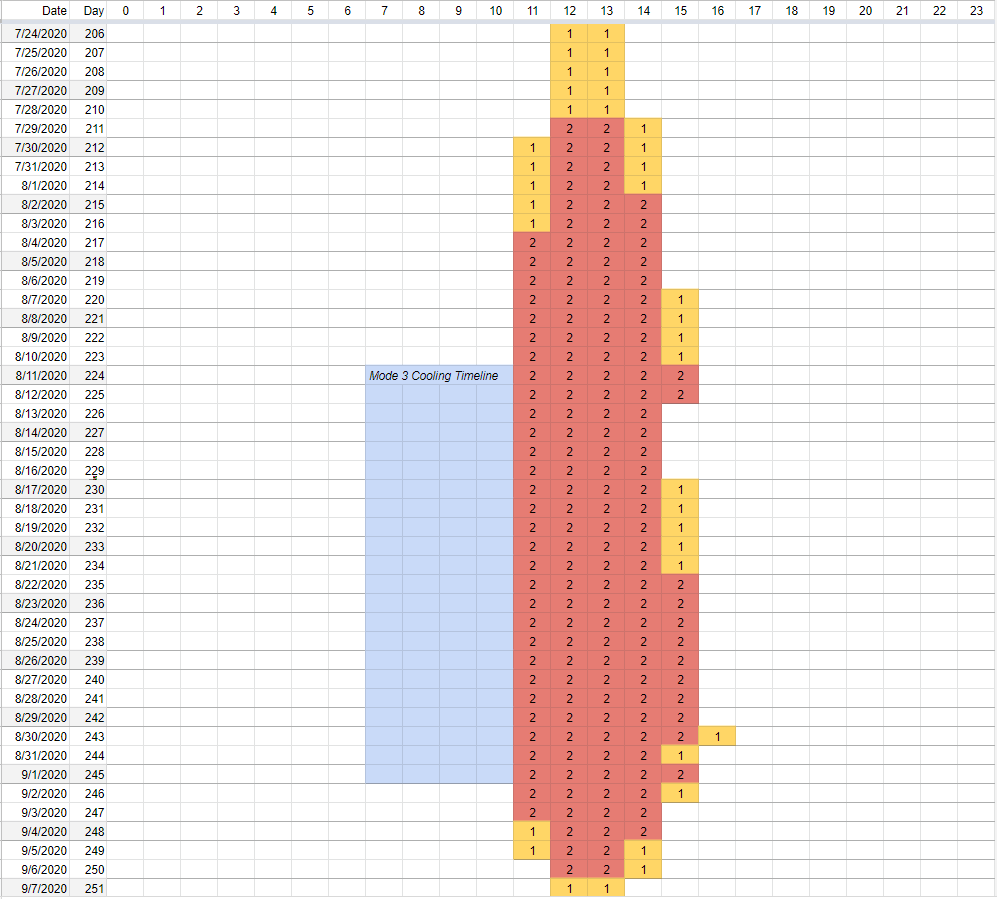
and the vertical axis is the calendar date from July 24 to September 7, 2020 in ascending order.
The table below includes the GOES-17 data products that will be impacted by the degradation of Band 12. A quick guide for each data product is linked in the right column.
| Data Product | Link to Quick Guide |
|---|---|
| Airmass RGB | CIMSS Quick Guide for Airmass RGB |
| Derived Stability Indices | CIMSS Quick Guide for Derived Stability Indices |
| Legacy Vertical Moisture and Temperature Profiles | CIRA Quick Guide for Legacy Vertical Profiles |
| Split Ozone Brightness Temperature Difference | CIMSS Quick Guide for Split Ozone Brightness Temperature Difference |
| Total Precipitable Water | CIRA Quick Guide for Total Precipitable Water |
A visual representation of the anticipated daily impacts for Band 16 can be found here and in Figure 3, below. A yellow cell with a "1" indicates estimated minimal to moderate degradation in the imagery for a given hour on a given day. Similarly, a red cell with a "2" indicates estimated severe degradation to the point that the imagery becomes unusable. The hour of day is at the top along the horizontal axis in UTC. The date is to the left along the vertical axis in ascending order.
Figure 3: Anticipated impacts for Band 16 from July 24 - September 7
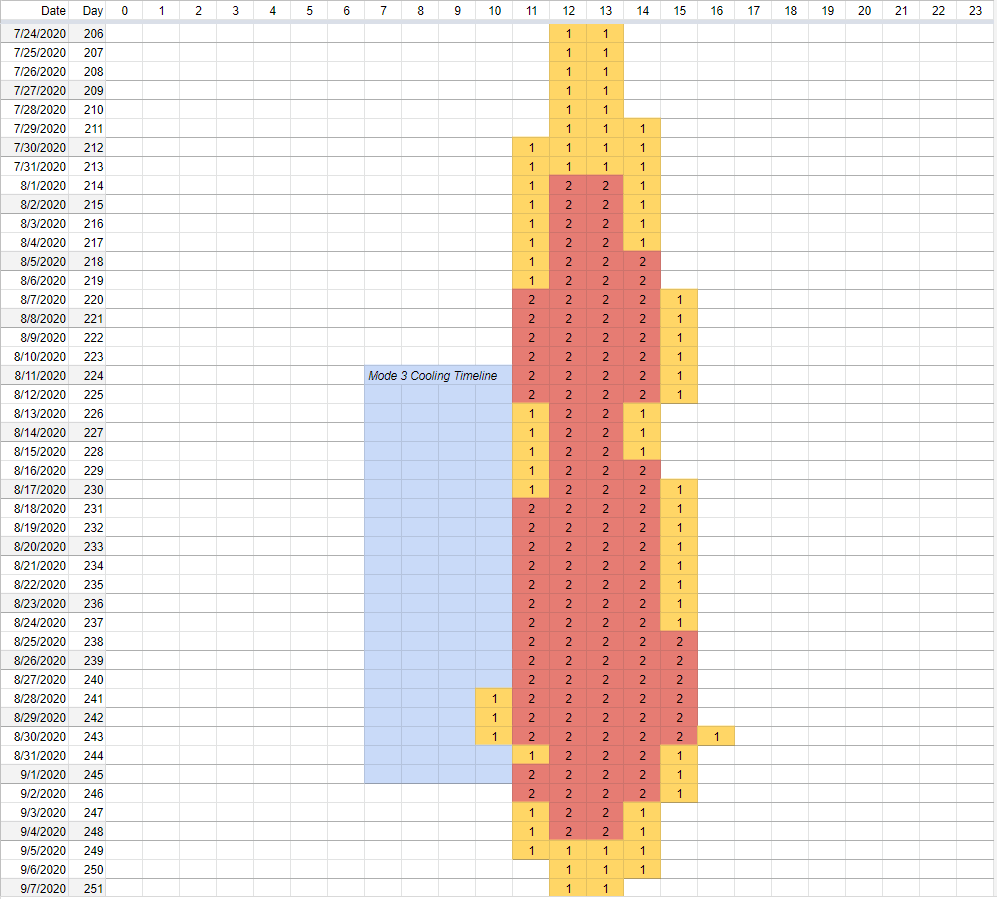
and the vertical axis is the calendar date from July 24 to September 7, 2020 in ascending order.
The table below includes the GOES-17 data products that will be impacted by the degradation of Band 16. A quick guide for each data product is linked in the right column.
| Data Product | Link to Quick Guide |
|---|---|
| Cloud Top Height | CIMSS Quick Guide for Cloud Top Height |
| Cloud Top Pressure | CIMSS Quick Guide for Cloud Top Pressure |
| Cloud Top Temperature | CIMSS Quick Guide for Cloud Top Temperature |
| Derived Stability Indices | CIMSS Quick Guide for Derived Stability Indices |
| Legacy Vertical Moisture and Temperature Profiles | CIRA Quick Guide for Legacy Vertical Profiles |
| Total Precipitable Water | CIRA Quick Guide for Total Precipitable Water |
More Information on the Loop Heat Pipe Anomaly
For additional information regarding this seasonal loop heat pipe anomaly event, including the upcoming supplemental GOES-15 operations and the GOES-17 Mode 3 cooling timeline operations, refer to the article linked here. Mark your calendars for August 20th when Dave Pogorzala from the GOES-R Program will be presenting in the Satellite Book Club on the loop heat pipe anomaly. Stay tuned for more details on that session!