


Satellite Operations Updates - Total Operational Weather Readiness - Satellites (TOWR-S)
GOES-17 ABI Cooling System Impacts Update
April 3, 2020
3 minute read
Background
Throughout the month of February, we noticed the gradual degradation of the GOES-17 ABI infrared (IR) imagery as a result of the Loop Heat Pipe (LHP) anomaly. Toward the end of the month, the effects of the anomaly subsided and the imagery quickly returned to normal by the beginning of March. We will experience another period of degradation beginning over the next few days and peaking sometime around mid-April, as shown in Figure 1 below.
Figure 1: GOES-17 Predicted Peak Longwave Infrared Focal Plane Temperature
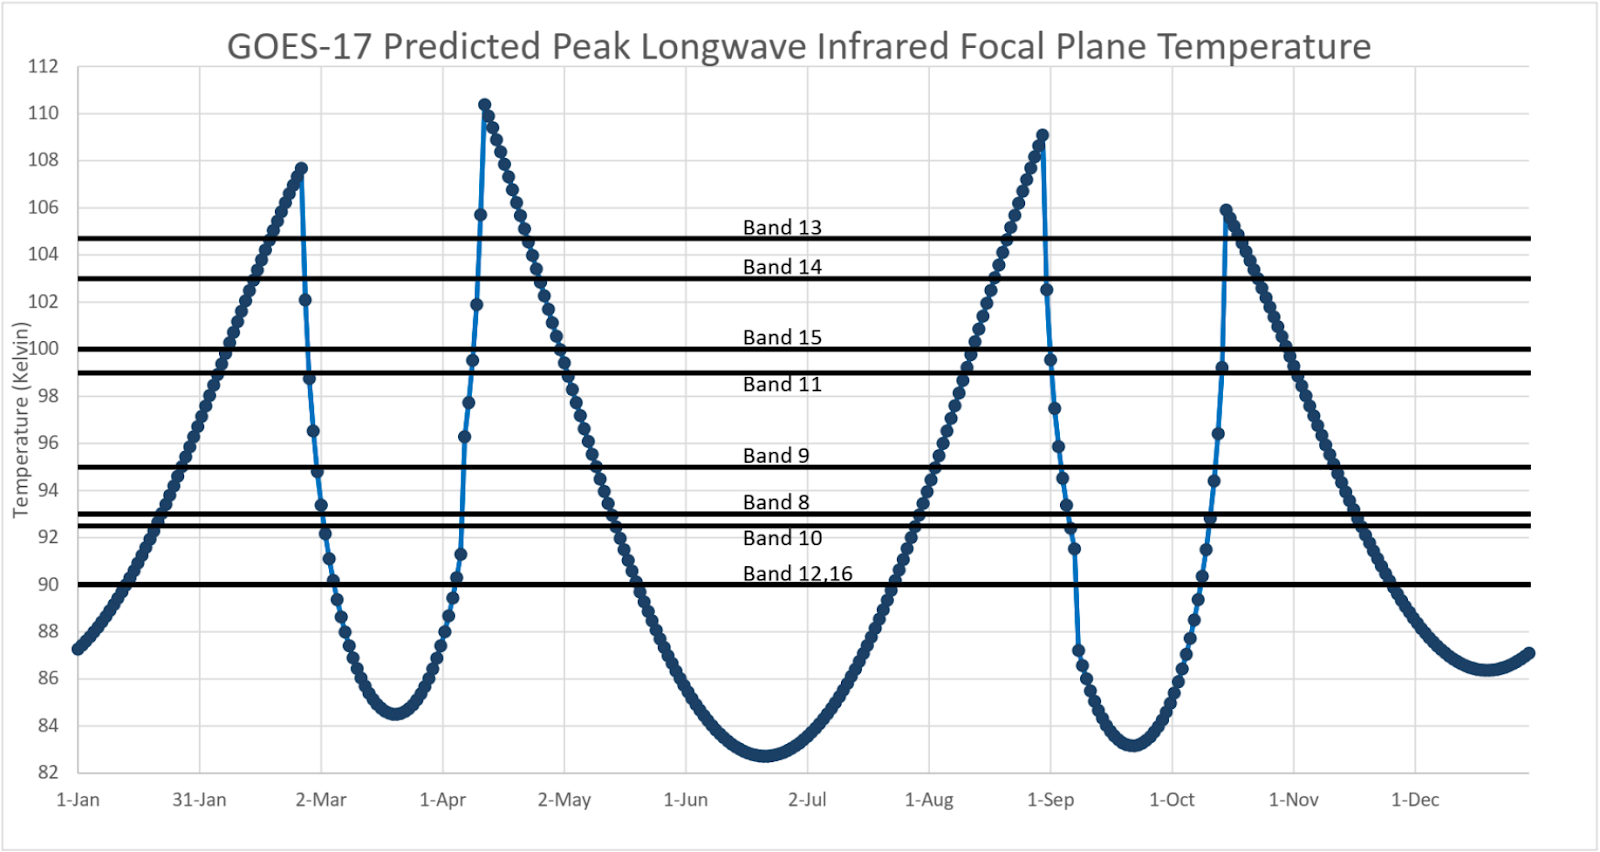
From April 9 through May 1 from 0600z to 1200z each day, NESDIS will conduct a Mode 3 Cooling Timeline for the GOES-17 Advanced Baseline Imager (ABI) to mitigate the number of saturated images resulting from the loop heat pipe (LHP) temperature regulation anomaly. This coincides with the predicted GOES-17 ABI focal plane temperature of 100 K or greater. For more information on this cooling timeline, click here.
After peak heating throughout mid-April, the saturation of the IR channels will gradually improve to low amounts around the middle of May. Following this, imagery will gradually degrade again towards the end of July until it peaks around the end of August. From there, we can expect rapid improvement through the beginning of September before the next event, similar to this upcoming event, in the month of October.
A visual representation of the anticipated daily impacts by channel can be found here, where the numbers in the boxes are the number of GOES-17 ABI bands degraded or lost. The first worksheet (Master) is a summation of the impacts for all the channels combined. An image of this for the upcoming event is shown in Figure 2 below. For example, at 12:00 UTC on April 11th, it is estimated that all nine IR channels (8-16) may be at least partially saturated. The worksheets that follow the “Master” worksheet are an approximate representation of the impact on each individual channel. Note that these are representations of a worst-case scenario. The cooling timeline mentioned above is not currently taken into account in these worksheets.
Figure 2: A summation of the anticipated impacts for all IR channels in April-May 2020
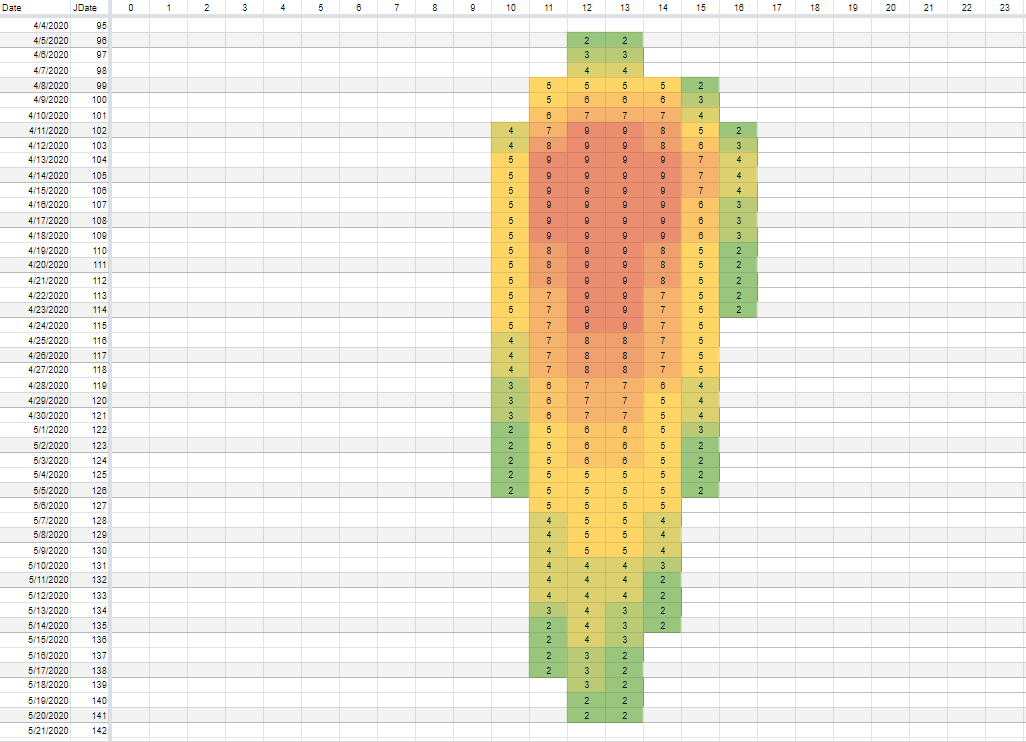
is the calendar date beginning on April 4, 2020 and ending on May 21, 2020 in ascending order.
What is the impact on the IR bands?
The water vapor bands, channels 8-10, are some of the first channels to fully saturate. These channels should begin to degrade around April 6th. Expect to lose these channels entirely, for up to six hours per day, during peak saturation periods starting around April 12th. Below is an image of what saturation for channel 8, the 6.19um channel, looks like in AWIPS. This is a full disk image taken at 13:00 UTC on February 3, 2020. Note that in cases of extreme saturation, some imagery looks essentially blank in AWIPS.
Figure 3: AWIPS GOES-17 Full Disk image showing what saturation looks like for the channel 8 (6.19um) water vapor band.

The “Clean IR” band (channel 13) and the “Legacy IR” band (channel 14) will never fully saturate, however there will be some striping evident when the sensor reaches its peak heating beginning around April 12th.
We want to hear from you!
Have you experienced a case where degraded or missing imagery affected the forecast or warning process? If so, please send us your feedback, including imagery examples, on the GOES-17 Loop Heat Pipe impacts. You can also route any related questions or comments to the TOWR-S team on NWSChat. Join the group “towr-s.”