About
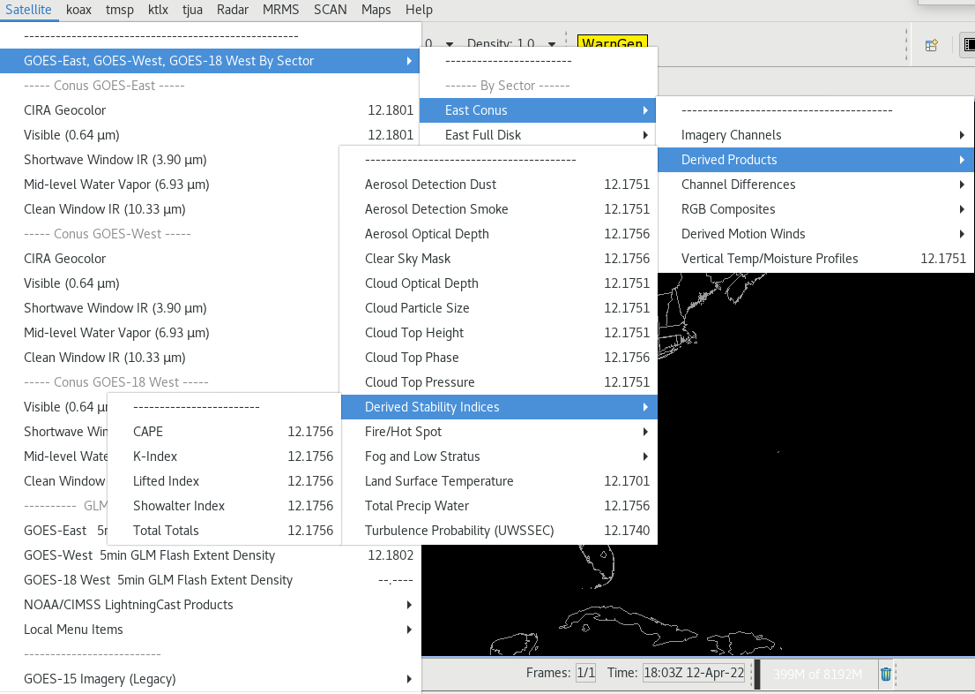
Derived Stability Indices are used to predict the likelihood of convection development. There are five indices available: Total Totals, K, Showalter, Lifted, and Convective Available Potential Energy (CAPE). These datasets measure the stability of the atmosphere as a gradient, indicating where convection might occur and where the atmosphere is most stable.
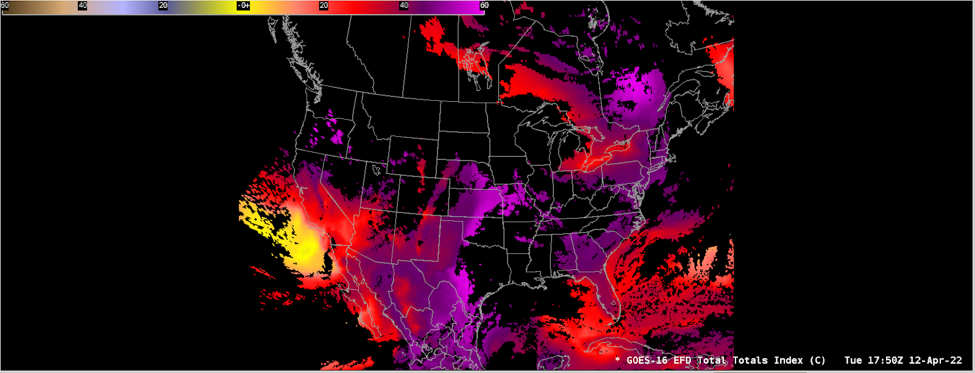
The Total Totals Index (TT) is derived from the difference in air temperature between 850 and 500 hPa (the vertical totals) and the difference between the dew point temperature at 850 hPa and the air temperature at 500 hPa (the cross totals). TT is the sum of the vertical and cross totals.
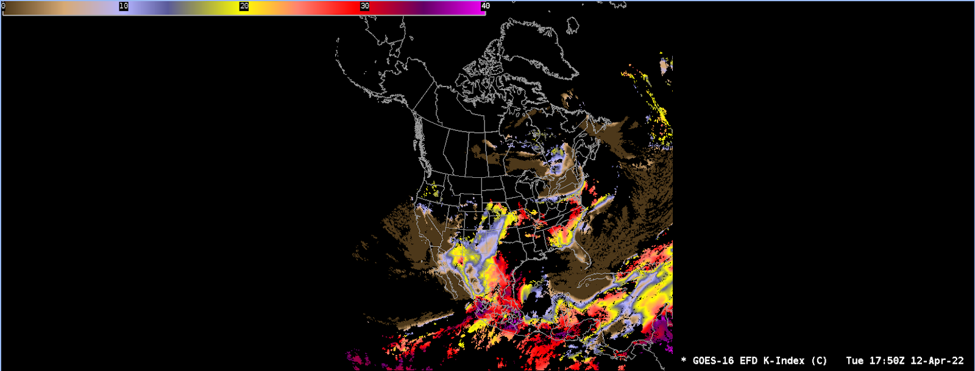
The K Index (KI) is the difference in air temperature between 850 and 500 hPa, the dew point temperature at 850 hPa, and the difference between the air temperature and the dew point temperature at 700 hPa.
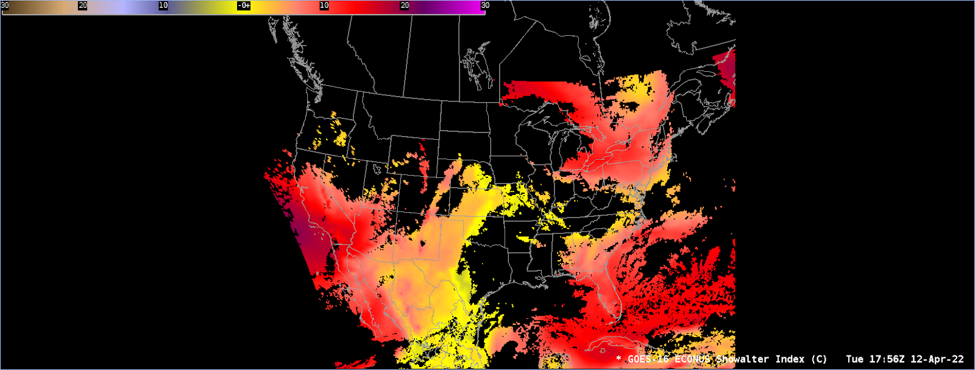
The Showalter Index (SI) is the temperature difference between a parcel of air lifted from 850 to 500 hPa (wet adiabatically) and the ambient air temperature at 500 hPa.
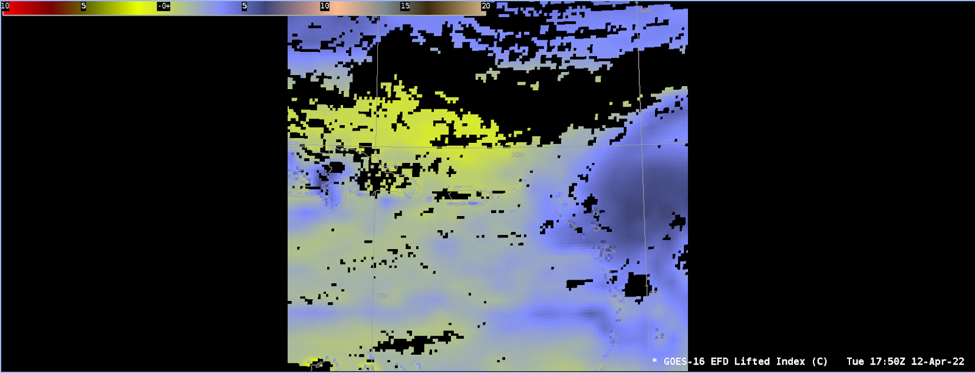
The Lifted Index (LI) is the temperature difference between a parcel of air lifted adiabatically from the surface to a finishing air pressure of 500 hPa in the troposphere and the ambient air temperature at the finishing air pressure in the troposphere.
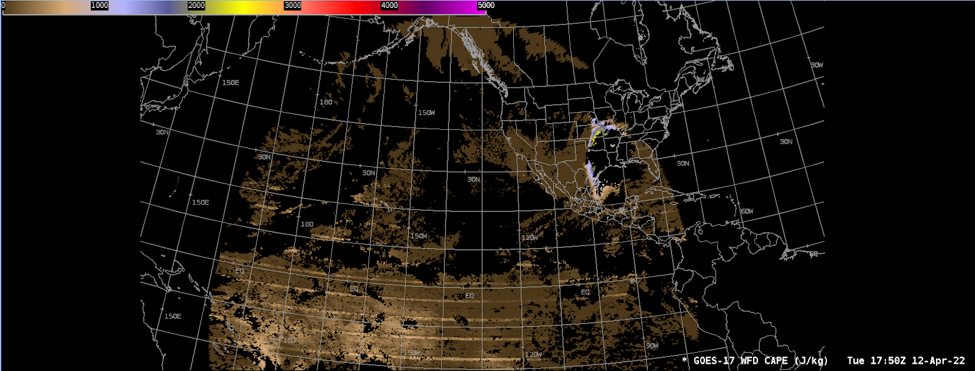
The CAPE is calculated by integrating the positive temperature difference between the surrounding atmosphere and a parcel of air lifted adiabatically from the surface to its equilibrium level. It exists under conditions of potential instability, and measures the potential energy per unit mass that would be released by the unstable parcel if it were able to convect upwards to equilibrium.
Limitations
Cloud Cover: This product only operates in clear-sky conditions.
Resolution: While the ABI Infrared channels have 2 km resolution, these stability indices have a resolution of 10 km.