


VIIRS Flood Mapping - Total Operational Weather Readiness - Satellites (TOWR-S)
About
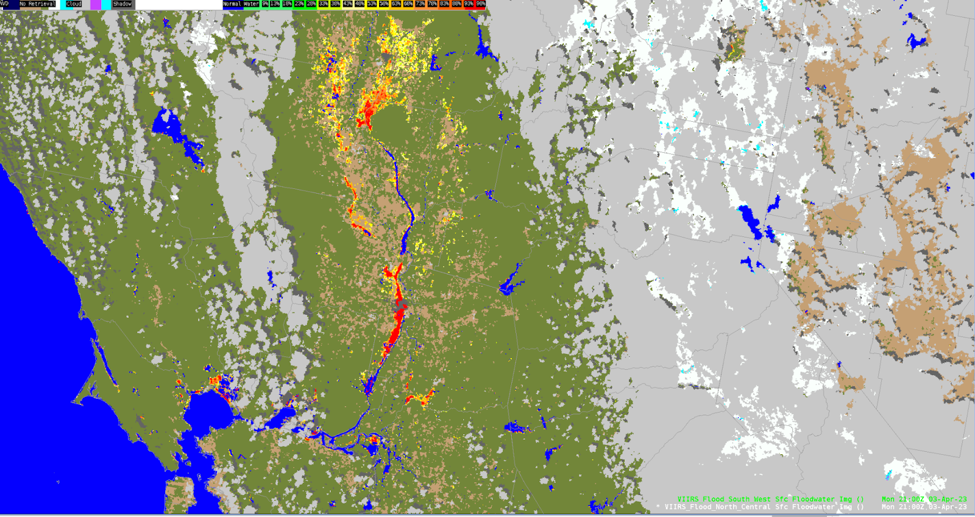
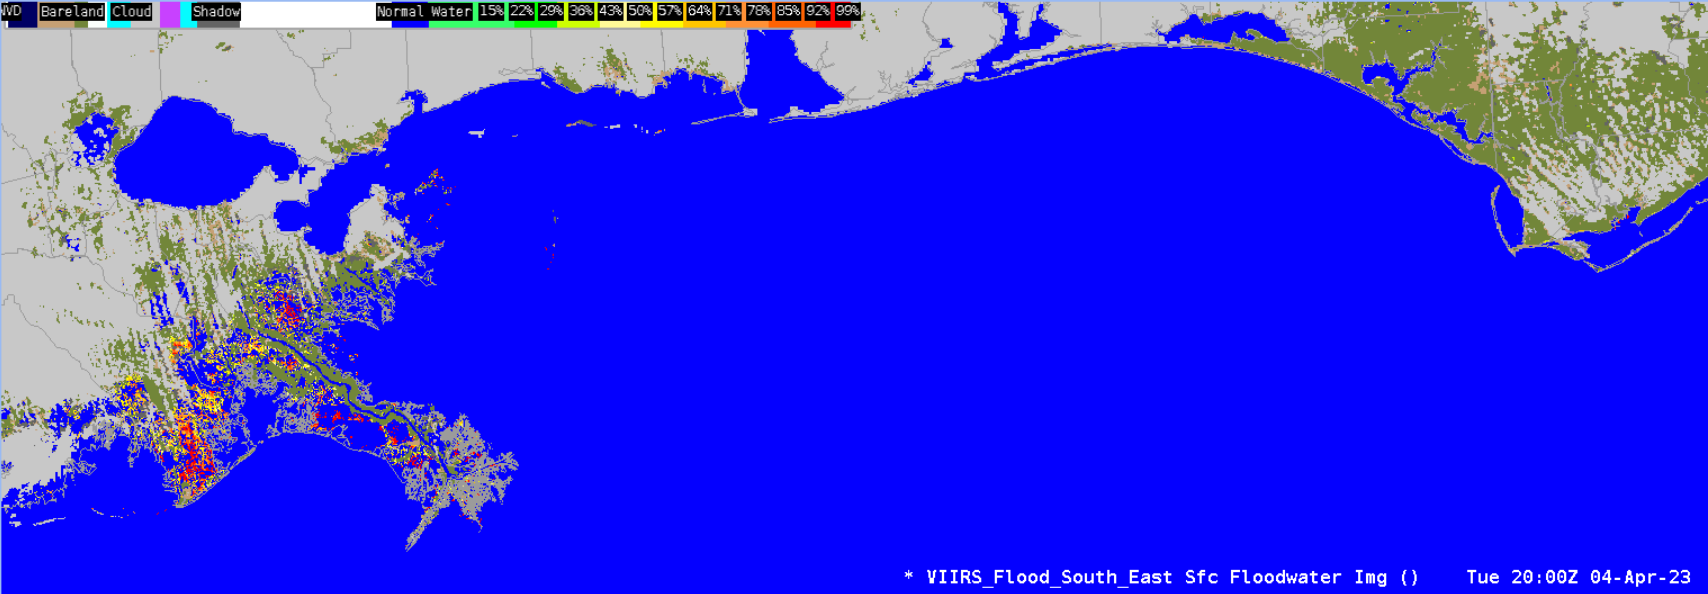
The VIIRS Flood Mapping (VFM) product depicts flood extent (floodwater fraction) inferred from imagery produced by the Visible and Infrared Imaging Radiometer Suite (VIIRS) aboard polar-orbiting satellites in the Joint Polar Satellite System (JPSS). Here, flood is defined as an overflow of water that submerges land that is normally dry. The floodwater detected in VFM includes disastrous floodwater (caused by ice-jam/snow-melting or intensive rainfall that brings about damages or economic loss), and non-disastrous floodwater (such as tides, agriculture-related water and other hydrologic-activity-related water).
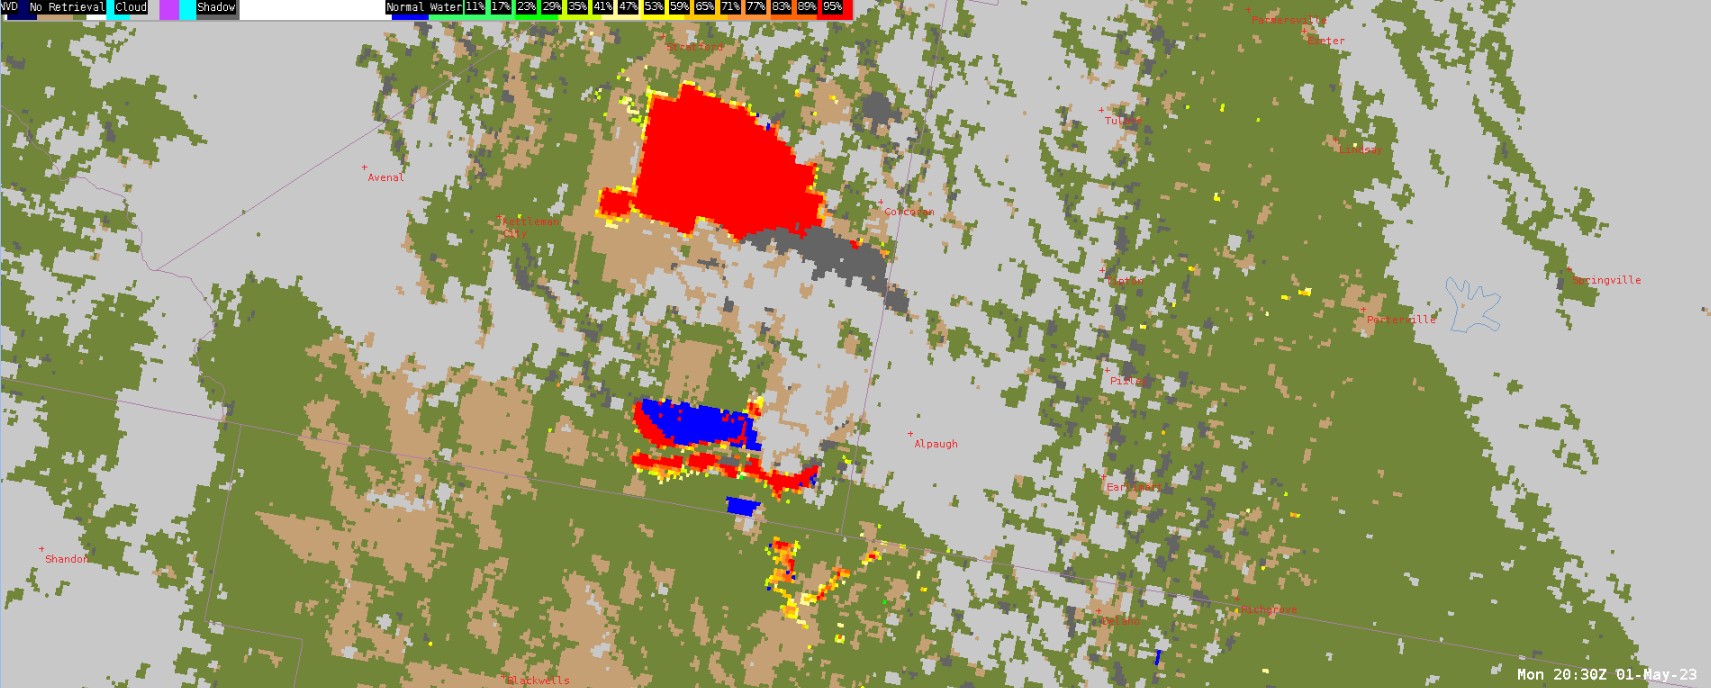
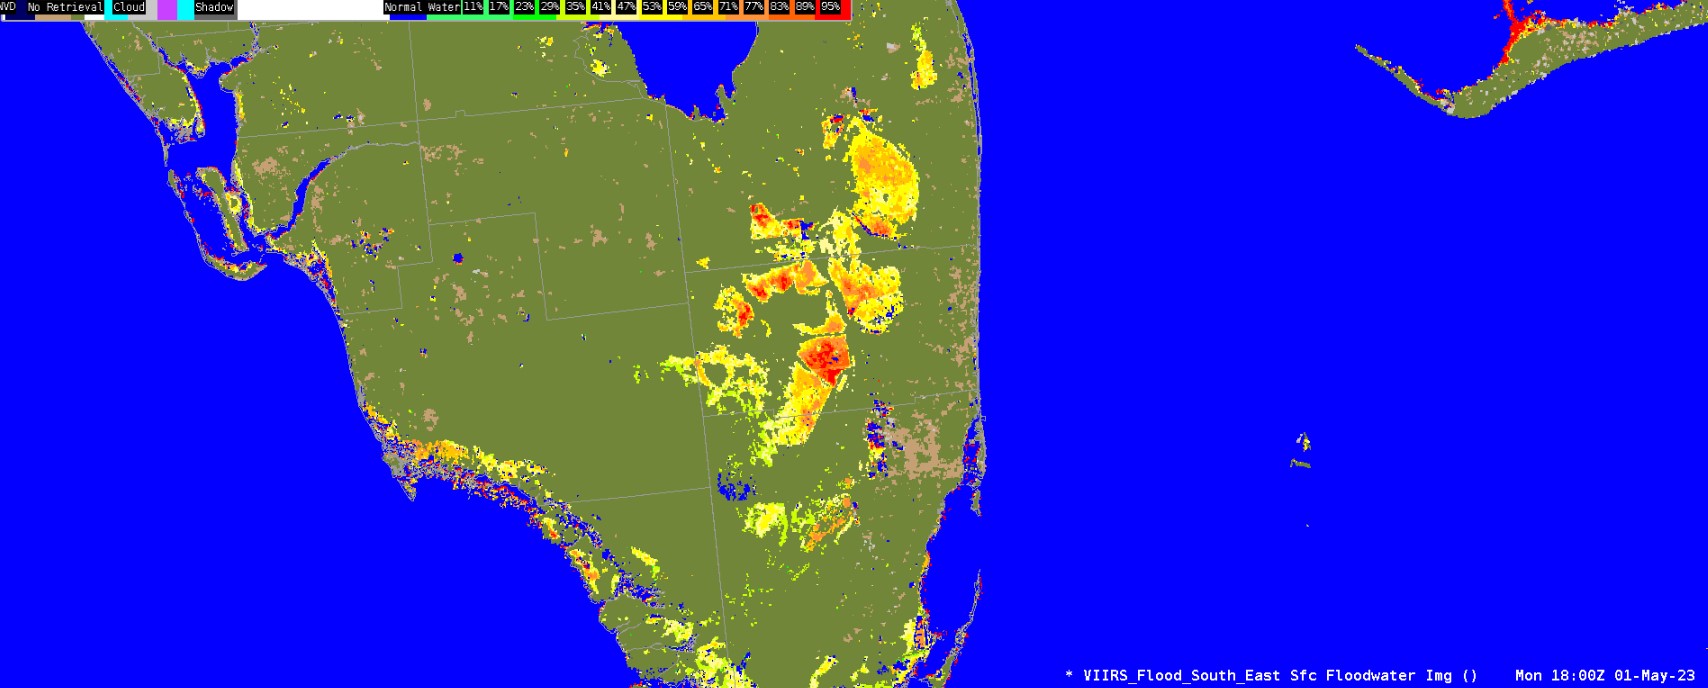
The VFM product estimates each pixel’s floodwater fraction – the degree (0% to 100%) to which each VIIRS pixel is covered by floodwater. Alternatively, VFM may indicate that a pixel is normally water (lakes, rivers, oceans), or is currently covered by snow, ice, clouds, or cloud shadows. (For pixels with no flooding, water, cloud cover, snow, or ice, VFM indicates whether the predominant landcover is bare land or vegetation.) Each VIIRS pixel is about 375x375 meters, so VFM offers a much more detailed view of flood extent than is possible with the current generation of geostationary imagers.
VFM is available for 8 different regions defined by longitude / latitude bounds (depicted below):
Alaska, North West, Missouri Basin, North Central, North East, South West, West Gulf, South East
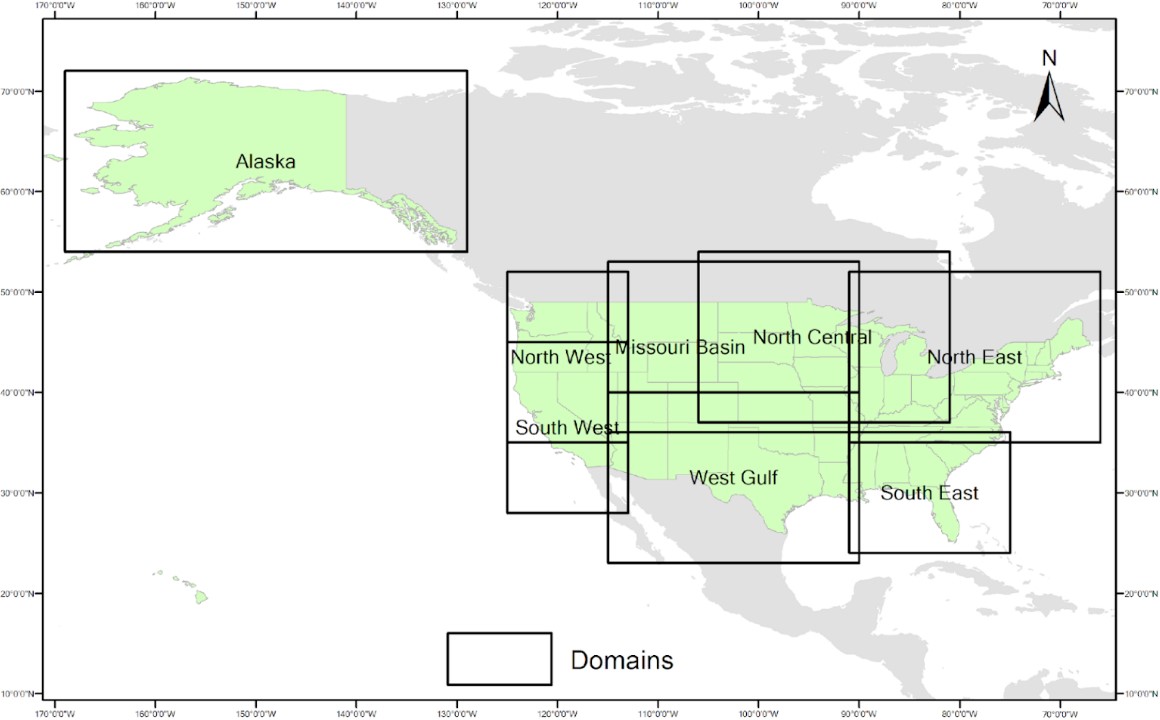
The 8 regions defined for VIIRS Flood Maps
Limitations
Cloud Cover: Cloud cover and cloud shadows prevent flood detection.
Daytime Only: Flood detection is only possible in daylight; each JPSS satellite observes each of the 7 CONUS regions (or a portion thereof) about twice each afternoon. (Alaska flood maps are more frequent, outside of winter months.)
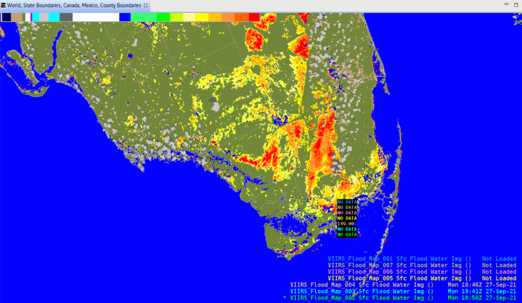
Regions vs Swaths: The swaths observed by JPSS satellites are not congruent with the 8 regions; so at certain times flood information may be available for only a portion (“sliver”) of a region.
CAVE Memory Capacity: Because each VFM region’s data grid consists of several thousand rows and columns, displaying several regions at once can fill the memory allocated to CAVE. For this reason, AWIPS sites are normally configured to receive and display VFM for only one or two of the 8 regions.

Submit questions and suggestions for the TOWR-S pages using this short form.