


Satellite Operations Updates - Total Operational Weather Readiness - Satellites (TOWR-S)
Loop Heat Pipe Anomaly Impacts on GOES-17 ABI Band 11
August 10, 2020
2 minute read
Over the next few days, users of GOES-17 imagery from ABI Band 11 (Cloud-Top Phase IR) will begin to notice the degradation of the imagery as a result of the seasonal loop heat pipe anomaly. A visual representation of the anticipated daily impacts for Band 11 can be found here and in Figure 1, below. A yellow cell with a "1" indicates estimated minimal to moderate degradation in the imagery for a given hour on a given day. Similarly, a red cell with a "2" indicates estimated severe degradation to the point that the imagery becomes unusable. The hour of day is at the top along the horizontal axis in UTC. The date is to the left along the vertical axis in ascending order.
Figure 1: Anticipated impacts for Band 11 from July 24 - September 7
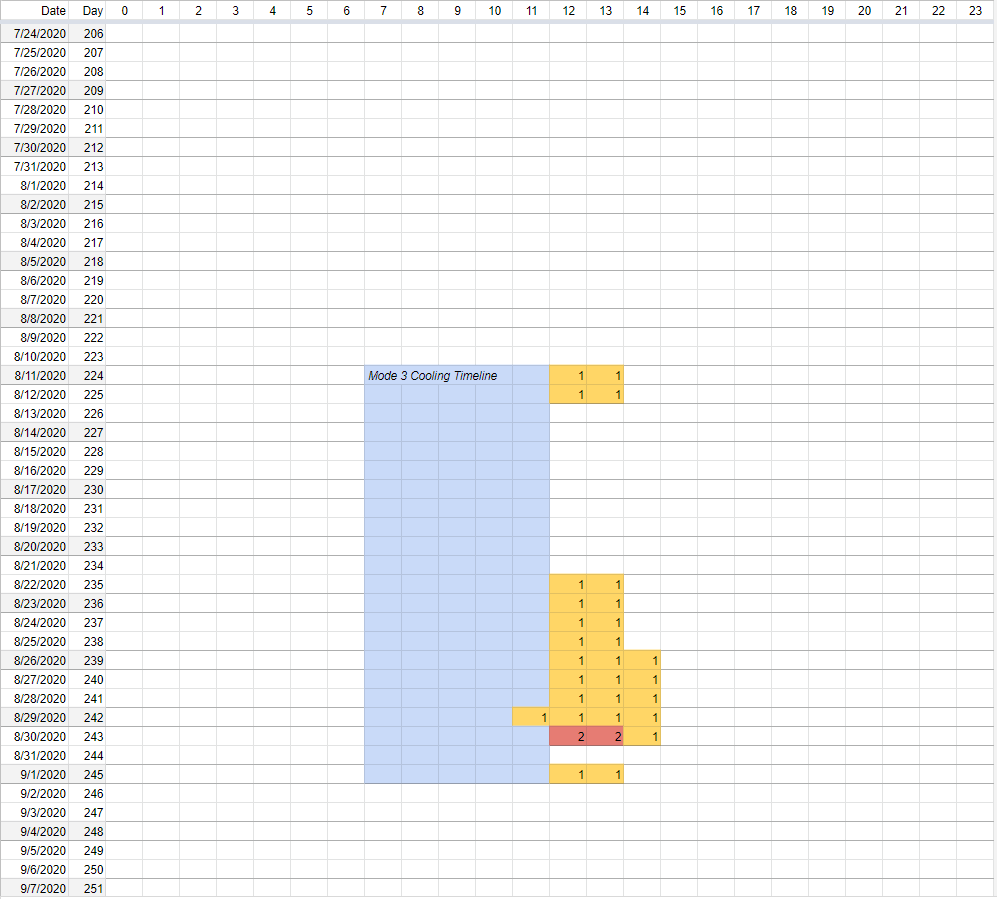
and the vertical axis is the calendar date from July 24 to September 7, 2020 in ascending order.
Operational Impacts from Band 11 Degradation
Band 11 (8.5 µm) is the "Cloud-Top Phase R" band on the ABI. As a "window" channel, there is little atmospheric absorption of energy in clear skies at this wavelength (unless SO2 from a volcanic eruption is present). This channel is sensitive to SO2, and therefore has a significant role in detecting volcanic ash. Additionally, when compared with the 11.2 um (window IR channel 14), their different emissivity properties result in the ability to determine cloud phase. The impact of the loop heat pipe anomaly degradation to this band includes decreased ability to monitor volcanic activity, to monitor convective growth potential via cloud phase changes, and to delineate cirrus thickness. More information on Band 11 can be found in this quick guide from CIMSS and this article published in the Journal of Operational Meteorology.
Impacted Data Products
The table below includes the GOES-17 data products that will be impacted by the degradation of Band 11. A quick guide for each data product is linked in the right column.
| Data Product | Link to Quick Guide |
|---|---|
| Clear Sky Mask | CIMSS Quick Guide for Clear Sky Mask |
| Cloud Top Phase | CIMSS Quick Guide for Cloud Top Phase |
| Legacy Vertical Moisture and Temperature Profiles | CIRA Quick Guide for Legacy Vertical Profiles |
| Total Precipitable Water | CIRA Quick Guide for Total Precipitable Water |
| Dust RGB | CIRA Quick Guide for Dust RGB |
| Sulfur Dioxide (SO2) RGB | CIRA Quick Guide for SO2 RGB |
| Split Cloud Phase Brightness Temperature Difference | CIMSS Quick Guide for Split Cloud Phase Difference |
More Information on the Loop Heat Pipe Anomaly
For additional information regarding the upcoming GOES-17 Mode 3 cooling timeline operations, refer to the article linked here. Mark your calendars for August 20th when Dave Pogorzala from the GOES-R Program will be presenting in the Satellite Book Club on the loop heat pipe anomaly. Stay tuned for more details on that session!