


Satellite Operations Updates - Total Operational Weather Readiness - Satellites (TOWR-S)
GOES-17 ABI Cooling System Impacts Update
July 22, 2020
3 minute read
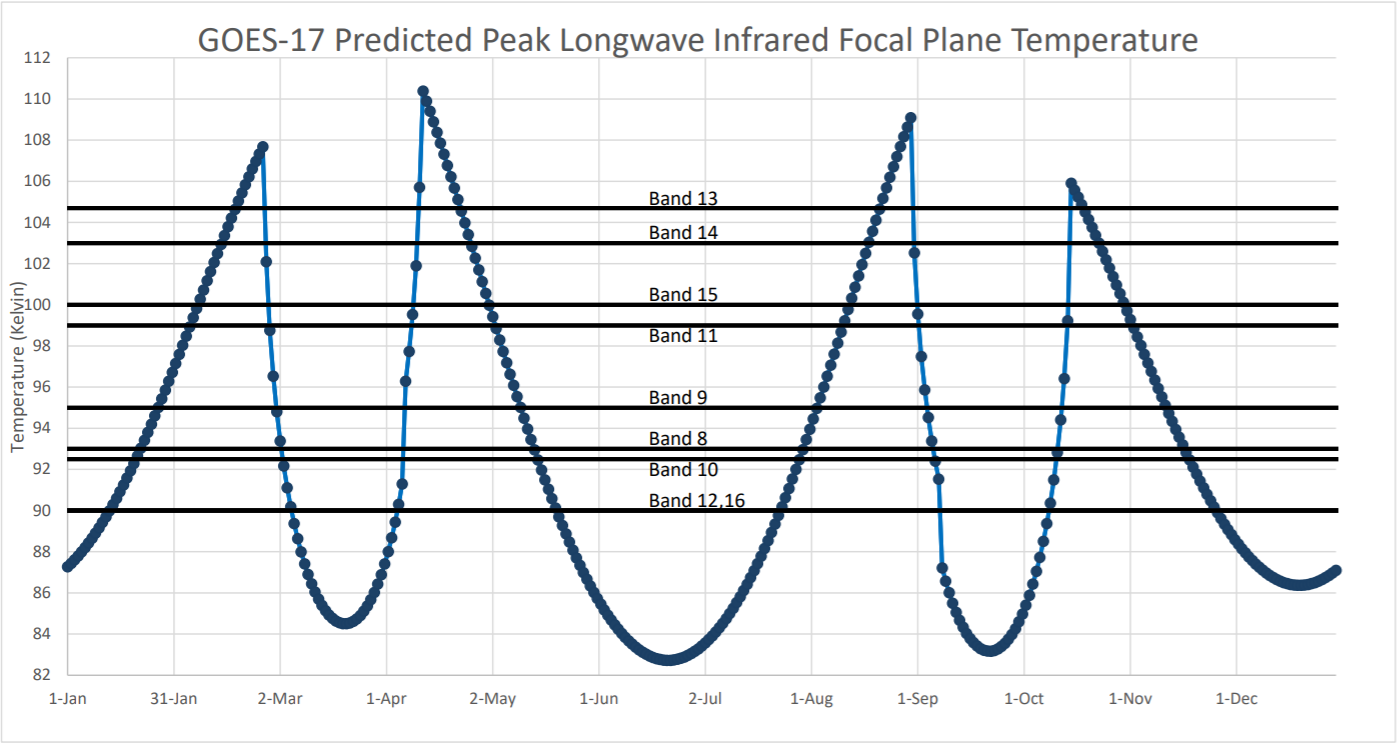
As we approach the end of July, users will begin to notice the gradual degradation of the GOES-17 Advanced Baseline Imager (ABI) infrared (IR) imagery as a result of the Loop Heat Pipe (LHP) anomaly. This degradation will continue through August and peak around the end of the month. Imagery will quickly improve throughout the first week in September, as shown in Figure 1 below. The TOWR-S team will provide updates with information on anticipated impacts as the imagery from the individual bands begins to degrade over the next several weeks.
Figure 1: GOES-17 Predicted Peak Longwave Infrared Focal Plane Temperature
What are the anticipated impacts?
A visual representation of the anticipated daily impacts by band can be found here, where the numbers in the cells are the number of degraded GOES-17 ABI bands. The first worksheet (Master) is a summation of the impacts for all the bands combined. An image of this for the upcoming event is shown in Figure 2 below. For example, at 12:00 UTC on August 26, it is estimated that all nine IR bands (8-16) may be at least partially saturated. The worksheets that follow the “Master” worksheet are an approximate representation of the impact on each individual band. Note that these are representations of a worst-case scenario. The cooling timeline mentioned below is not currently taken into account in these worksheets.
Figure 2: Anticipated impacts for all IR bands combined from July 24 - September 7

and the vertical axis is the calendar date from July 24 to September 7, 2020 in ascending order.
Supplemental GOES-15 Operations
From August 9 at 0000 UTC through September 3 at 1600 UTC, NESDIS will return the GOES-15 imager to temporary service for additional support purposes for Eastern Pacific tropical cyclones by providing imager only coverage. The GOES-15 operating position will be at 128 degrees west. GOES-17 will continue operating in the GOES-West role at 137.2 degrees with all instruments operating nominally. GOES-15 will be running a routine west schedule. For AWIPS users, GOES-15 imagery bands will once again update under the primary Satellite menu. Read the full message on the upcoming supplemental GOES-15 operations from the Office of Satellite and Product Operations (OSPO) here.
From August 11 through September 1 from 0600 UTC to 1200 UTC each day, NESDIS will conduct a Mode 3 Cooling Timeline for the GOES-17 ABI to mitigate the number of saturated images resulting from the LHP anomaly. This coincides with the predicted GOES-17 ABI focal plane temperature of 100 K or greater. In Mode 3, the GOES-17 ABI will generate a single full disk once every 15 minutes and generate one mesoscale domain sector each minute. Alternating MESO domains will be collected one time each per two minute period. The CONUS domain will not be scanned during the timeline as those periods will be used for cooling. Read the full message on the upcoming GOES-17 cooling timeline from OSPO here.
We want to hear from you!
Have you experienced a case where degraded or missing imagery affected the forecast or warning process? If so, please send us your feedback, and feel free to include sample imagery. Contact Lee Byerle (lee.byerle@noaa.gov) and David Bludis (david.bludis@noaa.gov). You can also route any related questions or comments to Lee and David on NWSChat in the “towr-s” chatroom.