


ARIs - Users - OCLO
ARIs in AWIPS
Training Job Sheets (click on "html" for web page layout with image links or PDF)
- ARI Jobsheets
- Jobsheets are an extension of the ARI training posted in Oct 2020:
- Training in CLC (Internet only): Part 1: Introduction to Average Recurrence Intervals (ARIs)
- Training in CLC (Internet only): Part 2: Using Average Recurrence Intervals (ARIs) in AWIPS
Overview
- Average Recurrence Interval (ARI) data are static precipitation return periods based on the NOAA Atlas 14 analysis of precipitation gauges
- For online access to NOAA Atlas 14 see http://hdsc.nws.noaa.gov/hdsc/pfds
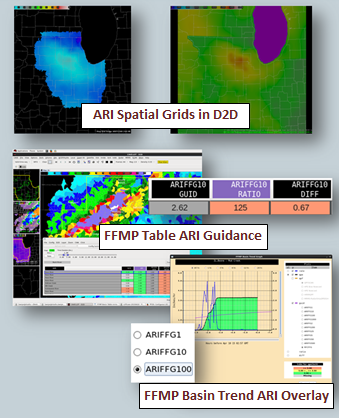
- There are 3 ways for displaying ARI data in AWIPS
- Spatial plots from the SCAN FFMP menu or Product Browser
- FFMP Table: guidance (GUID) source and ratio/diff display in D2D
- FFMP Basin Trend Graph: guidance source overlay
- ARIs are not displayable in AWIPS by default (see configuration page for AWIPS Focal Points).
Refresher Commands
- Loading ARI Spatial Plots
- SCAN-> $FFMP_SOURCE-> Guidance -> ARIFFG* -> *hr Display
- CAVE - Data Browser -> Product Browser
- Grid-> ARI -> ARI#H#YR (e.g. ARI2H50YR is 2hr QPE 50yr ARI)
- Add ARI to FFMP Table as Guidance (GUID) Source
- Under Attributes button select ARIFFG#
- Cycle Through ARIs Quickly in FFMP Basin Trend Graphs
- Launch basin trend (right-click name in table or right-click an "Editable" FFMP display with the FFMP Click menu set to "Basin Trend")
- Select guid checkbox and ARIFFG# radio button
Usage Tips
- Use ARI data to develop more confidence in flash flooding threat, but do not directly include rarity of event in products until you have become familiar with how ARI performs in your area.
- Identify quality of data using the spatial plots before using ARIs in FFMP
- Look for artifacts along regional borders or hot spots (see ARI Images page).
- Become familiar with the overlap in ARIs for a given QPE in your area using 90% confidence intervals and online resources (web)
- Calibrate yourself with what kind of precipitation ARIs equate to flooding
- e.g. maybe 2-yr ARIs generally equate to minor street flooding in urban areas, whereas more significant flash flooding may be more common with 10- to 25-yr ARIs
Limitations
- Gauge historical record is relatively short (< ~150 years) so extrapolations to higher values (e.g. 100-500 years) can have significant variability
- Artifacts can exist along regional analysis boundaries and in hot spots where some events overly influence peak values
- QPE ARIs DO NOT always equate to flood return periods!
- e.g. a 50-year rainfall is not always the same as a 50-year flood
Configuration/Supplemental Information (AWIPS and Hydro Focal Points)
- ARIs are not displayable in AWIPS by default, and data display can be impacted by purging issues. To help the local AWIPS Focal Point configure FFMP for ARI see our ARI FFMP Configuration page.
- For more information on the details of ARIs and how they can be used, see the ARI Supplemental Information page
Contact
- Jill Hardy at Jill.Hardy@noaa.gov