


Ensemble Tool - OCLO
Ensemble Tool
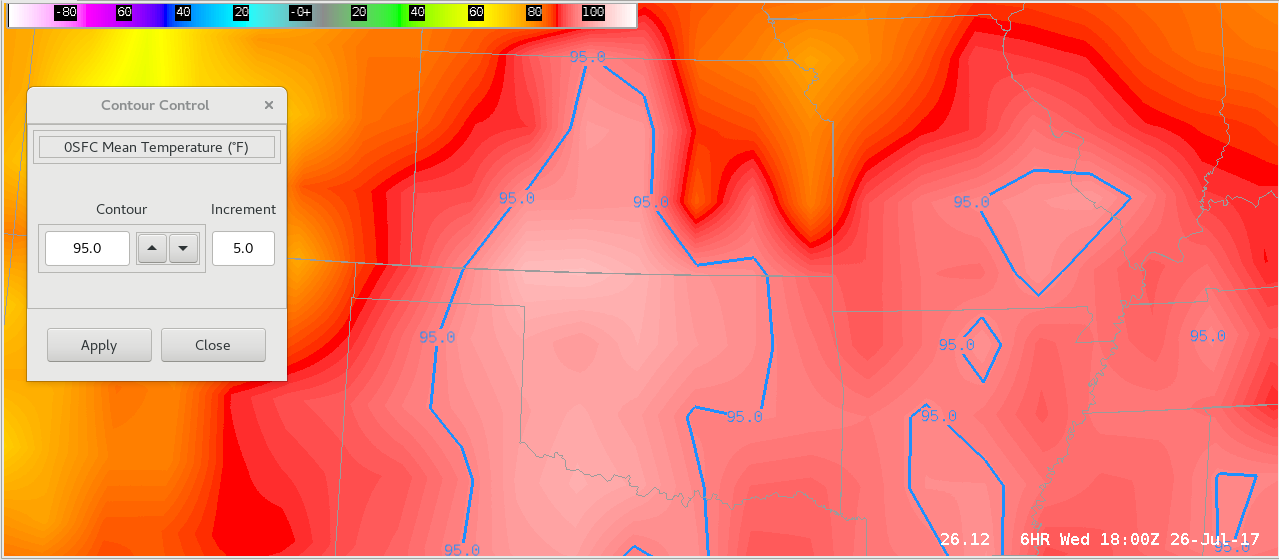
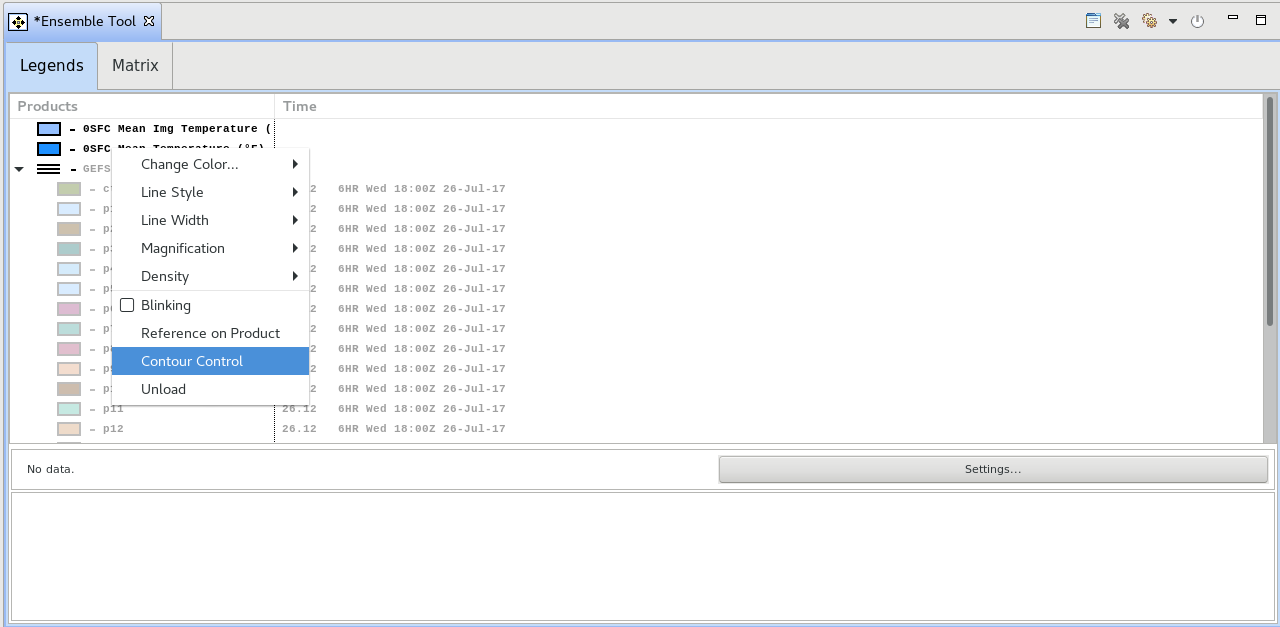
Fig. 1 Legends tab of the Ensemble Tool displaying the mean surface temperature of the 21 GFS Ensemble members as an image field with a 95 degree contour overlayed.
Training Job Sheets (click on "html" for web page layout with image links)
- Ensemble Tool Matrix Viewer (html) *new jobsheet
- Ensemble Tool Image Fields and Contour Controls (html)
- Ensemble Tool GEFS Ensembles (html)
- Ensemble Tool referenced in:
- 16.1.1 Informational Overview (CLC - Internet training, speaker notes PDF)
- 16.2.2 Informational Overview (CLC - Internet training, speaker notes PDF)
Overview:
- Use the Ensemble Tool with the Volume Browser to create ensemble-derived plots like Max precip of all members (see Fig 1) and relative frequency distributions of certain thresholds (e.g. frequency of members of precip > 0.2"), sample individual members values, and sample with a histogram.
Refresher Commands:
- Loading the Ensemble Tool - select Ensemble Tool from Tools menu
- Loading Ensembles - load GEFS data (temperature or precip) in Volume Browser by clicking on the Open Volume Browser icon in upper right, see Fig. 1.
- e.g. Sources->GEFS, Fields->Ensemble->GFS Ensembles->MSLP->MSLP Ens Members (note your VB can have different menus)
- Create Ensembles Derived Field - after loading ensemble members, click on gear icon in upper right of Ensemble Tool and select field (e.g. Max or Sampling)
- Derivation based off the ensemble members that are currently visible in the associated CAVE editor
- Right Click Row in Grid Products Section - to configure display settings for individual members (e.g. p1) or whole ensemble (three bar row)
- Generate relative frequency, change all member colors with a color gradient, and to unload all members
- Load as Image
- Right click on each individual member and select Load as Image
- To load calculations (min, max, etc.), you must click on the gear icon in the top right and select the desired calculation with an Image label
- Contour Control
- Contour a specific value by right clicking on a parameter and selecting Contour Control
- Toggle Visibility - left clicking on individual model member (e.g. p18) or for all members left click on three horizontal bars next to product name (e.g. GEFS Sfc Precipitation (in) in Fig. 1)
- Visibility of individual members affects subsequent calculations like Max, Min, etc.
- Loading Model Families - click on the Matrix button and the "Open a Model Family" icon to its right.
- Select a Model Family and use the Ctrl button to multiple select models under the Sources column.
- Hover over products to identify what they are and select products you want to display.
- Click on model names to toggle between models.
- Build 17.3.1 has caused some faulty behavior when using the Matrix tab, which is addressed in Build 18.1.1
Usage Tips
- Pay attention to what is viewable in the CAVE editor because that will only be used in the derived calculations
- To more easily view derived fields, toggle off all individual members by clicking on the three horizontal bars icon
- If the multicolor display is overwhelming, you can change line colors (e.g. single color gradient) with a right click on the main product row with the three horizontal bars.
- The Matrix display of Model Families is memory intensive, so only toggle on what you want to view before stepping through frames or models.
Limitations
- GEFS (GFS ensemble) precip and surface temperature data is the primary ensemble option at WFOs to use with Ensemble Tool
- Ensemble Tool cannot be saved into a bundle/procedure
Contact
- nws.wdtd.awips@noaa.gov