Purpose:
To display GEFS Ensemble Temperature as an image field and control contour intervals.
Tasks:
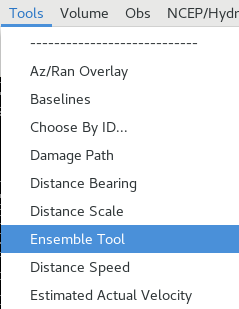
- On CONUS scale, load the Ensemble Tool from the Tools menu (Fig. 1).
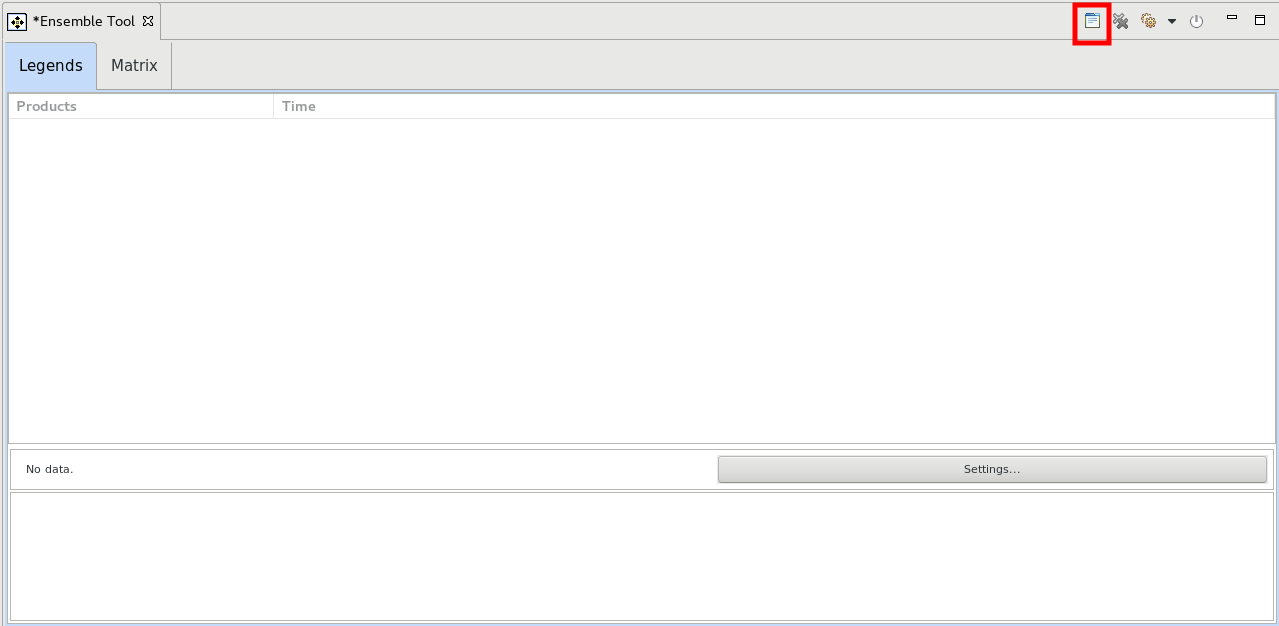
- Left-click on the the Open Volume Browser button in the upper right part of the Ensemble Tool tab (Fig. 2).
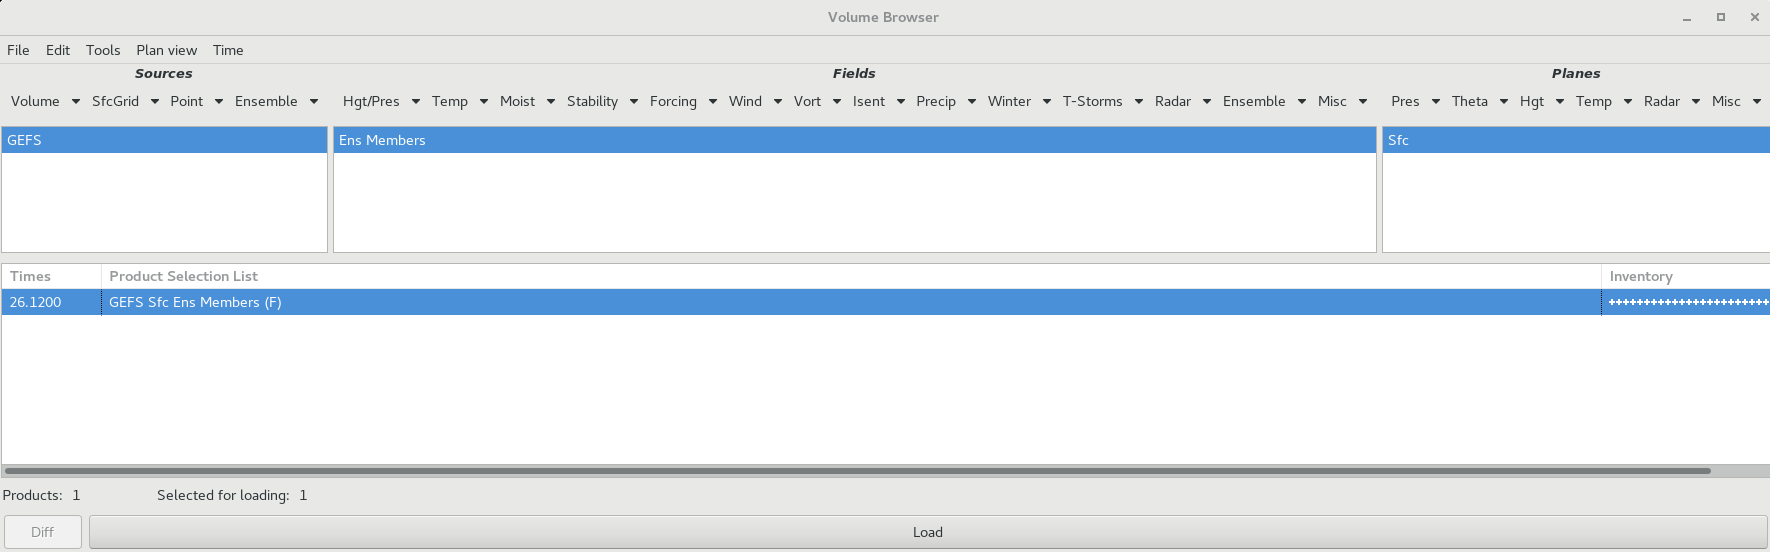
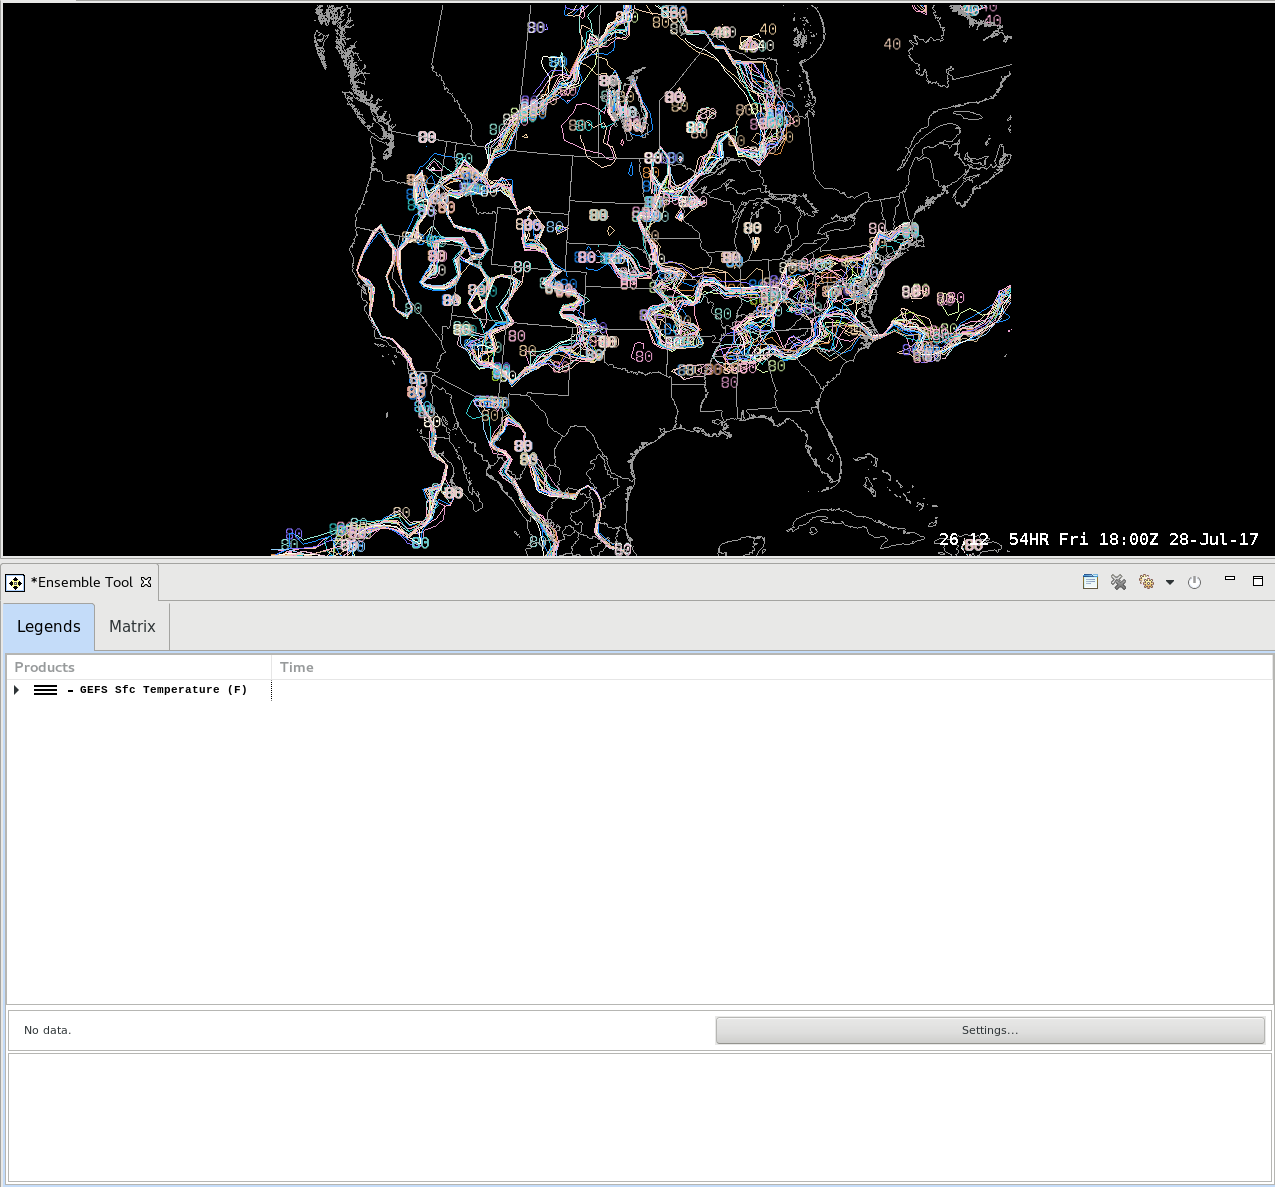
- Load the GEFS surface temperature ensemble members from the Volume Browser (Fig. 3, Fig. 4).
Sources->Ensemble->GEFS
Fields->Ensemble->GFS Ensembles->Temperature->Ens Members
Planes->Misc->Sfc (note your VB menus can be slightly different)
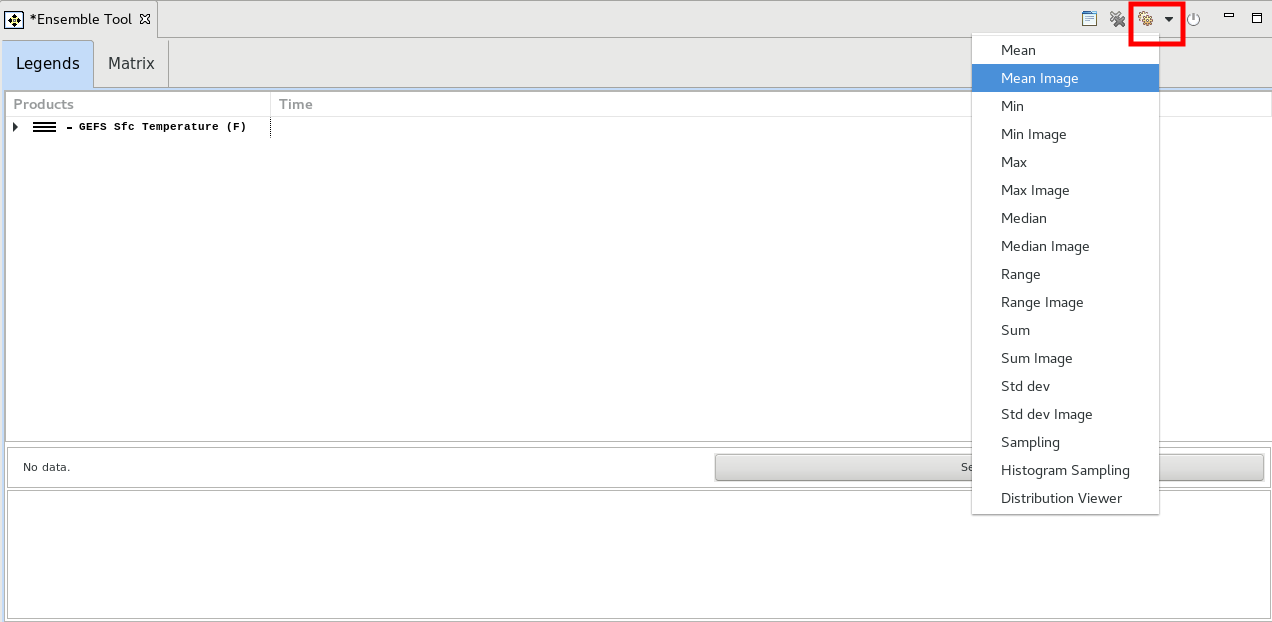
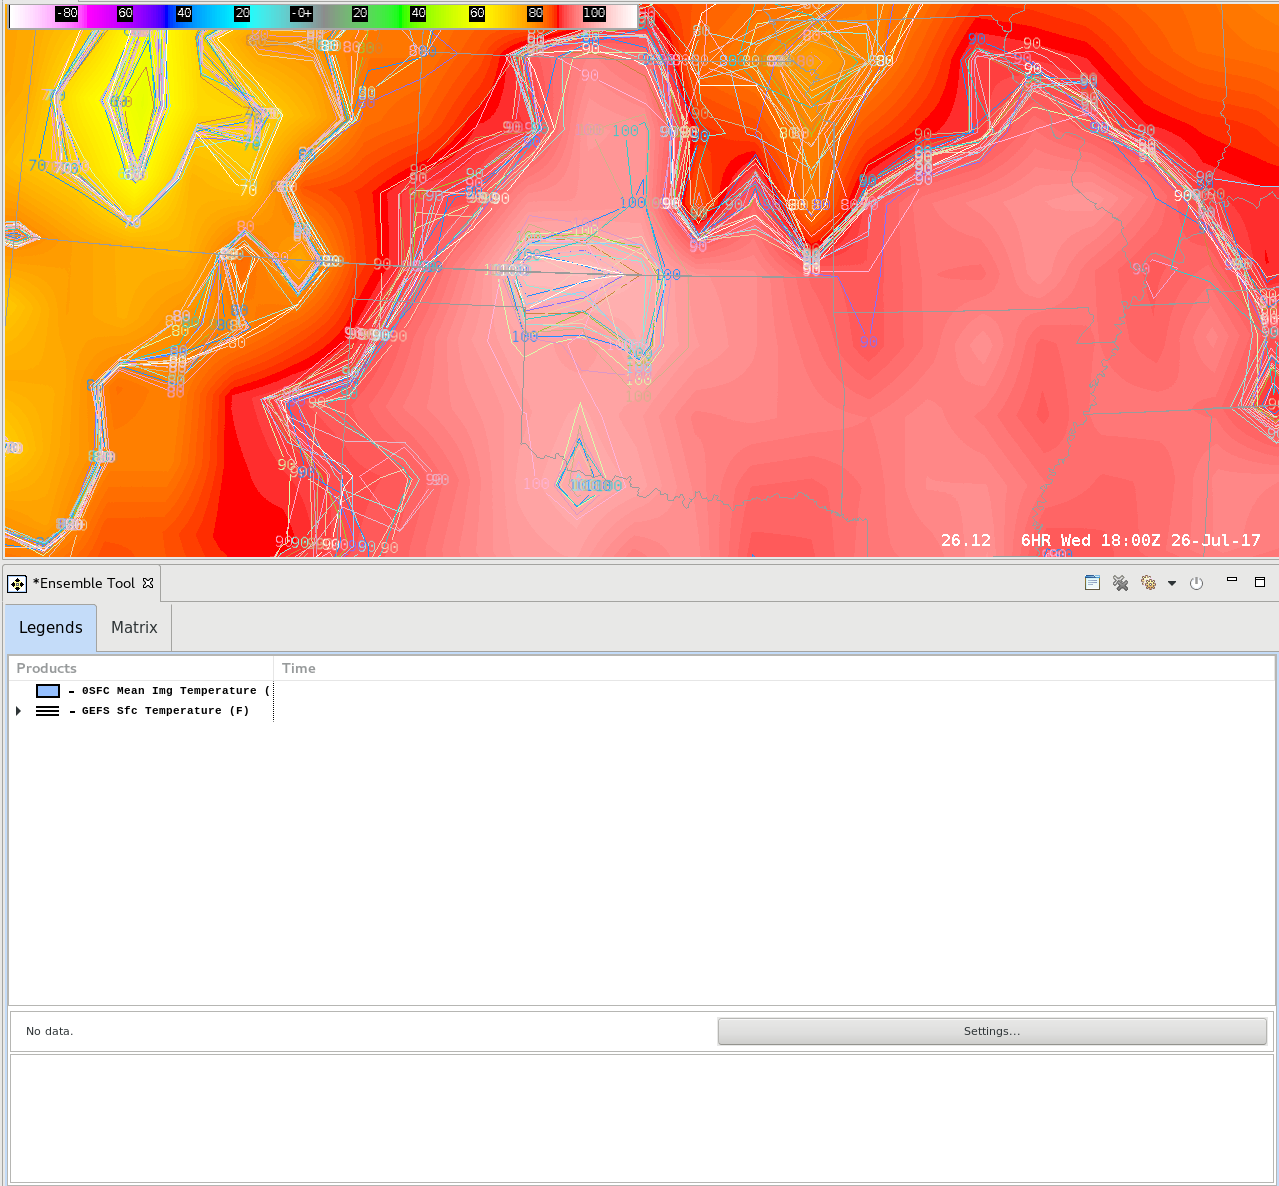
- Left-click in the map editor background then left click on the Gears icon in the top right of the Ensemble Tool tab and select Mean Image (Fig. 5).
- Zoom in on a desired region by using the mouse scroll wheel (Fig. 6).
- Left-click in the map editor background then left click on the Gears icon in the top right of the Ensemble Tool tab and select Mean.
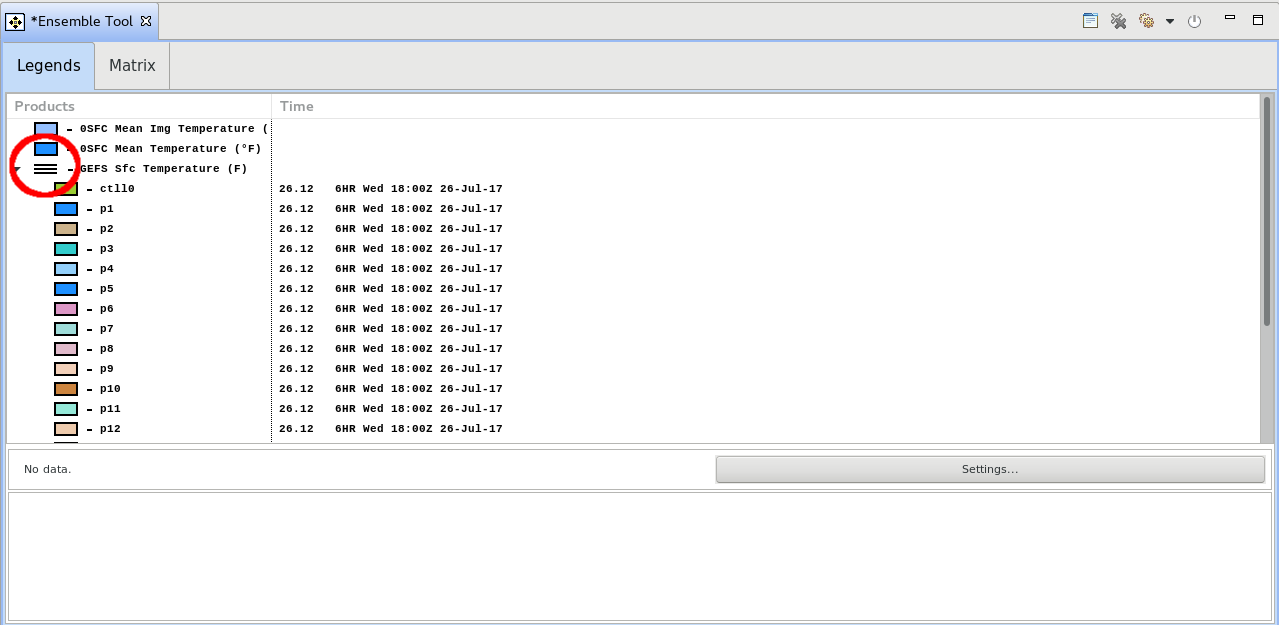
- Left-click on the arrow left of the 3 horizontal bars then Toggle off the contours of the individual members by left clicking on the 3 horizontal bars to the left of the GEFS Sfc Temperature text (Fig. 7, Fig. 8).
- Adjust the line width (make bolder) and line color (make it stand out against the image field) of the Mean Temperature contour by right clicking on 0SFC Mean Temperature text and selecting Change Color and Line Width.
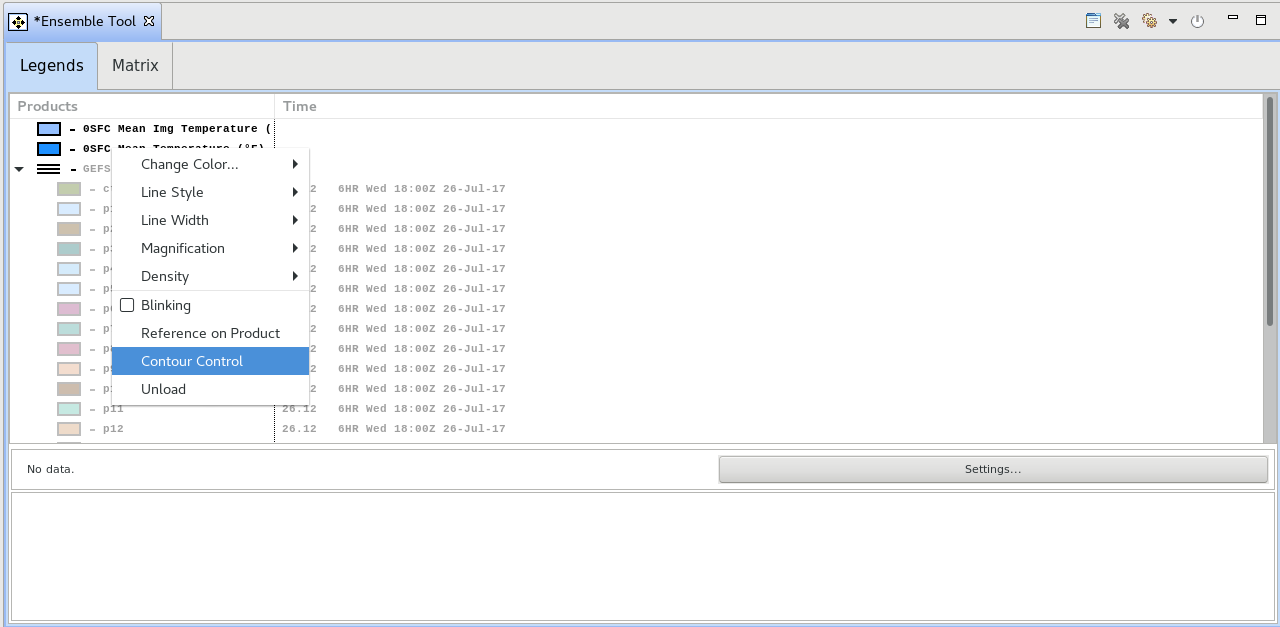
- Right-click on the 0SFC Mean Temperature text and select Contour Control (Fig. 9).
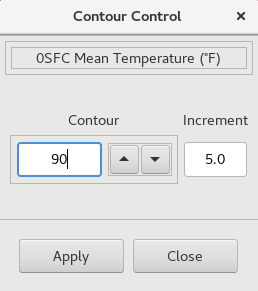
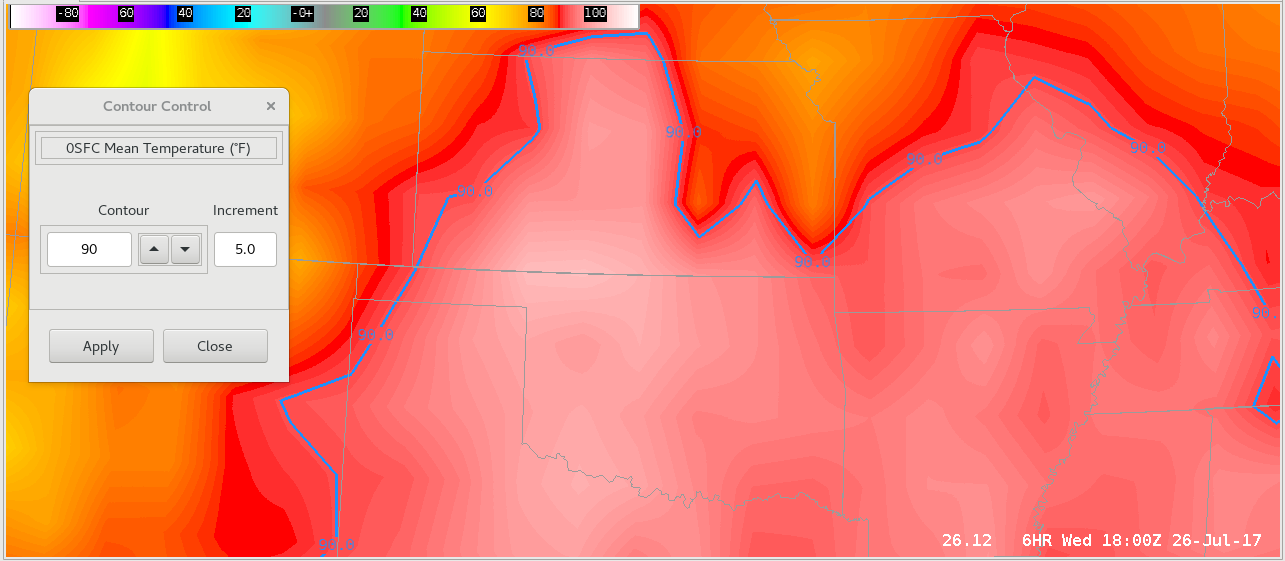
- Under Contour, type a desired temperature contour you would like to highlight (e.g. 32, 90, etc.) and under Increment, type 5. Click Apply (Fig. 10).
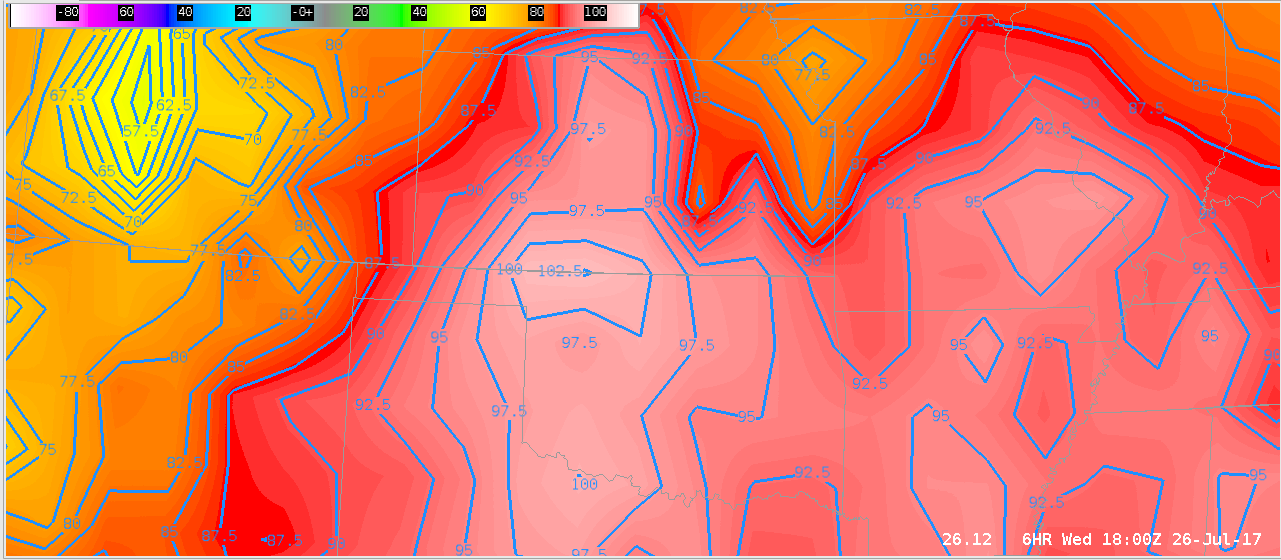
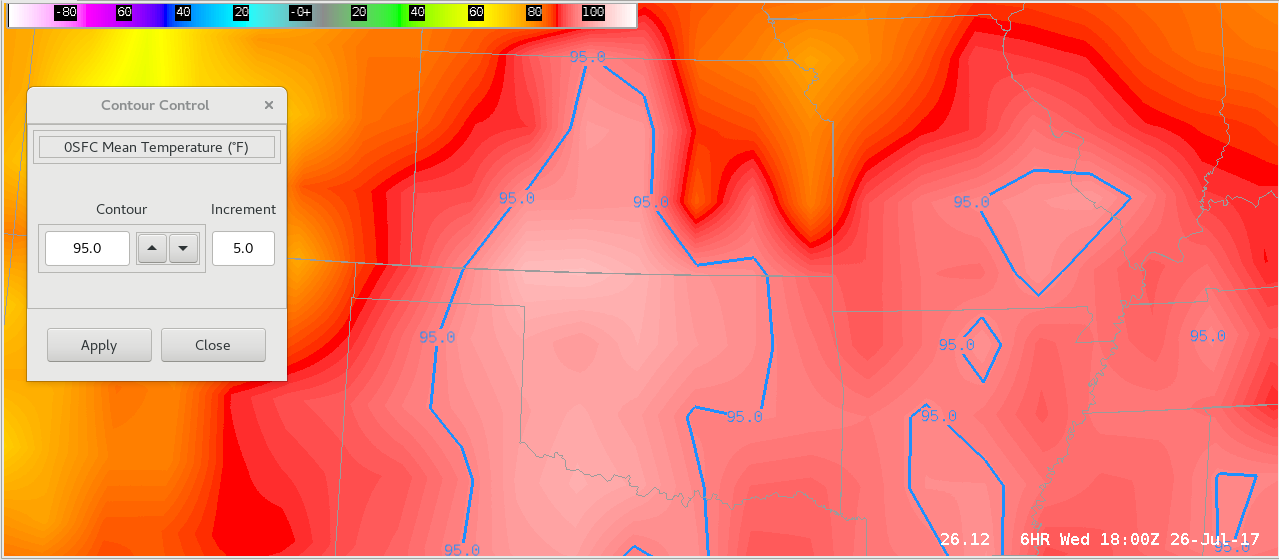
- Using the up/down arrows under Contour, change the contour (notice that the contoured temperature changes according to the increment of 5 you have set) (Fig. 11, Fig. 12).


