


ARIs FAQs - OCLO
ARI Supplemental Information
FAQs for ARIs:
- What is the best way to use ARI information in warning decision making?
- When you have extreme rainfall, use the ARIs to assess how the extremes relate to the climatological ARIs. Always heavily scrutinize your rainfall estimates (compare radar and ground estimates) because small variations in rainfall estimates can have large impacts on ARIs and, in turn, the apparent historical significance. You will have some consistent quantitative language in ARIs to characterize the rarity of the event. For extreme events (ARIs > 100 years, or rather, annual exceedance probabilities < 1%) make sure and use the "percentage annual chance" language as opposed to a "1000-year event" language per the directive in ARI Lesson 1. For more routine events, equally scrutinize the QPE estimates (they will significantly impact ARIs) and look at the range of values.
- What are the references for ARIs?
- The NOAA Atlas 14 documentation is located on the Hydrometeorological Design Studies Center website, within the Precipitation Frequency Data Server (PFDS) subpage (Internet). From this page, click on the "PF Documents" link (Internet) on the left-side menu to access documentation for all 50 states, Puerto Rico, the U.S. Virgin Islands, and select Pacific Islands. Note that even for the states which do not have Atlas 14 data, there are still supplemental references available with useful information.
- Additionally, there is documentation about GIS-compatible grids, cartographic maps, temporal distributions, time series, and seasonality analyses. These details can also be accessed from the PFDS page, on the left-side menu, under "PF Data Server".
- How was missing data treated in the NOAA Atlas 14 analysis that provided the ARIs?
- There are several states where NOAA Atlas 14 grids have not yet been created. Because of this, the ARI grids available in AWIPS will have no data in those areas.
- What could be potential reasons for ARIs varying significantly across regional ARI boundaries?
- This is a very difficult question to answer and will require further detailed analysis across multiple regions to narrow down. The ARI grids in AWIPS were derived from stitching together various NOAA Atlas 14 regional analyses. These regions were determined based on climatic similarities, with each region determining intricacies in its calculations. For instance, in regions where snowfall contributes significantly to annual precipitation totals, separate rainfall frequency analyses may be completed to help distinguish precip type. Additionally, the base ARI grid is derived from mean annual max (MAM) calculations done by the PRISM Climate Group at Oregon State University. It is possible that each regional MAM map was calculated differently to account for climatic variations. All of these details are described in-depth in the NOAA Atlas 14 Volume documents, so as ARIs are more fully explored across multiple regions we will update this page as our understanding changes.
- What is the best way to identify ARI uncertainty in your CWA?
- The best way to identify ARI uncertainty is to:
- First become familiar with your 1-yr ARIs by loading up the 24-hr duration. The 1-yr ARIs are resolved the best in the NOAA Atlas 14 analysis, and you should have more confidence in the lower ARI values. Notice how uniform your values are. If you do not have any significant variations across your CWA, then you will be less likely to have significant meaningful varations in ARIs at higher recurrence intervals.
- Step through each ARI from 1 to 1000 and notice where the spatial variability for a given ARI starts to become a significant percentage of the average values, and you potentially could have more uncertainty in using ARIs in decision making. Here is a table from the LOT example that was touched on in the training:
ARI (yrs) 1 2 5 10 25 50 100 200 500 1000 Range(in) 2.3 - 2.5" 2.8 - 3" 3.5 - 3.8" 4.1 - 4.5" 4.8 - 5.7" 5.8 - 6.6" 6.5 - 8" 6 - 10" 7 - 12" 9 - 15" -
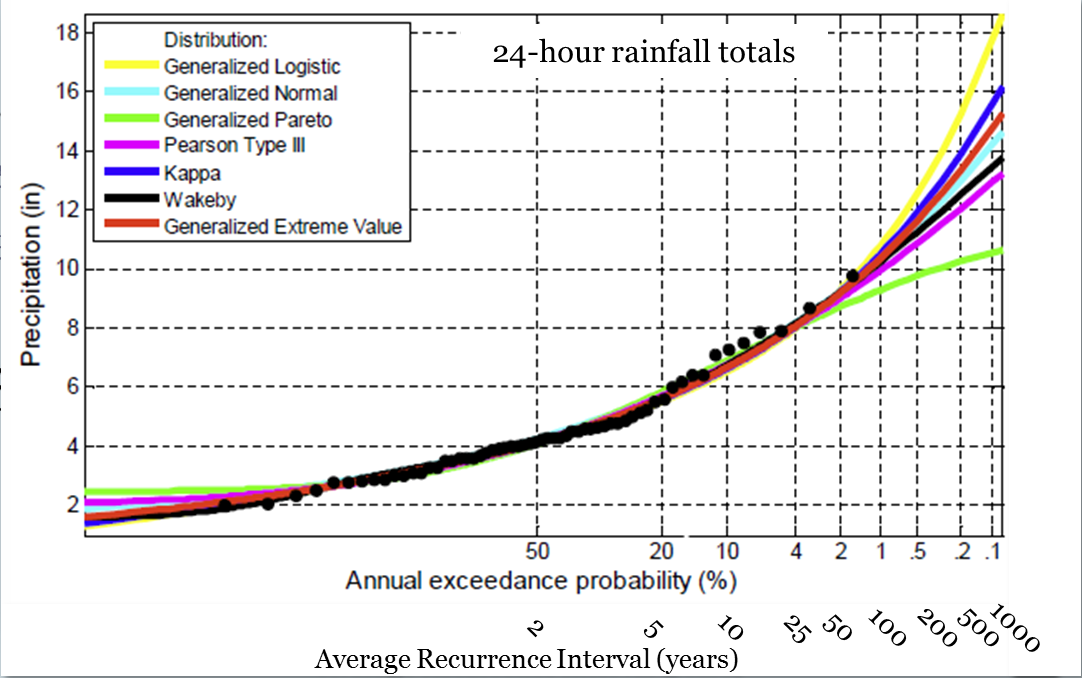
Notice in the previous table that there is very little spatial variability for lower ARIs across the LOT CWA (~10% of the average values). Once you get to 25-year ARIs (+5" 24-hr rainfall), the variability in QPE increases to ~ 20% of the average values, and greater than 50% of the average values for 200-year ARIs and higher. Notice this variability is starting to coincide with the limited period of record for many of the gauges (many start at 30 years of record), and thus, the ARIs are more heavily influenced by the extrapolation schemes used (see this ARI extrapolation example from the ARI Lesson 1). For LOT, the variability in rainfall values suggests a general confidence in estimates up to 25-year ARIs, and potentially more uncertainty in ARIs with 100-200+ year ARIs. To develop much more confidence you need to start looking at some of your local climatology.
-
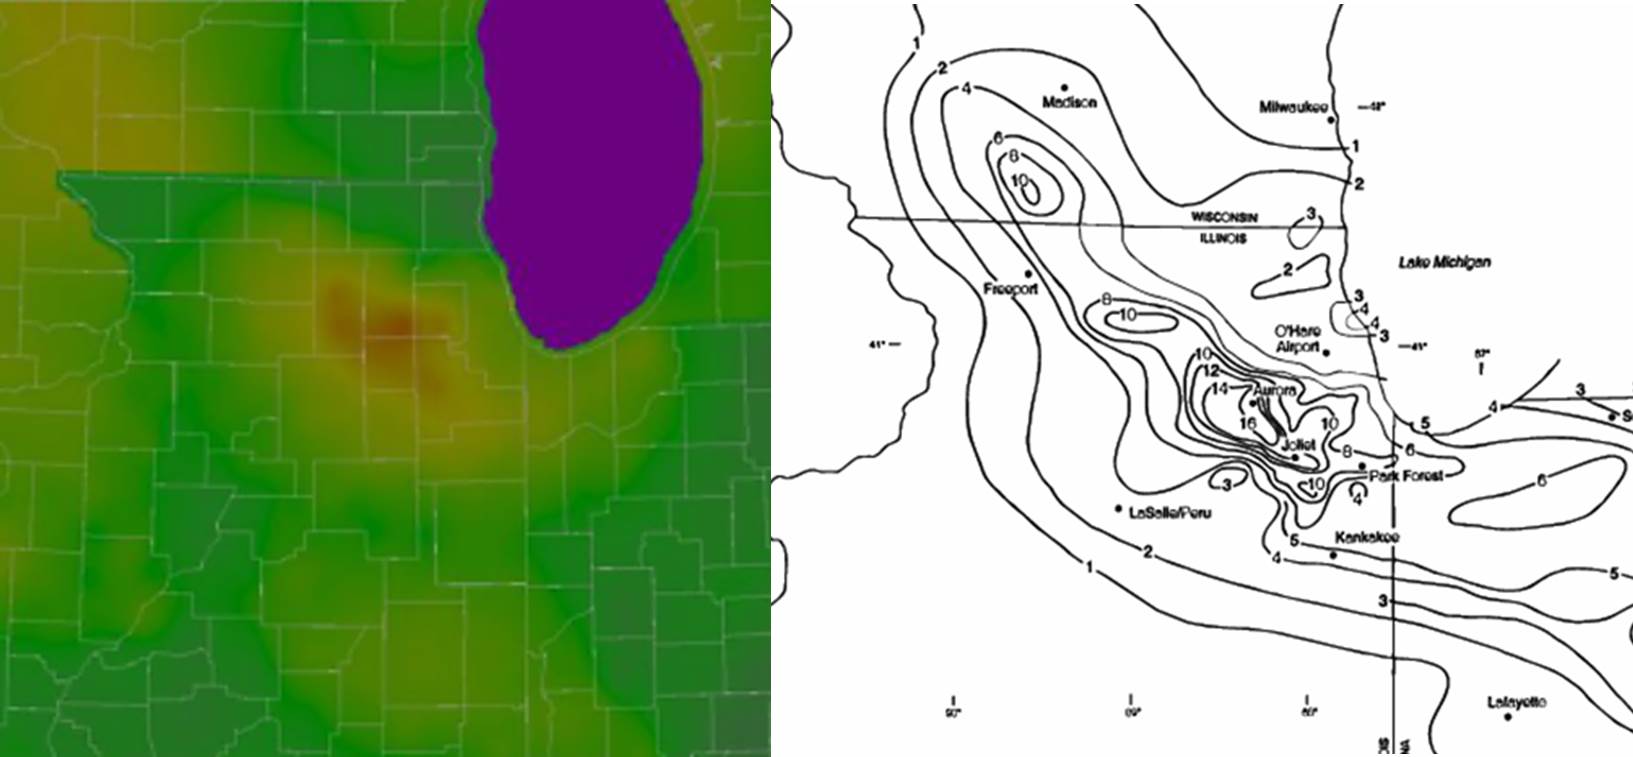
Identify any high-end rainfall events in your CWA that may be overly influencing your climatology. Check out this example of one of the high-end rain events from LOT from 17-18 Jul 1996 where 16.94" of rain fell at a long-term COOP site in Aurora, IL (500-year 24-hour duration ARI on left and rainfall in inches on the right). Notice how the max and min correlate with the structure in the higher ARIs. Correlation doesn't necessarily mean causation, but it is likely that extreme events are going to be sampled infrequently in the gauge climatology, and the extrapolation schemes used to blend this data are likely to spread these event characteristics throughout the higher ARIs with too much weight.
-
Identify localized "hot spots" in your high ARIs. If no similar structures exist in the lower ARIs (that are well-resolved), then you have strong reason to challenge that the structures in the higher ARIs are not reasonable, particularly if the structures in the higher ARIs correlate well with a singular event or very small sample of events. If there is some sound meteorological reasoning why significant events favor some areas more than others preferentially for extreme events (not as likely), then defer to your reasoning. There are two ways to interpret these hot spots that could be equally justifiable: 1) the hot spot is setting the bar too high by requiring higher QPEs in order to be considered historic, and you should consider bringing those values down; or 2) the neighboring values outside the hot spot are too low, and thus, will cause QPEs of similar magnitudes to appear more historic than the hot spots simply because these areas haven't been adequately sampled on that time scale. Regardless, these areas require more comparison with other events, local forecasters, and climatologists. In the previous example, there were 10" observations dotted throughout a large area of IL and WI in an extreme event, producing hot spots at higher recurrence intervals. Additionally, there was a relatively uniform variability in QPE for well-resolved lower ARIs throughout the CWA, meaning those hot spots are indicative of well-sampled extreme events. Therefore, it is more likely that the higher values are relevant over a larger area, and there is some reason to believe that minima QPE outside the hotspot are too low. But again, you need to assess where you have significant variability in ARIs and how those QPEs compare to your local events and forecaster perceptions.
-
As you become more familiar with the ARIs in your area, use the HDSC online ARI website (Internet) to identify the wide ranges of 90% confidence intervals associated with the overlap in high ARIs. When one QPF resides within multiple confidence intervals, recognize that there is a wide range of possible ARIs and you should speak in terms of a range of possible ARIs (e.g. 100-500 yr rainfall or a 0.2-1% yearly chance of occurence).
- The best way to identify ARI uncertainty is to:
- Why are the units multiplied by 1000 and labeled with m*127/5 in the Product Browser display?
- The Product Browser display of the ARI grids is a convenient by-product of ARI processing where the CONUS ARI data is clipped to a regional scale before it is made available to FFMP for initial ingest. This regional-scale display covers a larger domain than FFMP, and the color table more effectively shows important variations in ARIs in and around your CWA. FFMP was intended to be the primary display for ARI data, so the default display sampling is likely a byproduct of the way the ARI grid information is defined. Since 127/5 is 25.4 and 25.4mm is 1", the m*127/5 is likely an under-the-hood conversion factor from mm to inches. The bottom line is to just divide the Product Browser ARI display by 1000 to get the ARI threshold in inches.