


ARIjs3 - OCLO
ARIs Job Sheet 3
Jobsheet #3: Loading ARI data from the FFMP Basin Trend Graph
Loading ARI data in the FFMP Basin Trend Graph
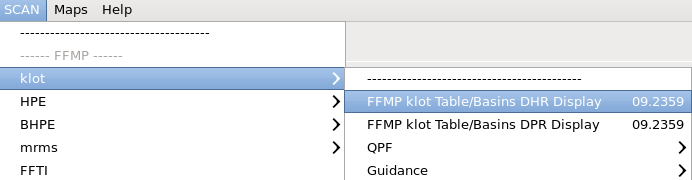
- Load FFMP for any precip source (e.g. SCAN-> FFMP $radar Table/Basins DHR Display; Fig. 1)
- e.g. SCAN-> FFMP klot Table/Basins DHR Display for the klot Legacy DHR precip source
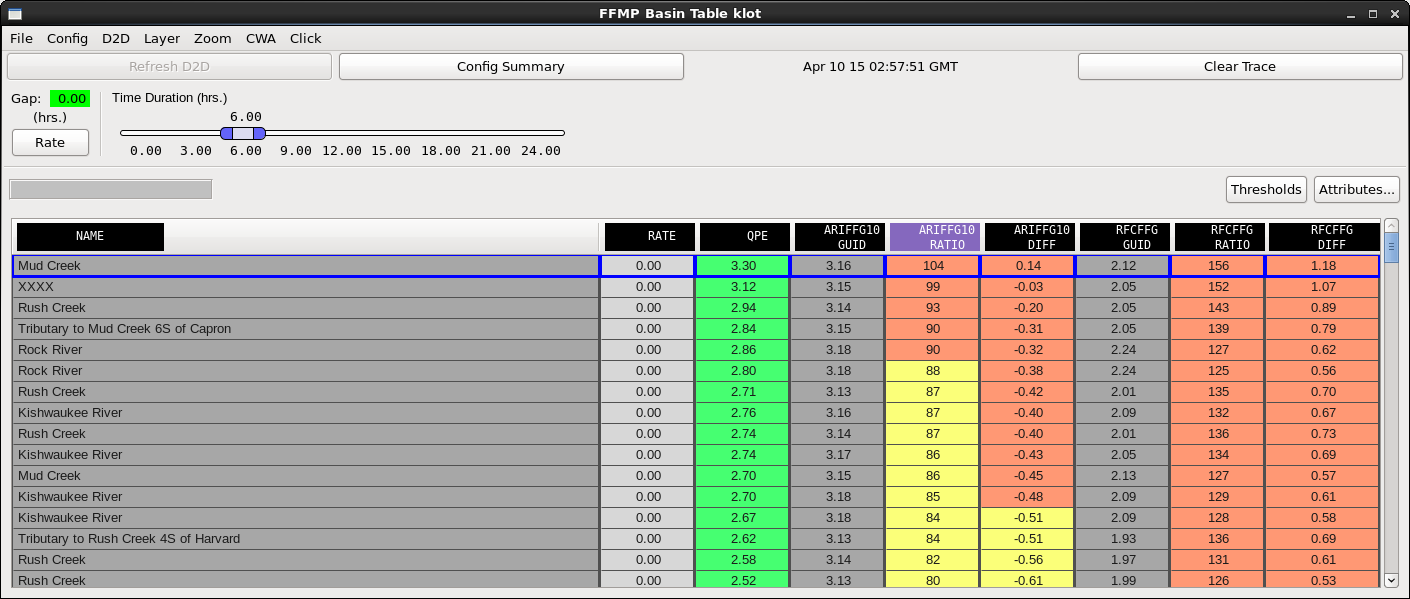
- Load a basin trend by:
- Right clicking on a basin name in the FFMP table (Fig 2), or
- Configuring the Click menu in the FFMP table to be "Basin Trend", making FFMP legend text editable, and then right clicking on a basin.
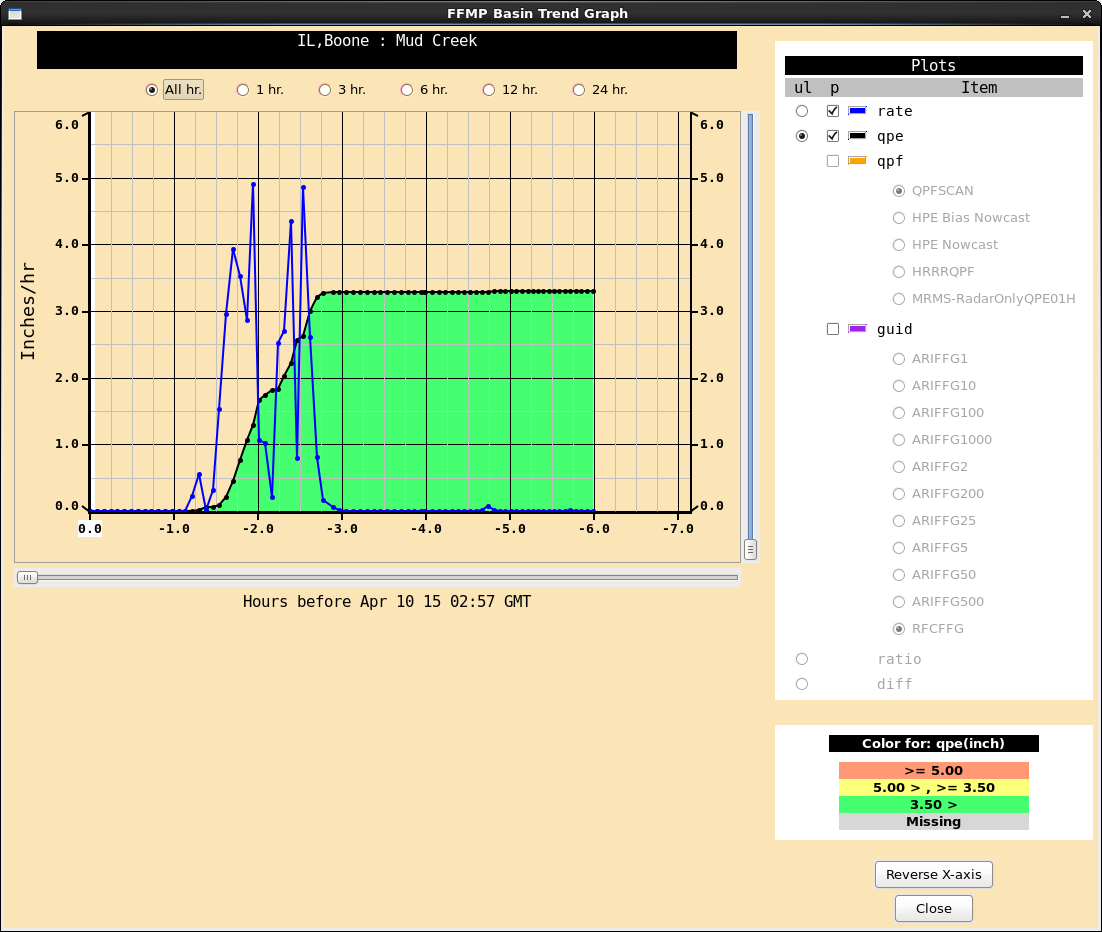
- In the basin trend (Fig 3) click on the guid button
- Note: FFG is typically the default guidance overlay, with magenta dots at 1-hr, 3-hr, and 6-hr representing the basin-averaged flash flood guidance for these durations from the RFCs (1-hr FFG ~ 1.25", 3-hr FFG ~ 1.5", and 6-hr FFG ~1.9" in Fig 4). Also note the black line represents the precip accumulation over that duration (e.g. 3.3" at -3.0 is a 3-hr precip accumulation of 3.3").
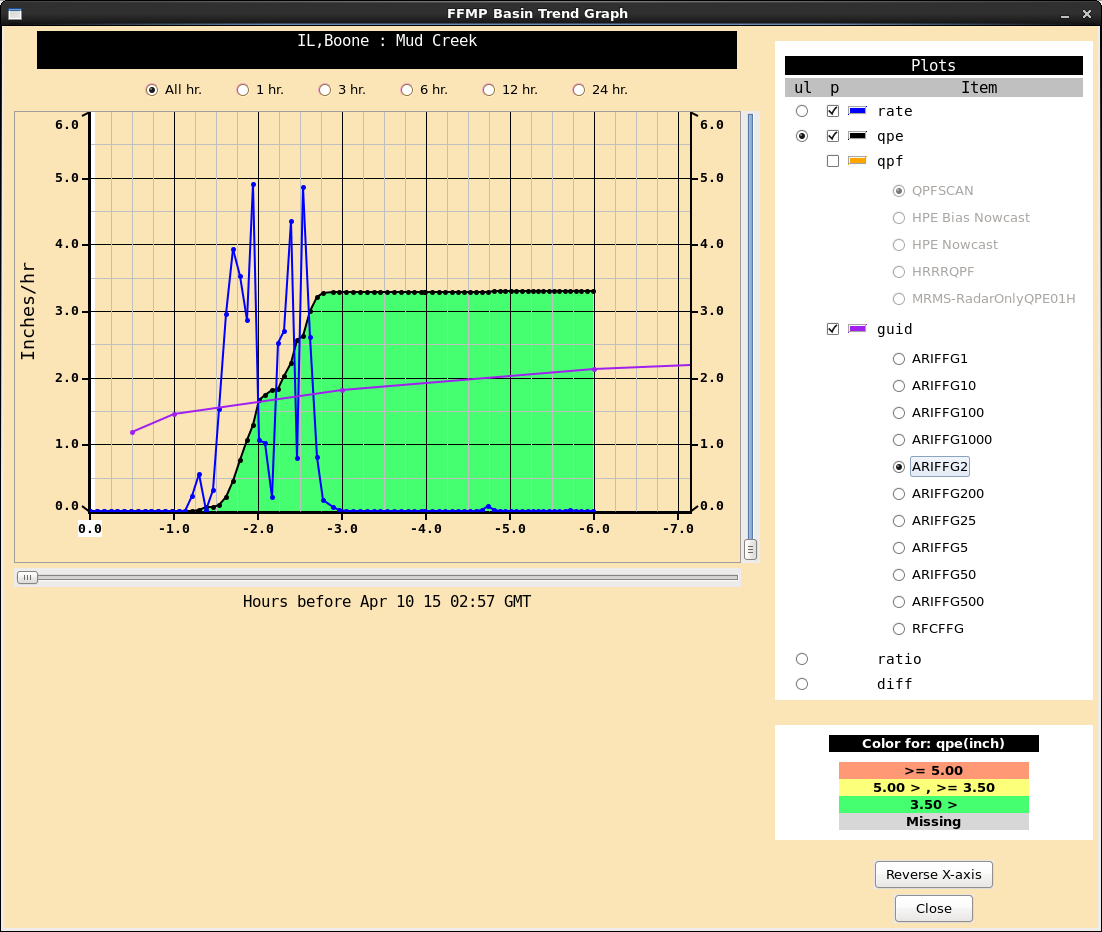
- Select ARIFFG1 to view the guidance line for the 1-year ARI.
- The magenta dots are now the basin-averaged 1-year ARIs for 30-min, 1-hr, 3-hr, 6-hr etc. durations (Fig 5). When the black line (precipitation accumulation) is higher than the value of the ARI for that duration (indicated by the magenta line), you have exceeded the precip associated with that ARI.
- In the Fig 5 plot, the 1-year 3-hr ARI is ~ 1.5", while the 3-hr accumulation is ~3.3". So we have exceeded the 1-year ARI for this duration.
Cycle Through All ARI Values Quickly in Basin Trend
- Select ARIFFG2 to view the 2-year ARIs for all durations (Fig 6).
- Repeat the process for higher values ARIFFG5 (Fig 7), ARIFFG10 (Fig 8), ARIFFG25 (Fig 9), etc. and note how the ARI thresholds increase (i.e. more rainfall is needed to exceed rarer ARIs). The maximum ARI for this basin is a 25-year ARI for a 3-hr duration (Fig. 9).
- This is a particularly efficient way to cycle through multiple ARIs and durations for a particular basin. You can also view ARI data for individual time plots using the buttons on the top of the basin trend graph (e.g. 1hr, 3hr, 6hr, etc.).