


ARI Images - OCLO
ARI CONUS Images
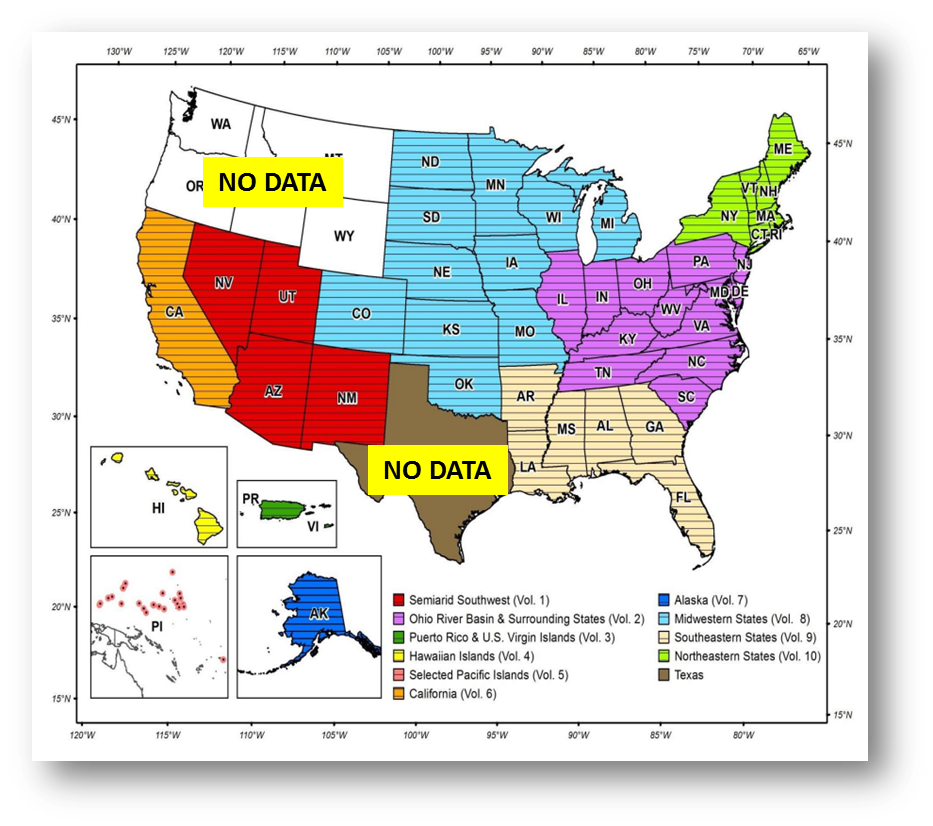

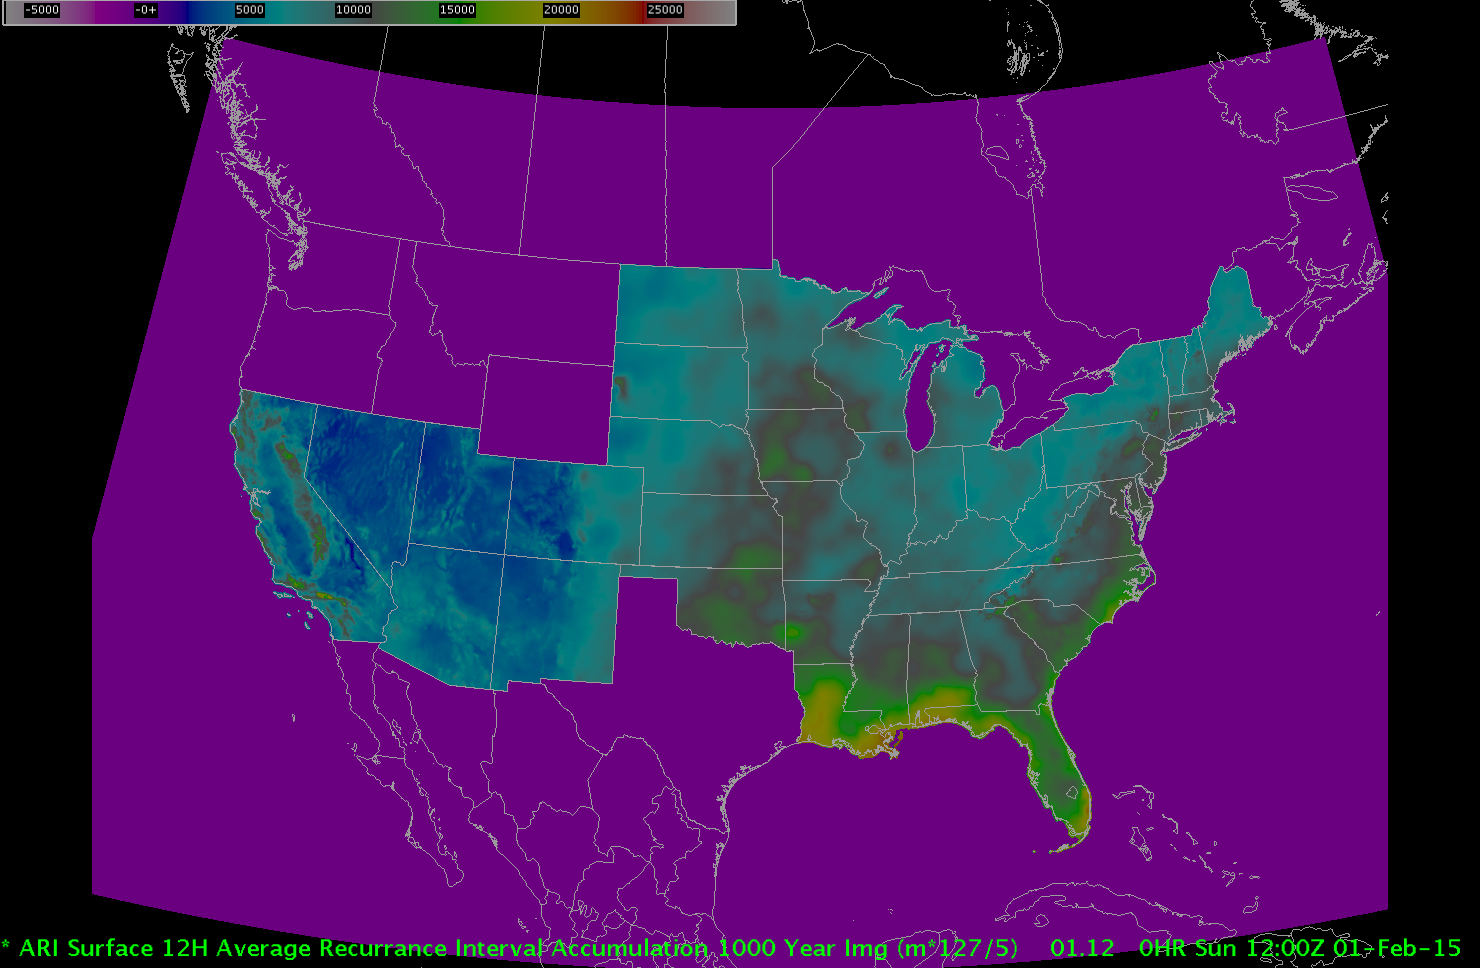
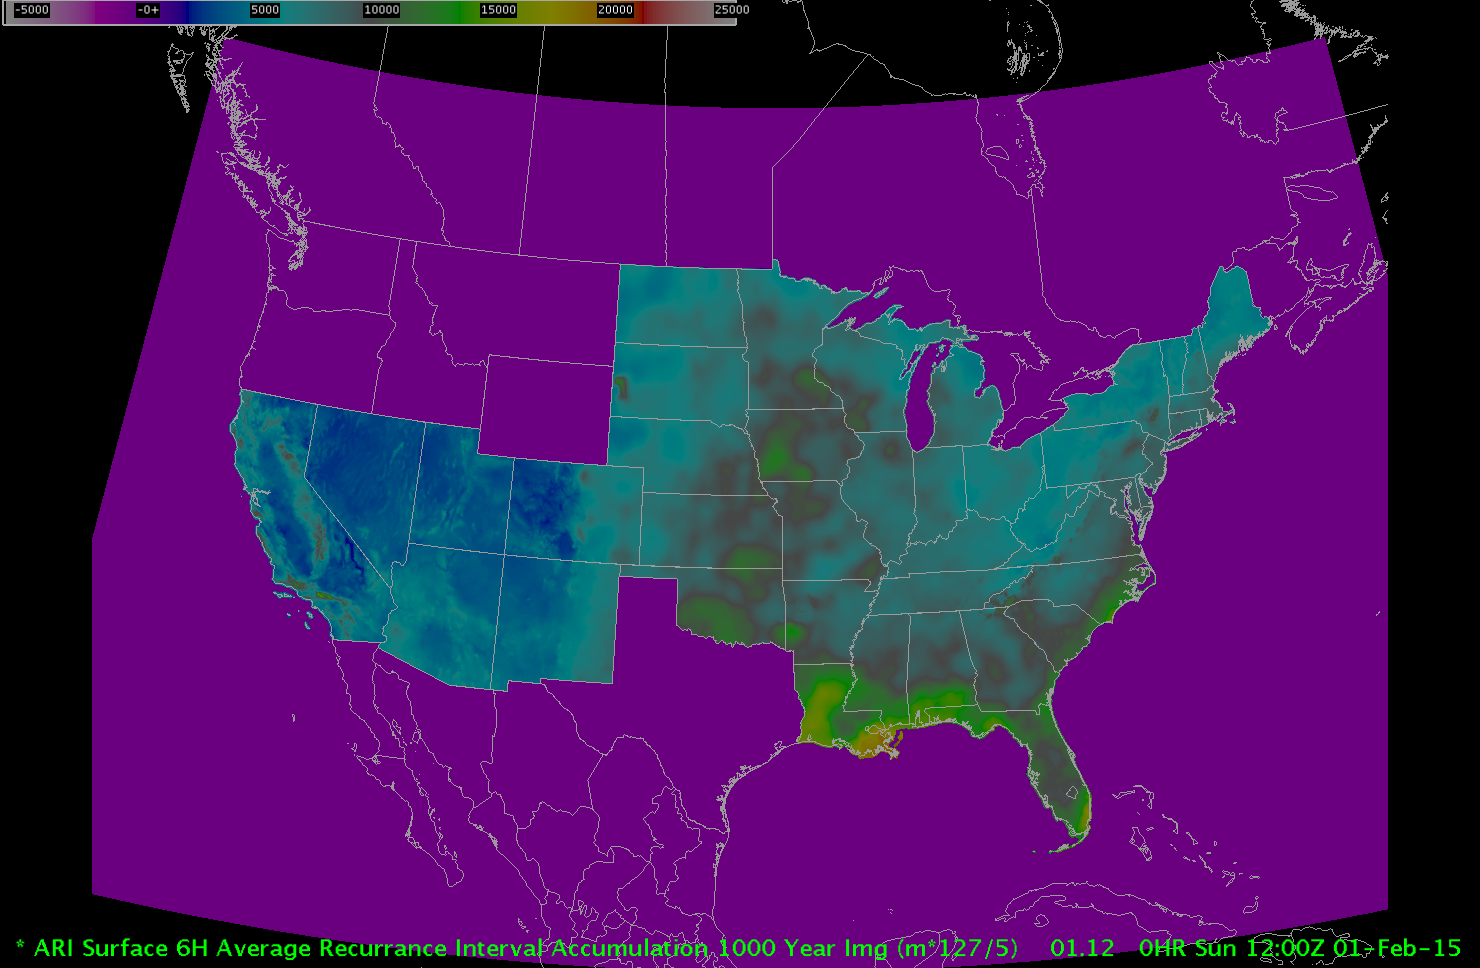
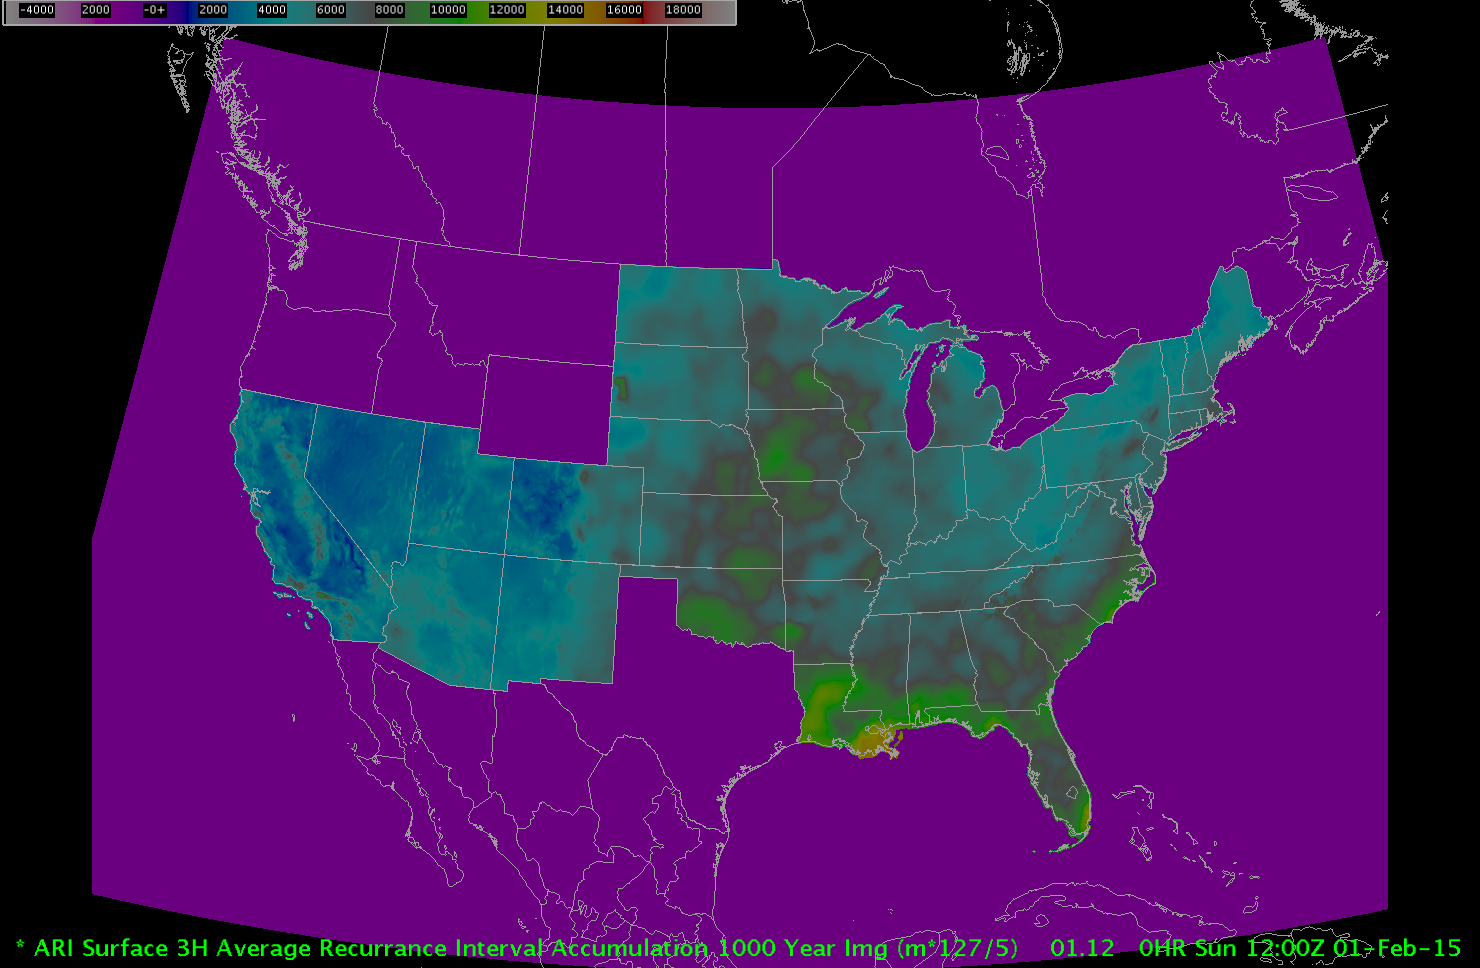
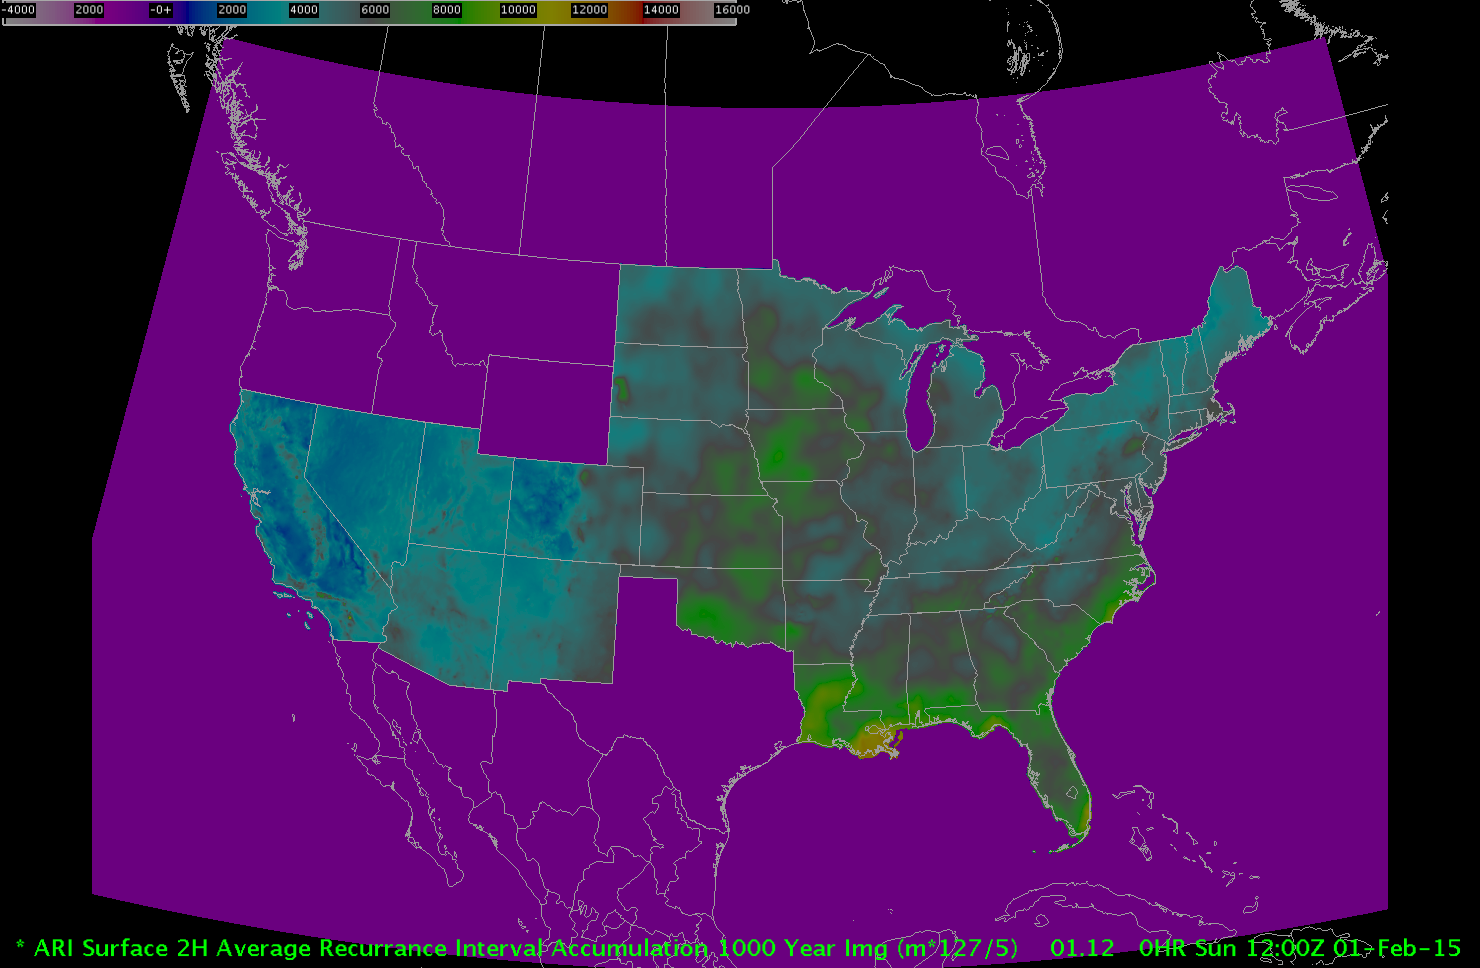
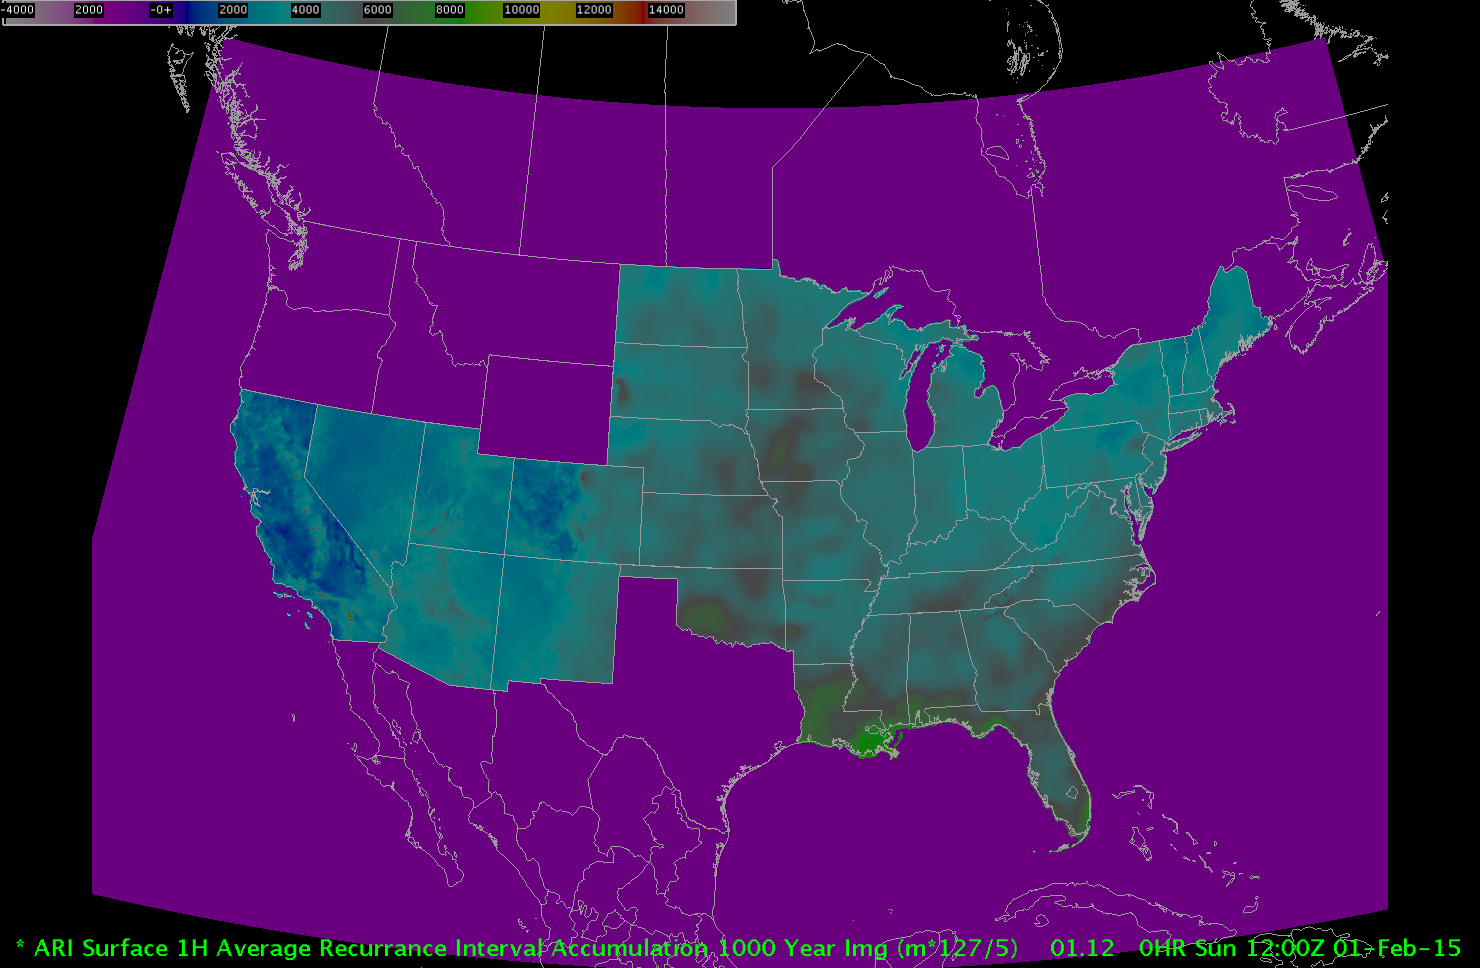
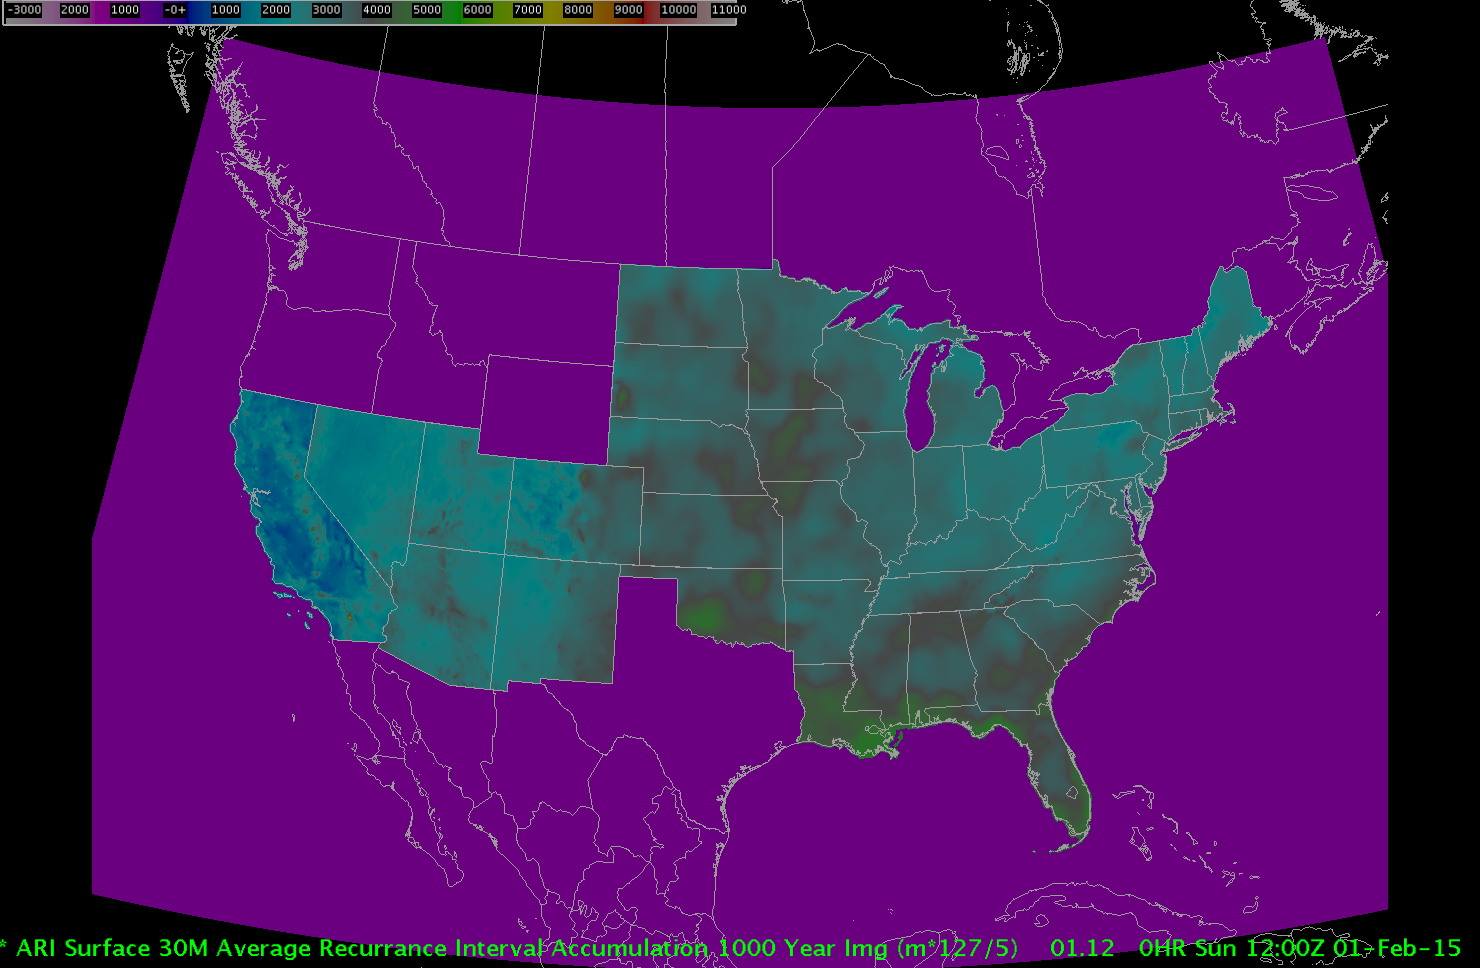
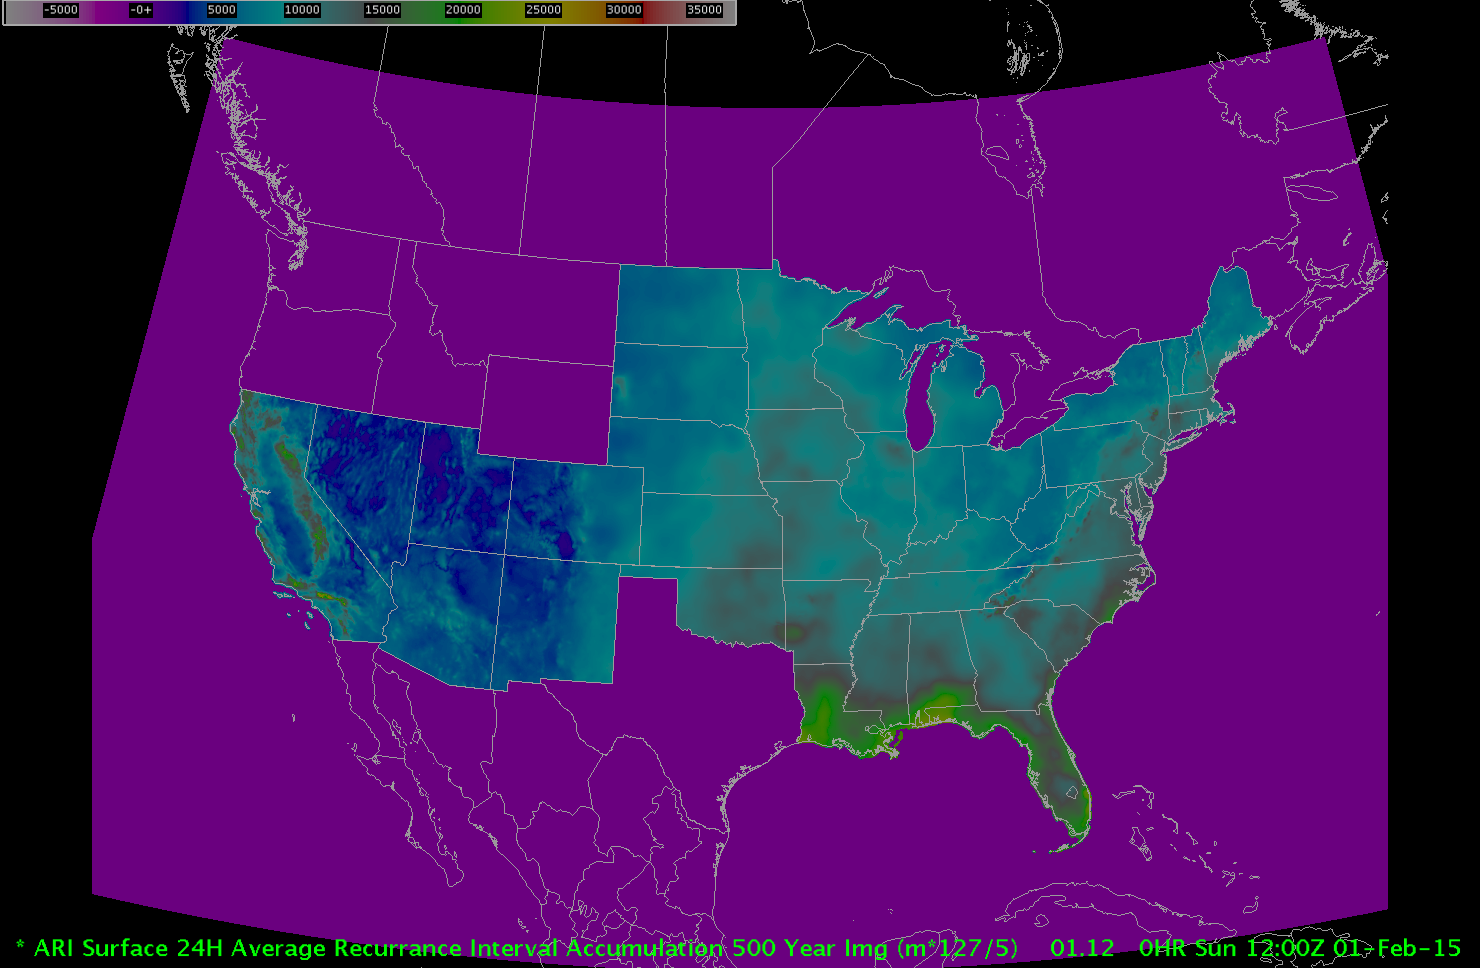
Figure 1. NOAA Atlas14 regions where data was used for ARI and example of 1000 year ARI for 24 hour rainfall duration (note: AWIPS Product Browser ARI plots in thousands of an inch, so divide by 1000 for rainfall in inches).
Instructions
- Step through images to identify artifacts along Atlas 14 regional boundaries (see Figure 1) and "hot spots" of accumulations in your CWA.
- Start with 1000yr ARI and work down from 24hr to 1hr images.
- Proceed through lesser ARIs until artifacts and hot spots disappear.
- Work with your local hydro focal point to evaluate quality of ARI data in your CWA and compare to known local flooding events to identify relationship of precipitation accumulations to flooding.
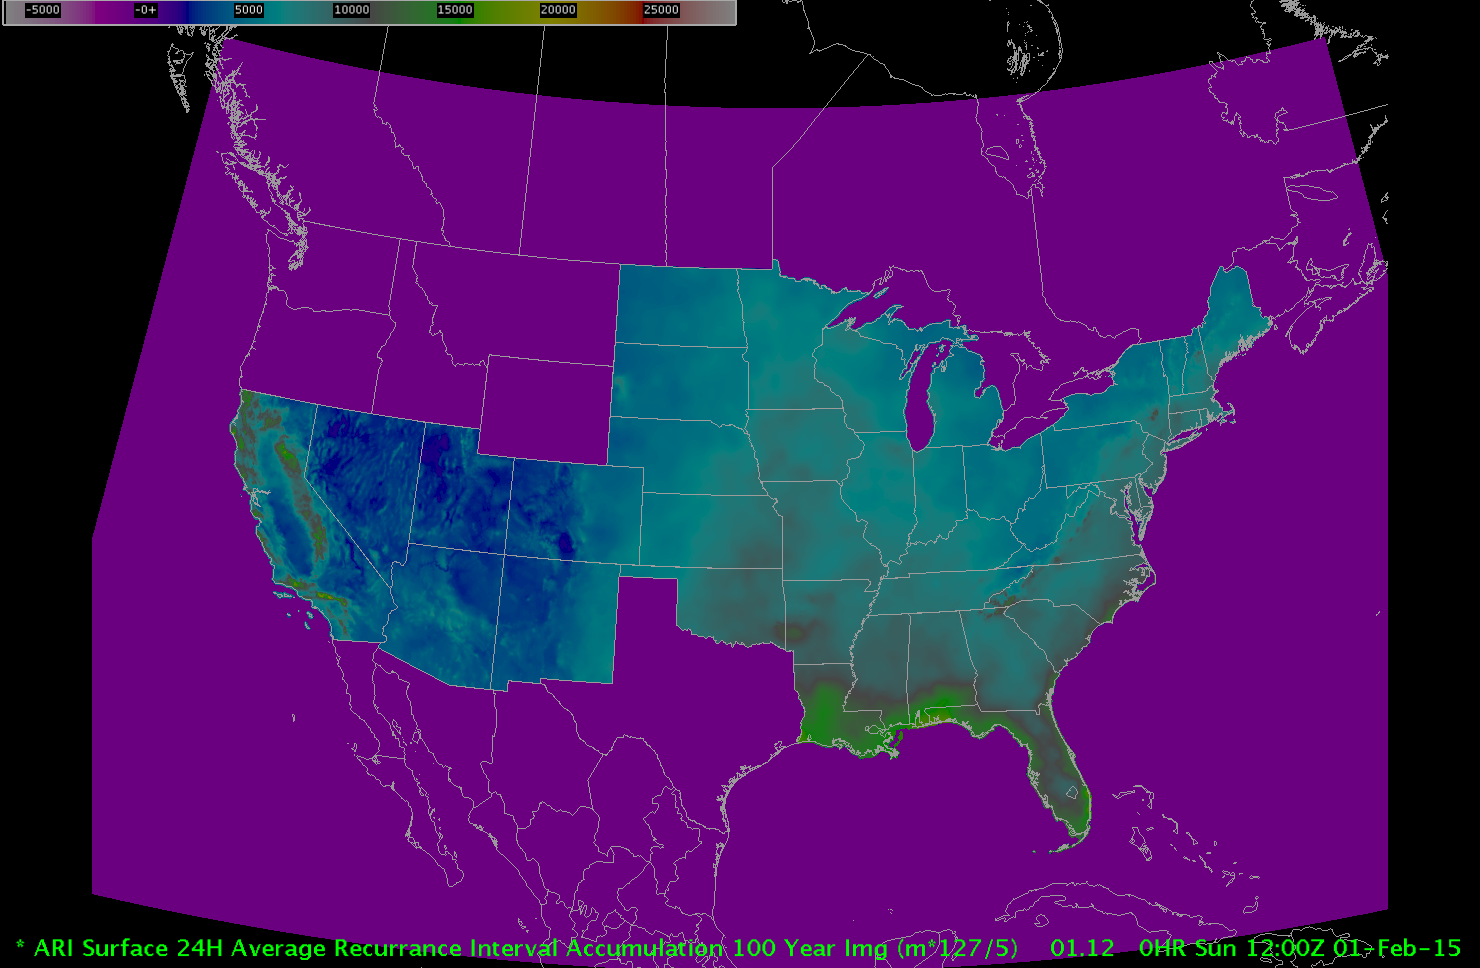
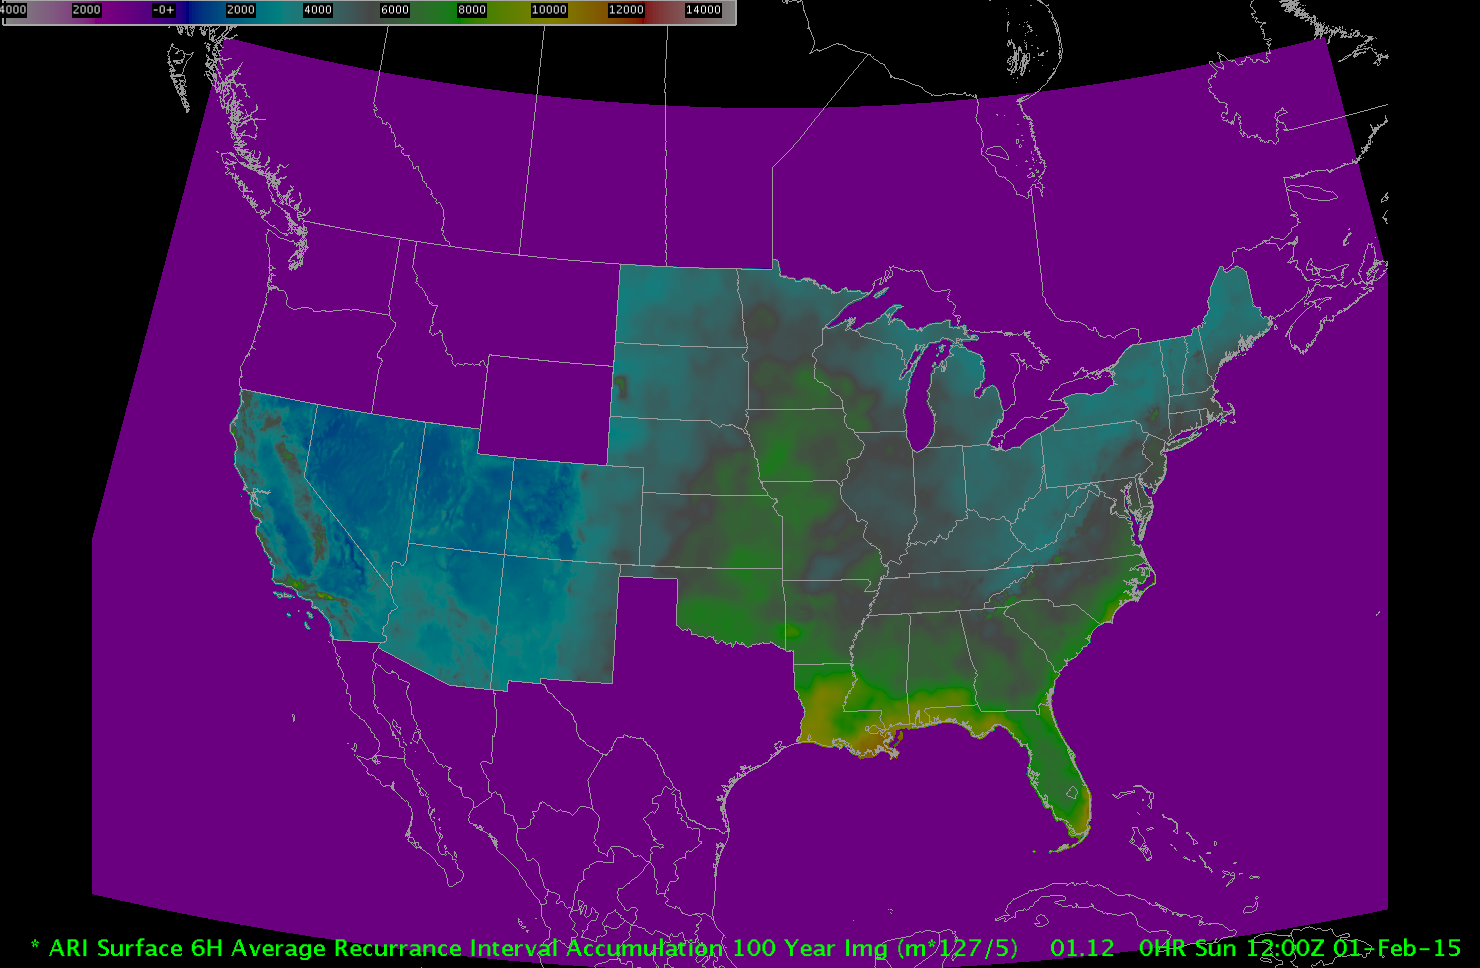
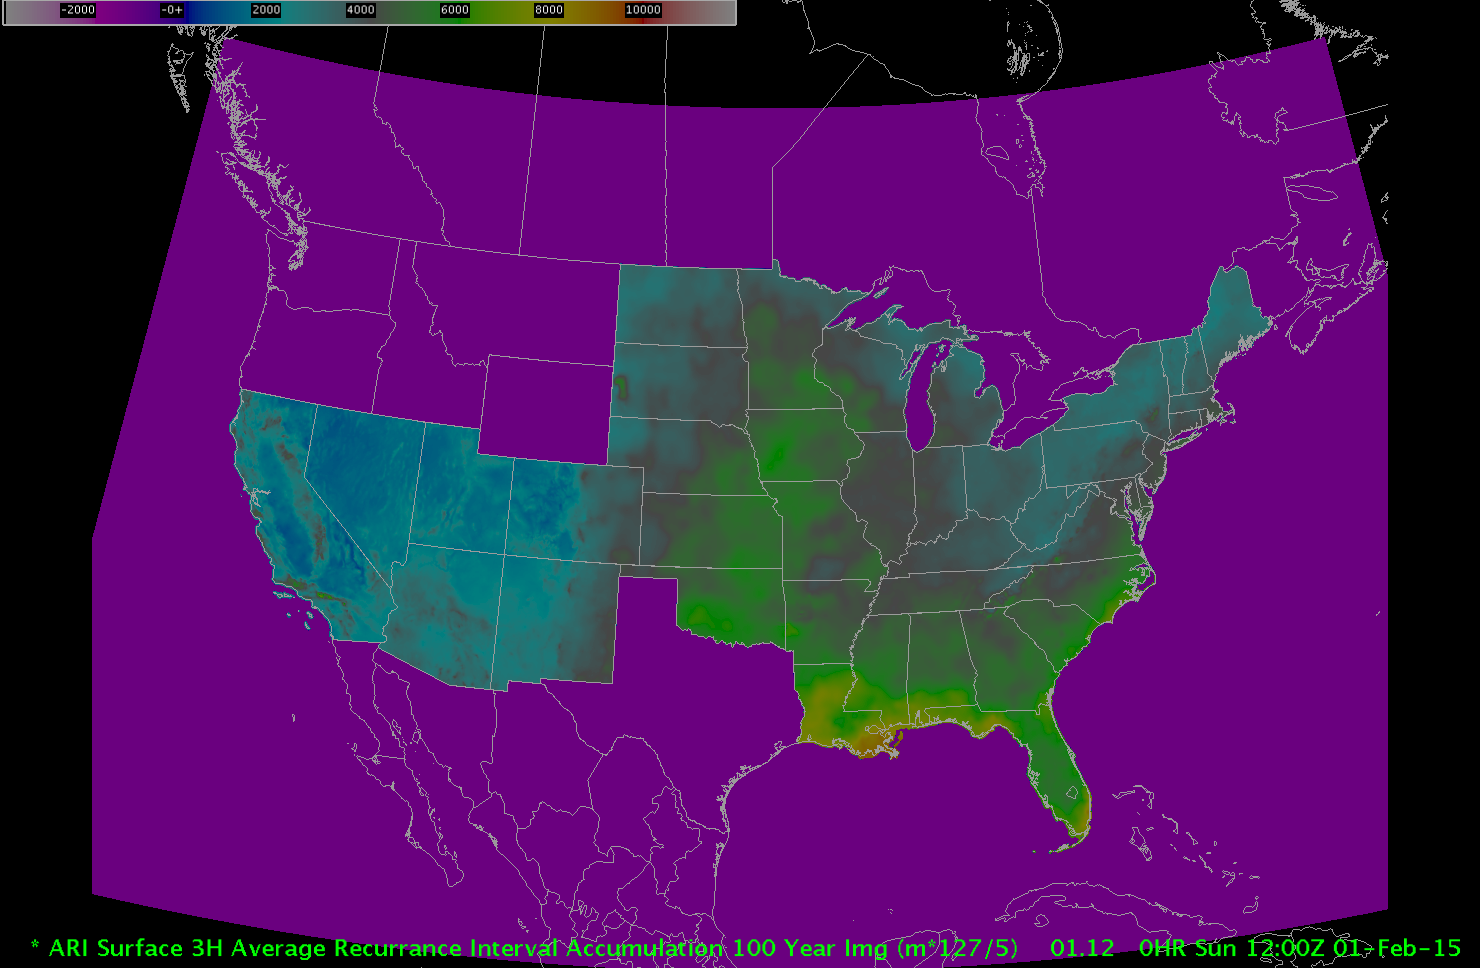
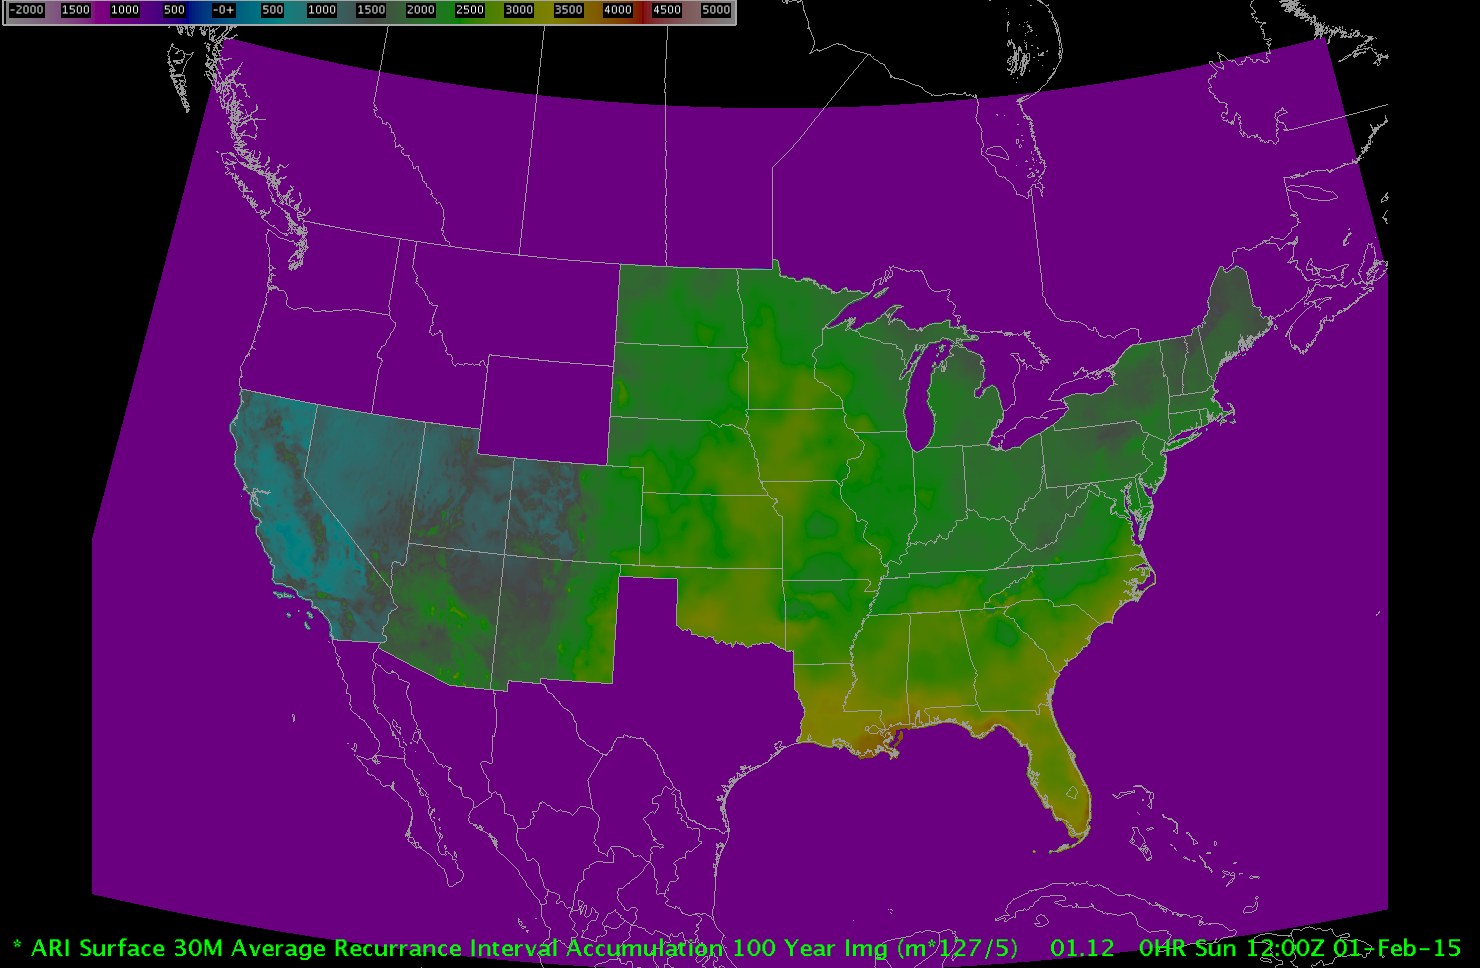
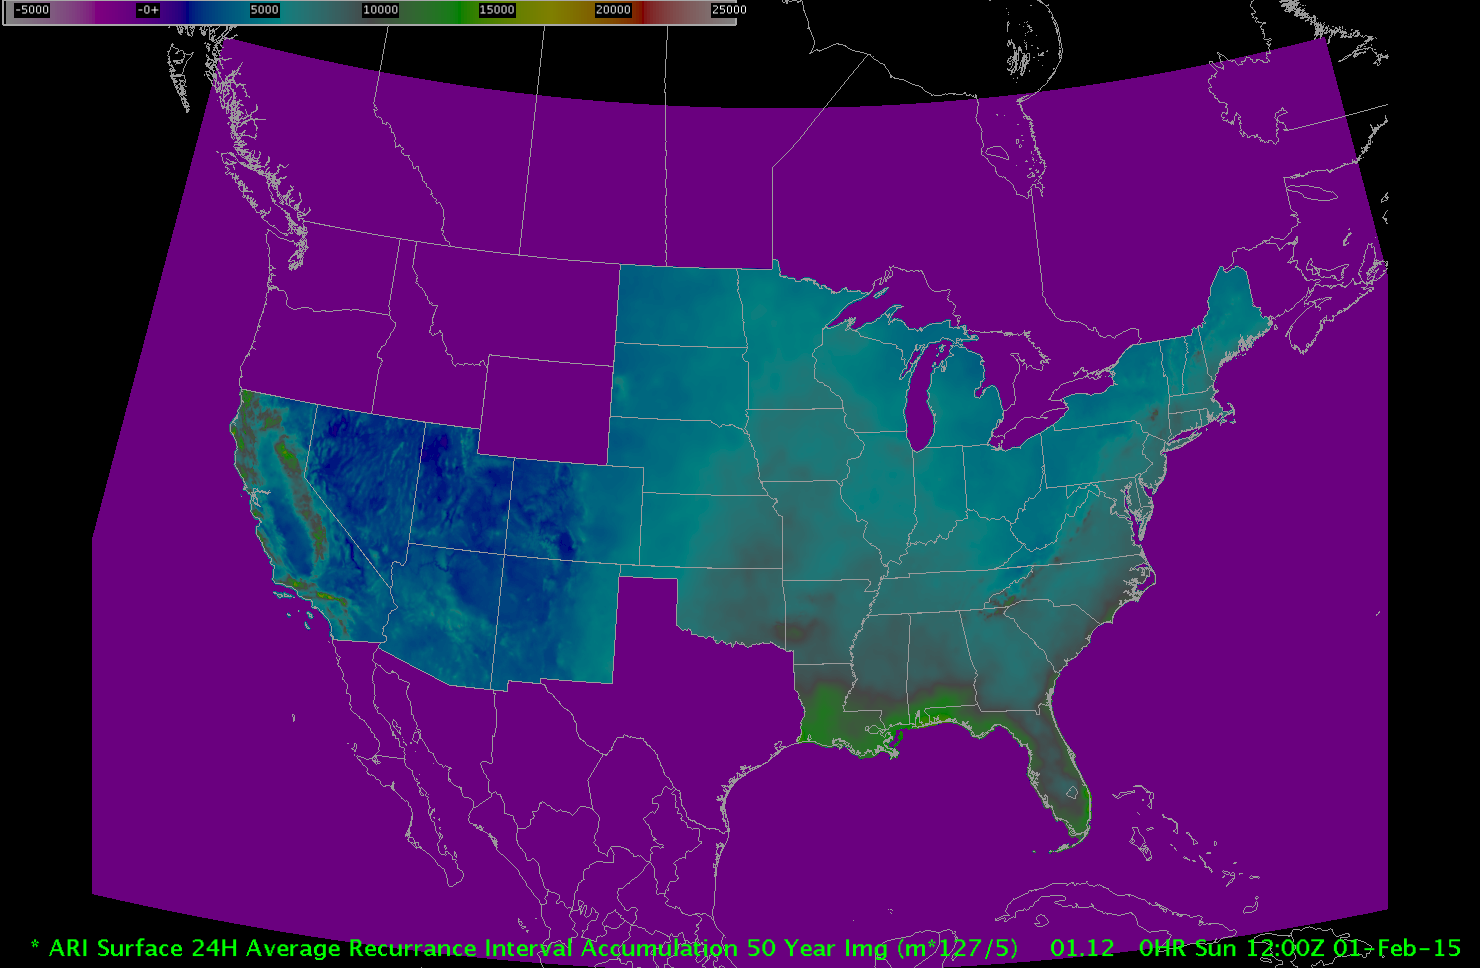
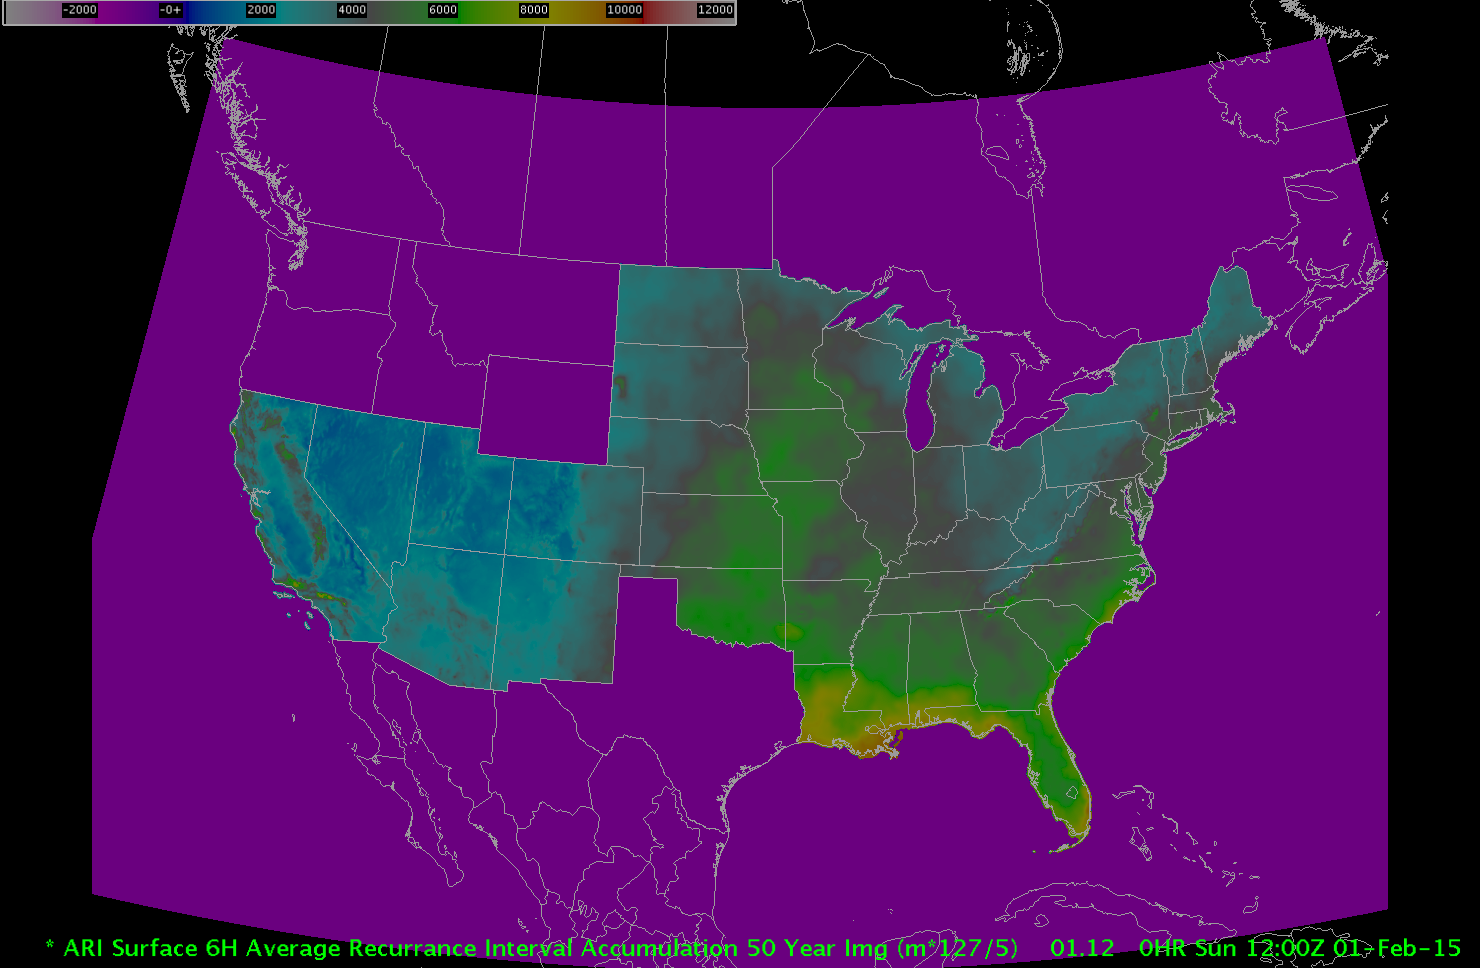
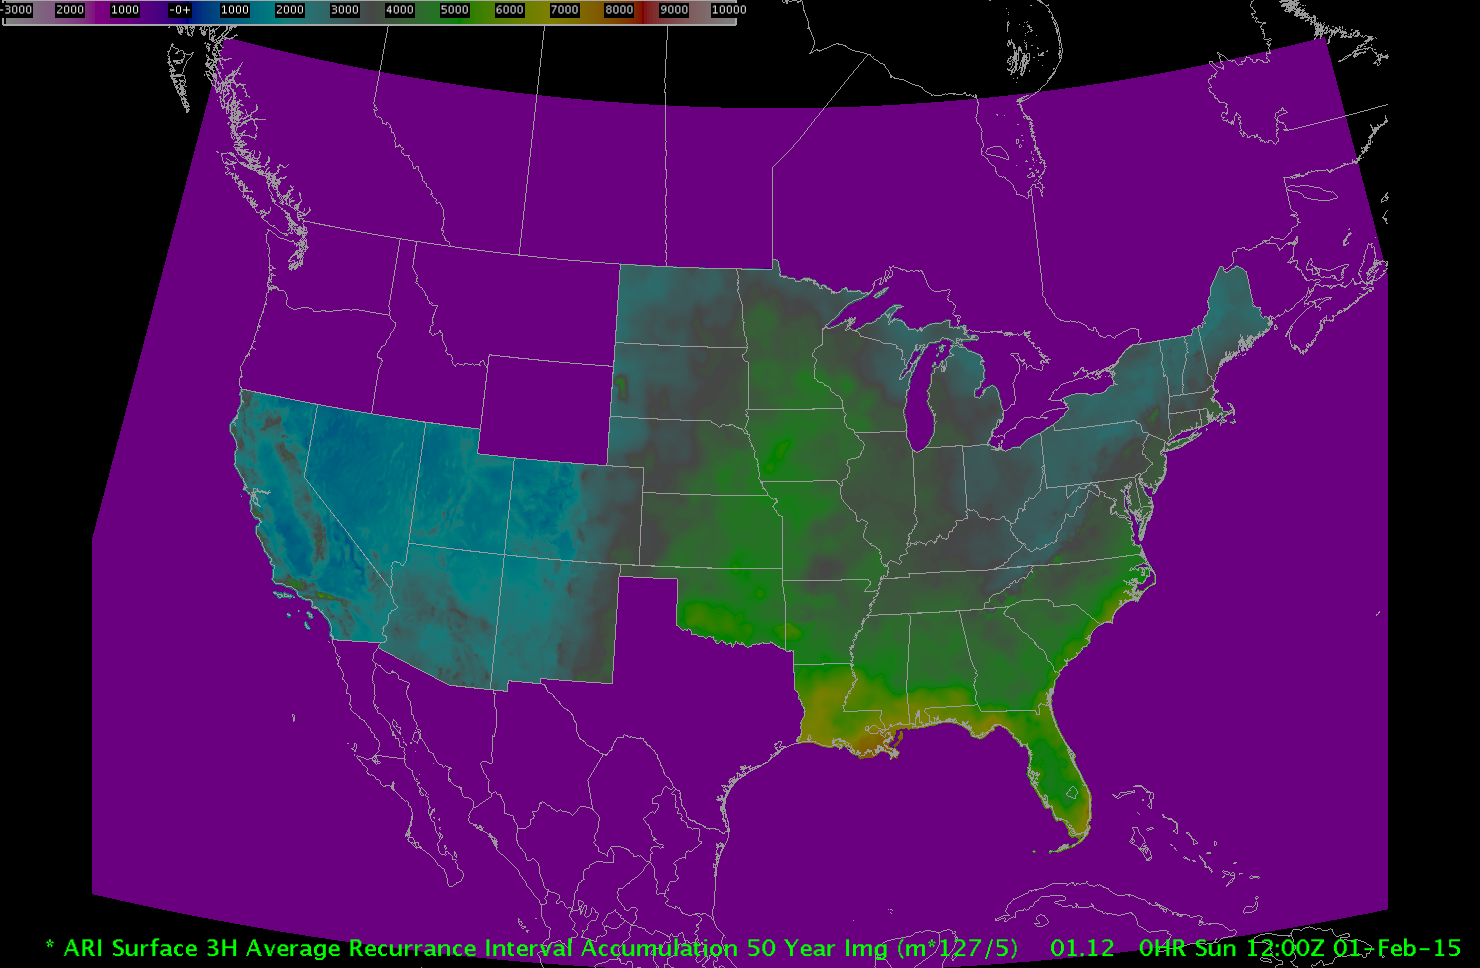
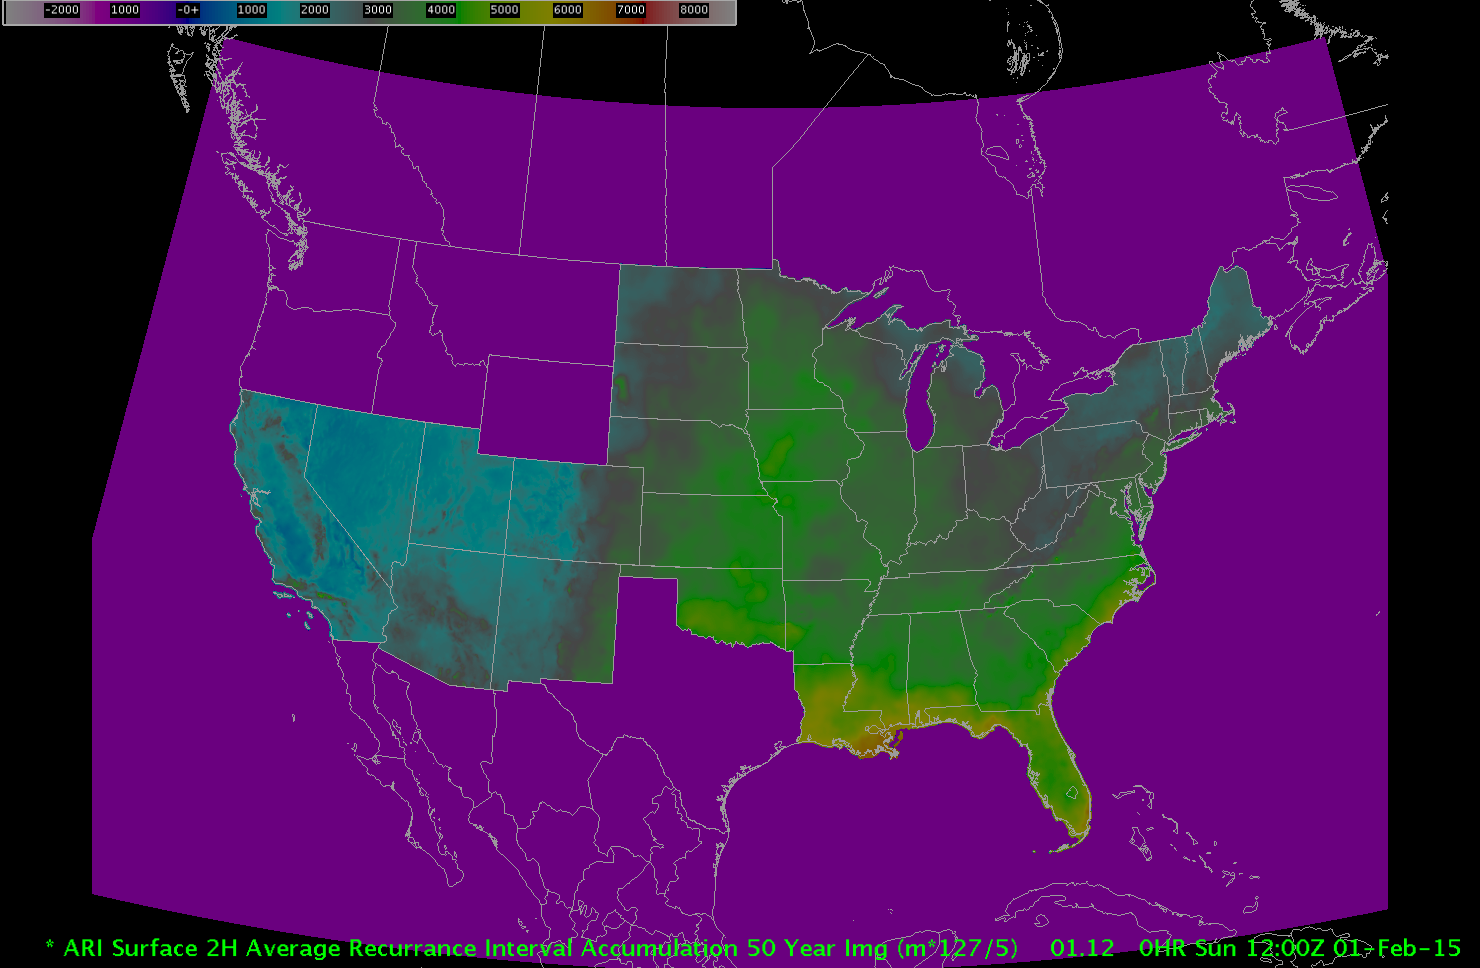
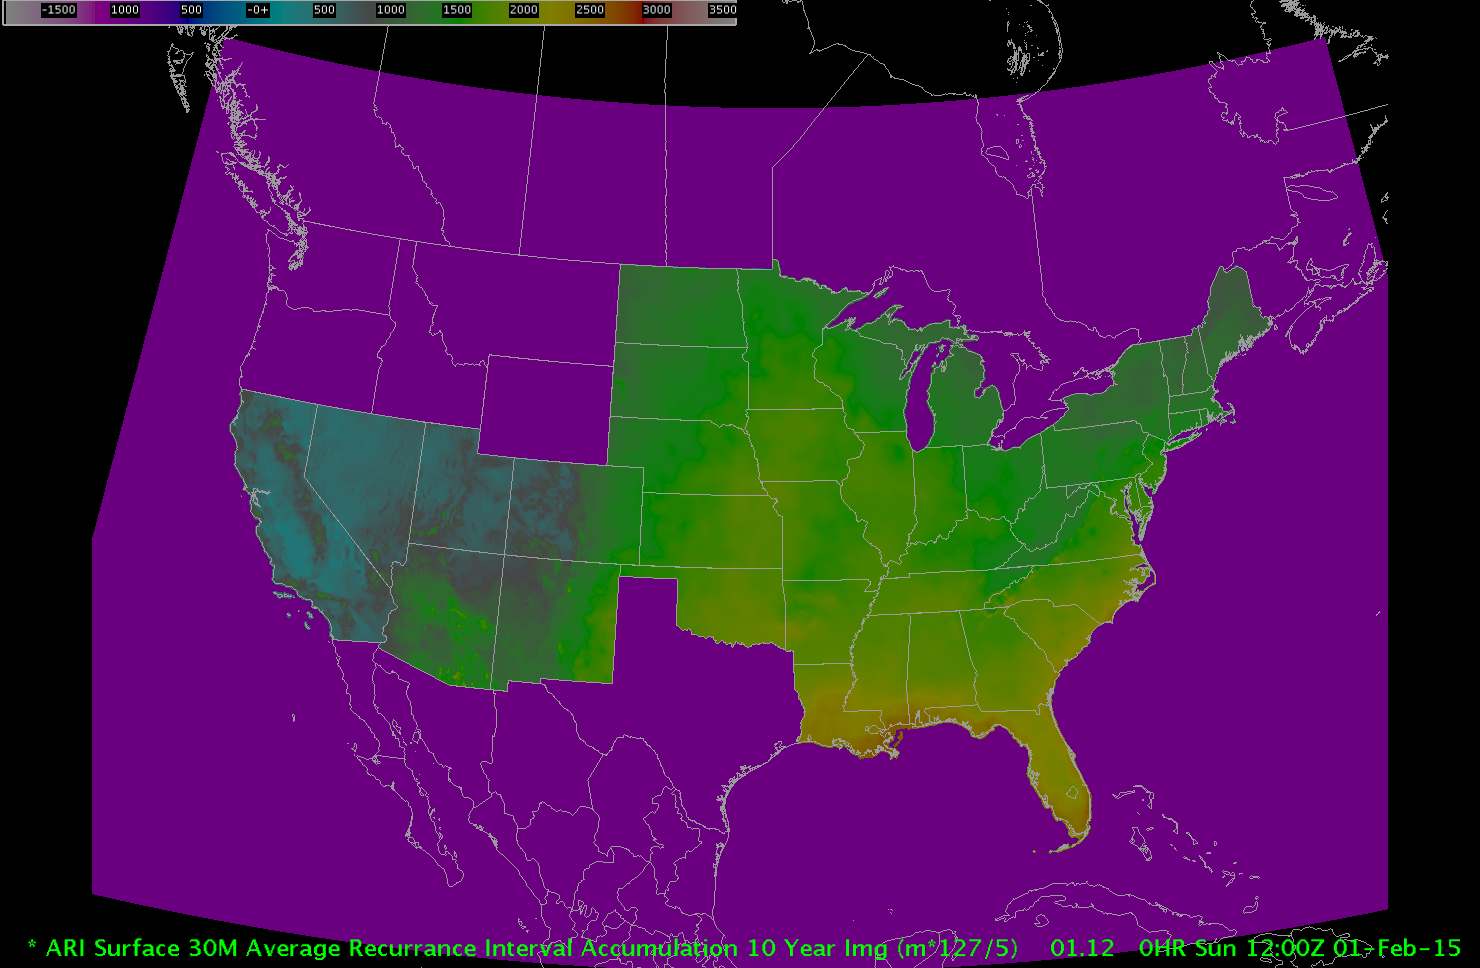
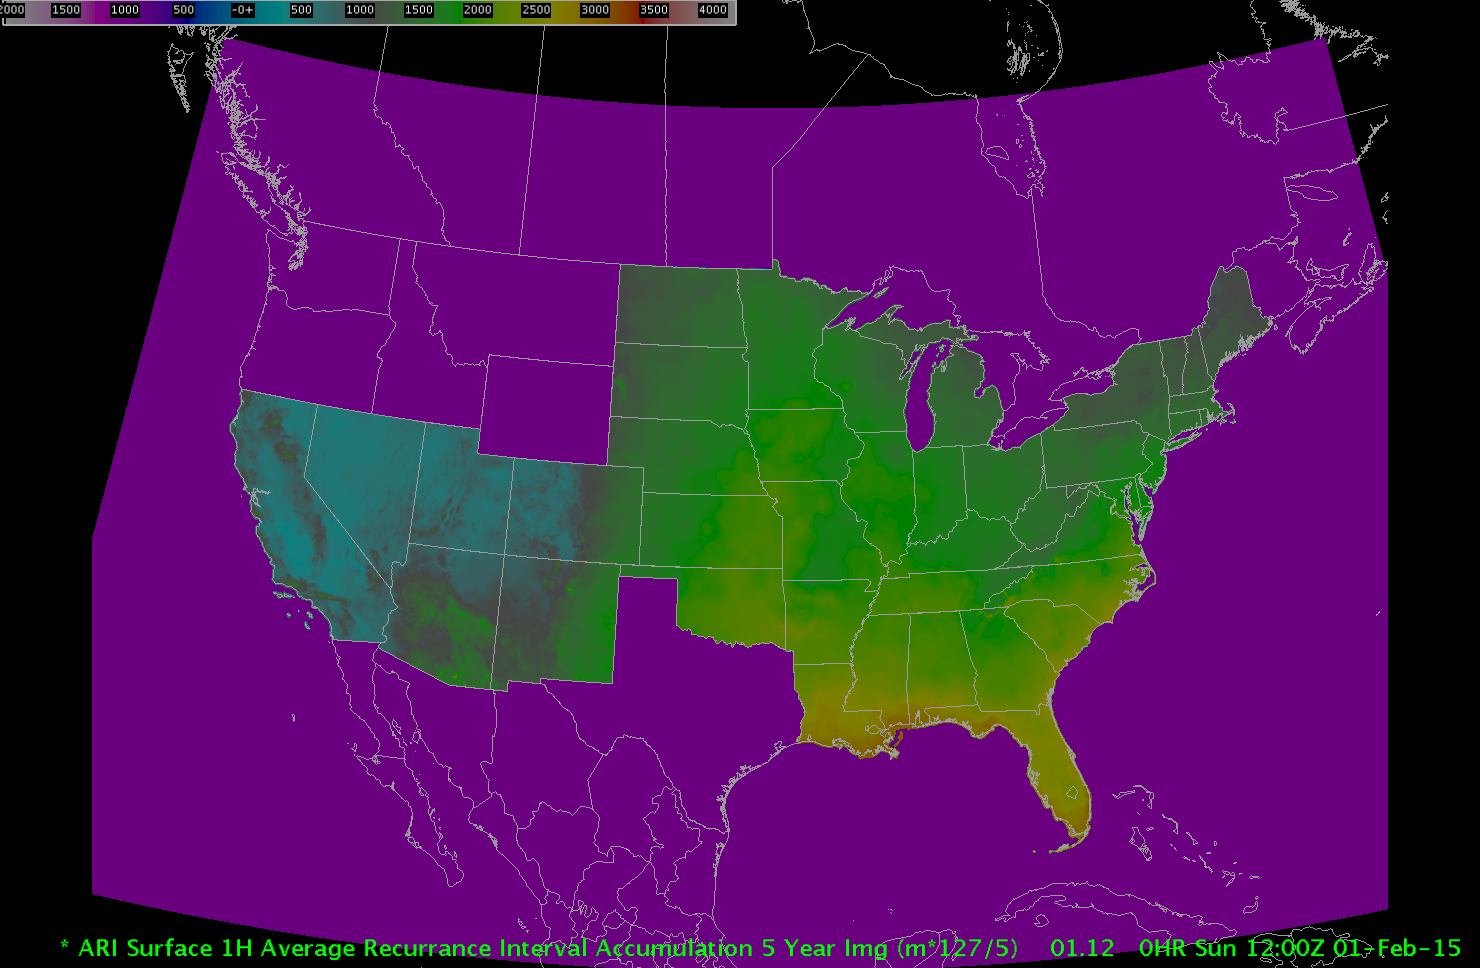
1000 Year (24 hour, 12 hour, 6 hour, 3 hour, 2 hour, 1 hour, 30 min)
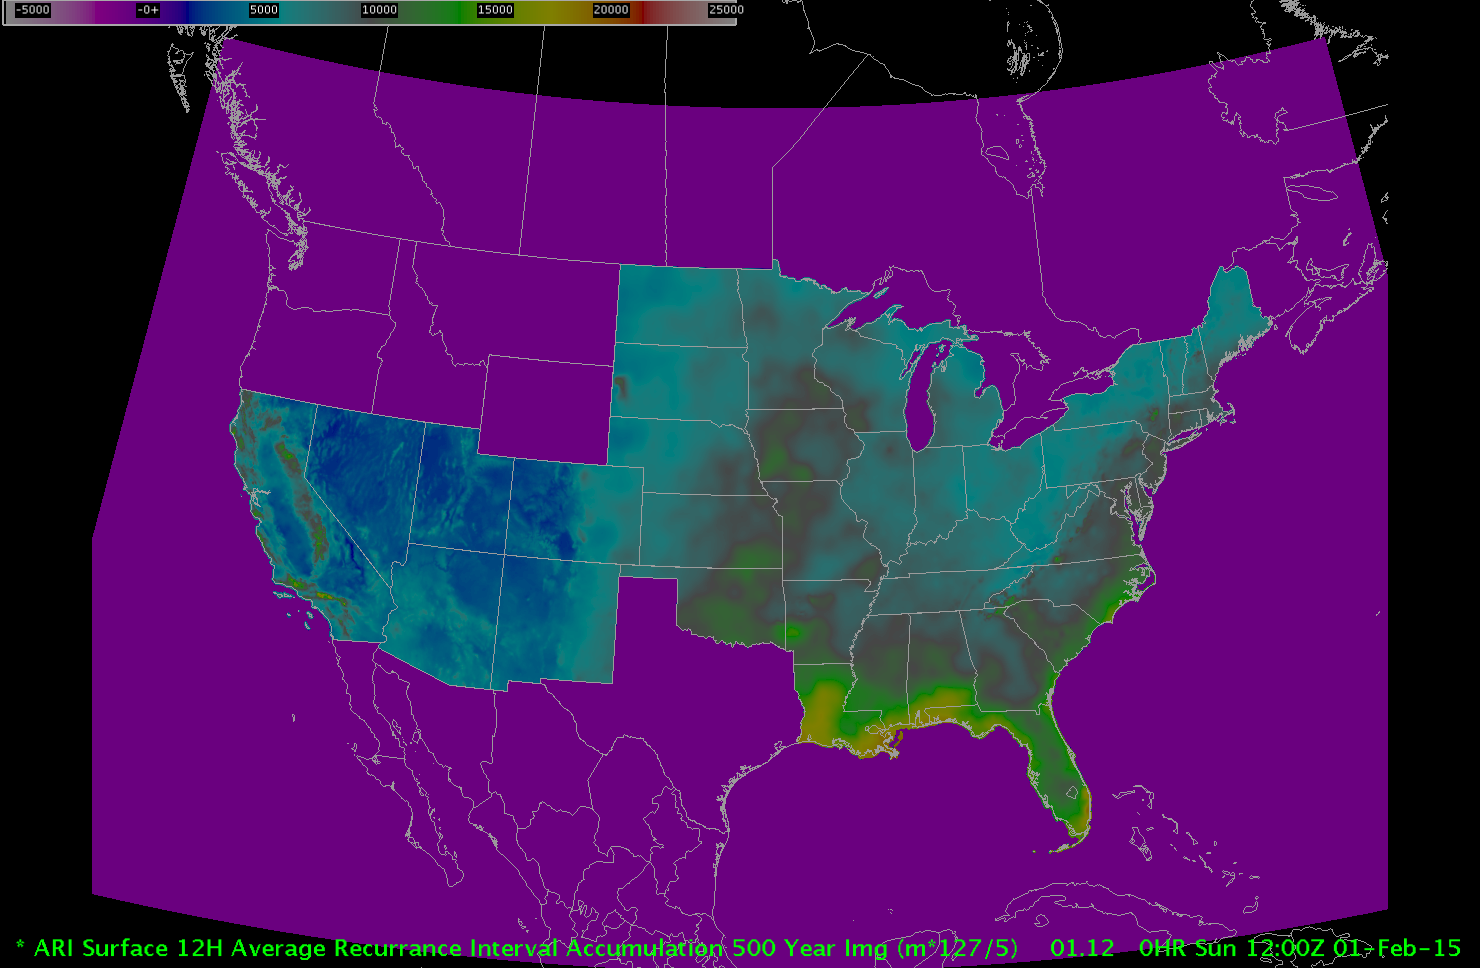
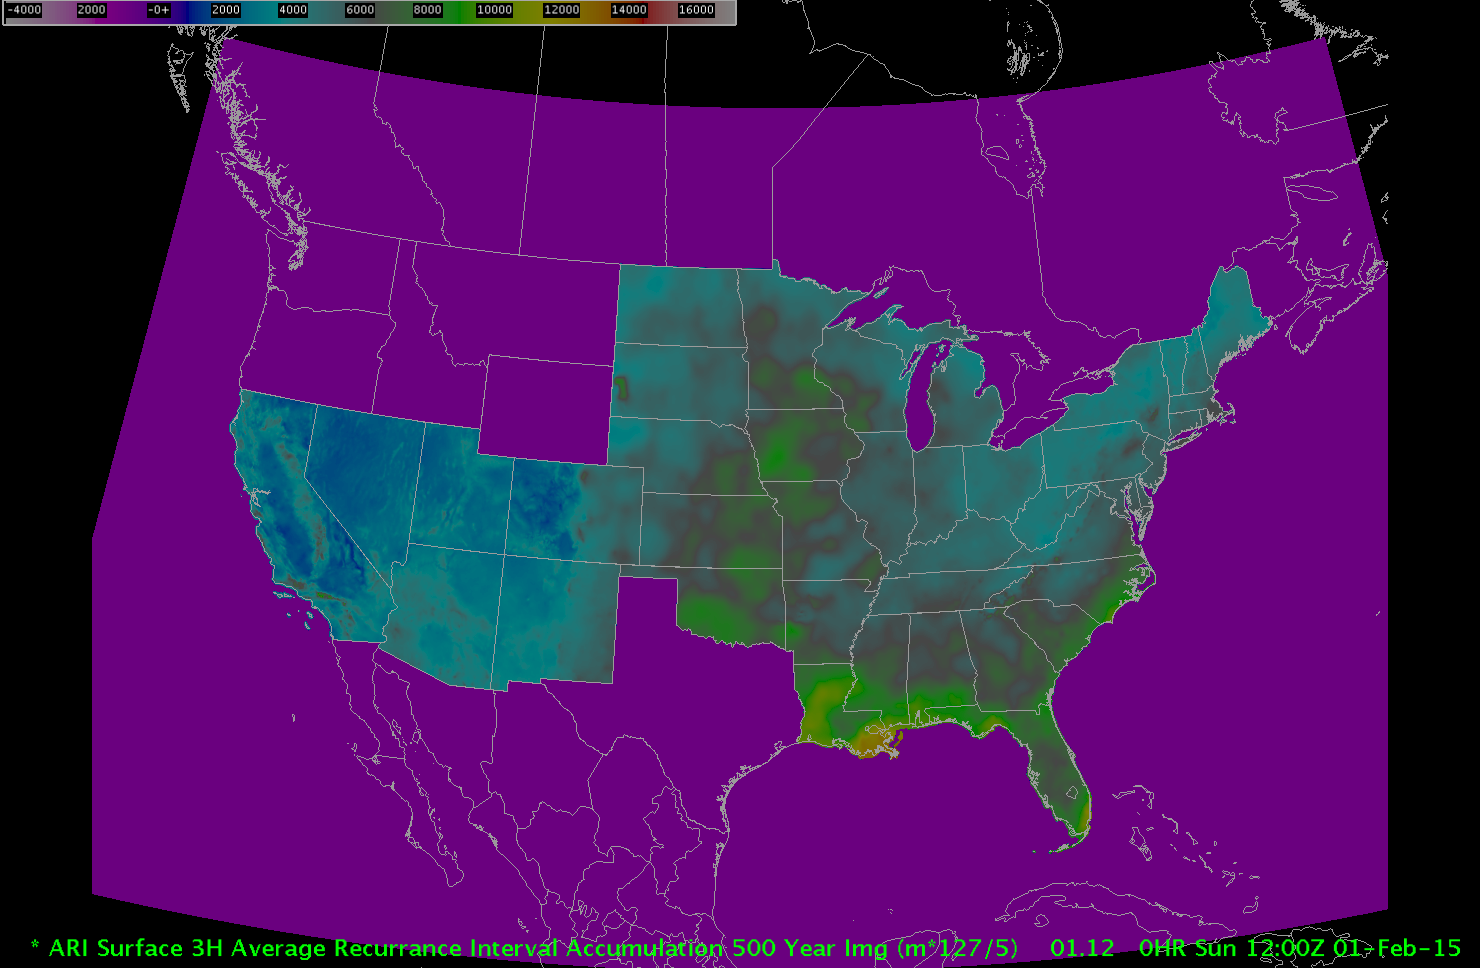
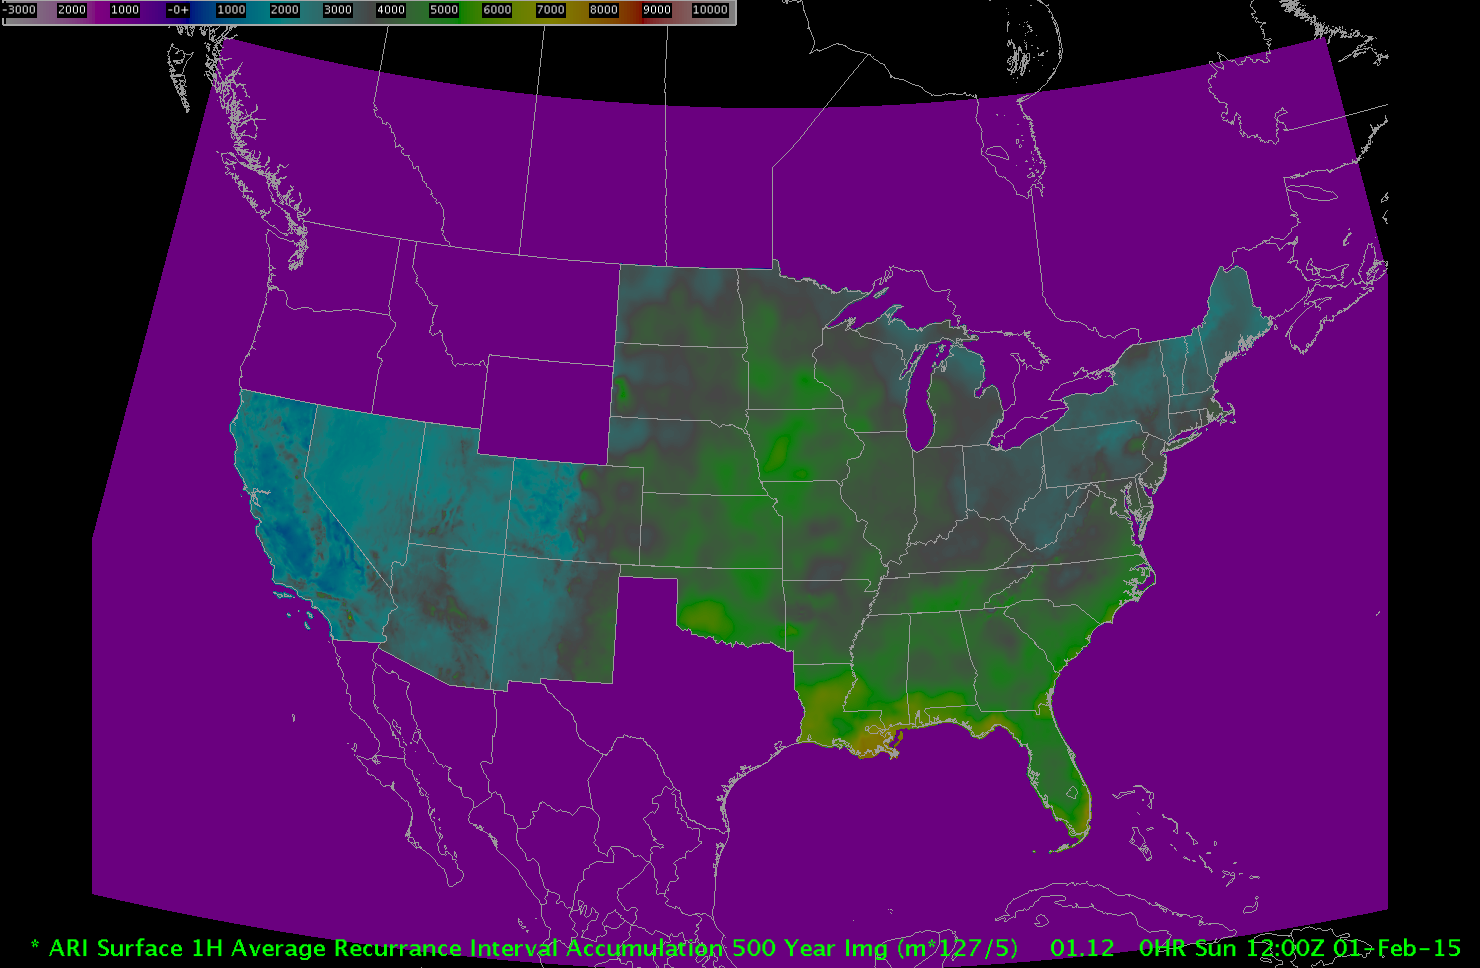
500 Year (24 hour, 12 hour, 6 hour, 3 hour, 2 hour, 1 hour, 30 min)
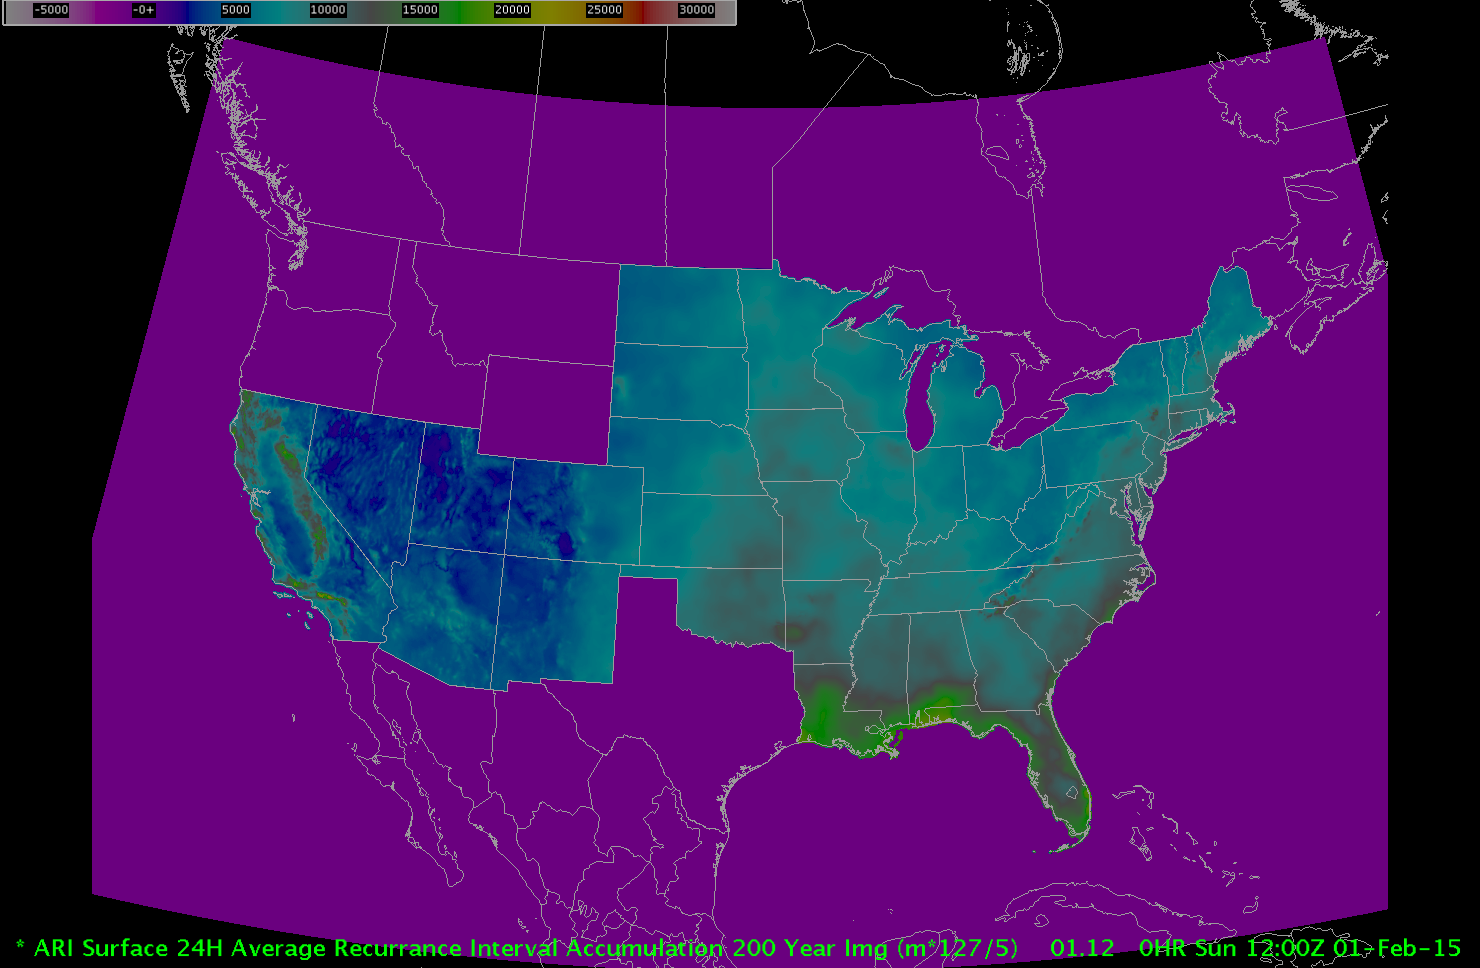
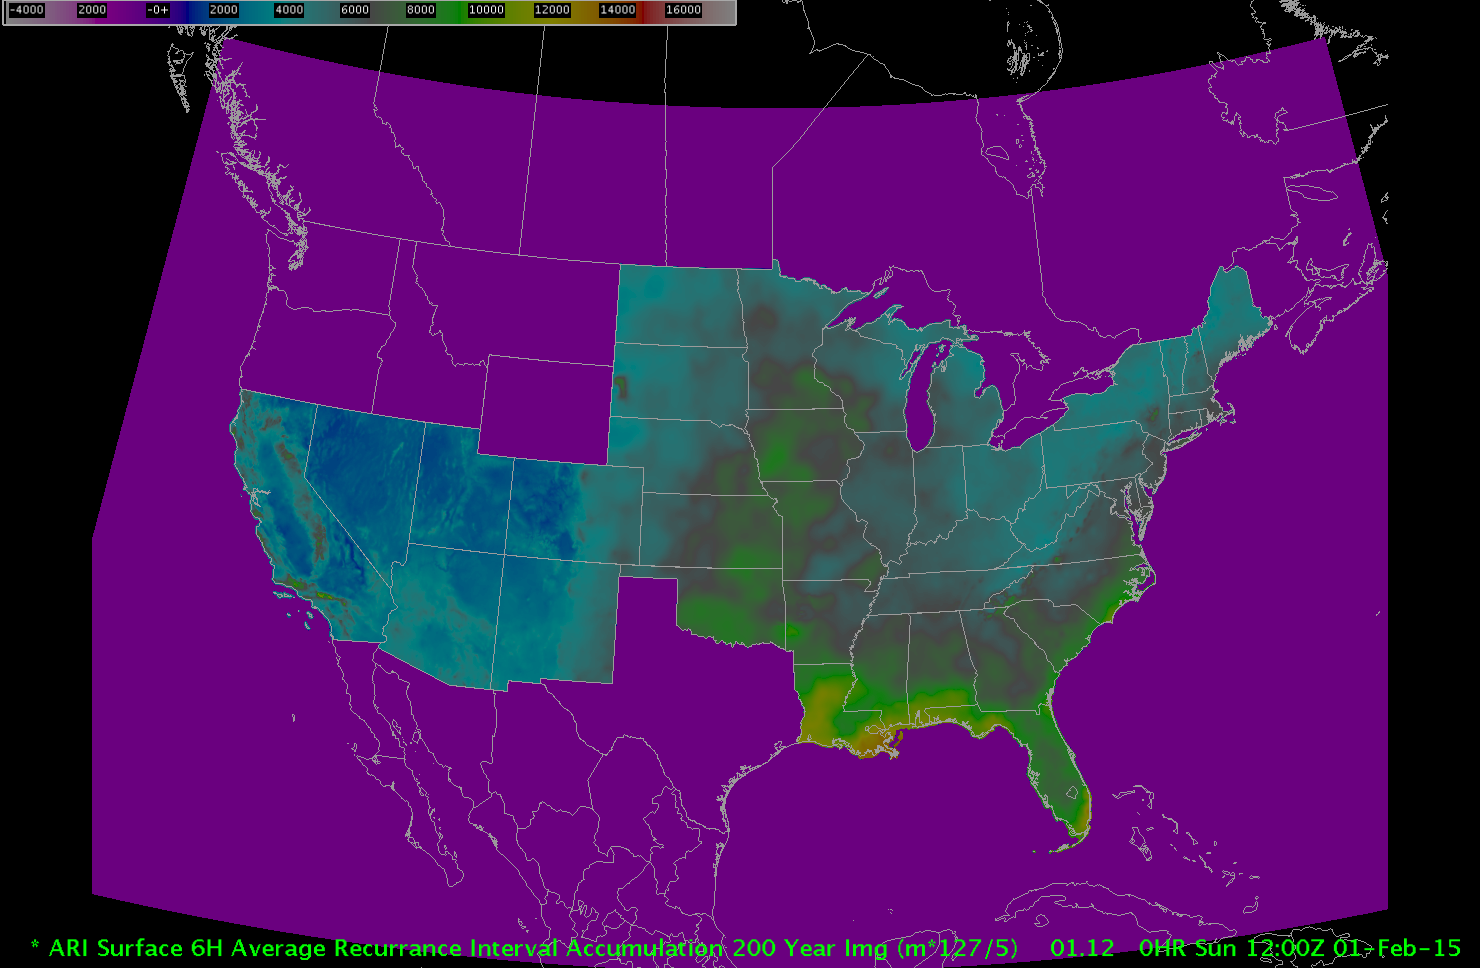
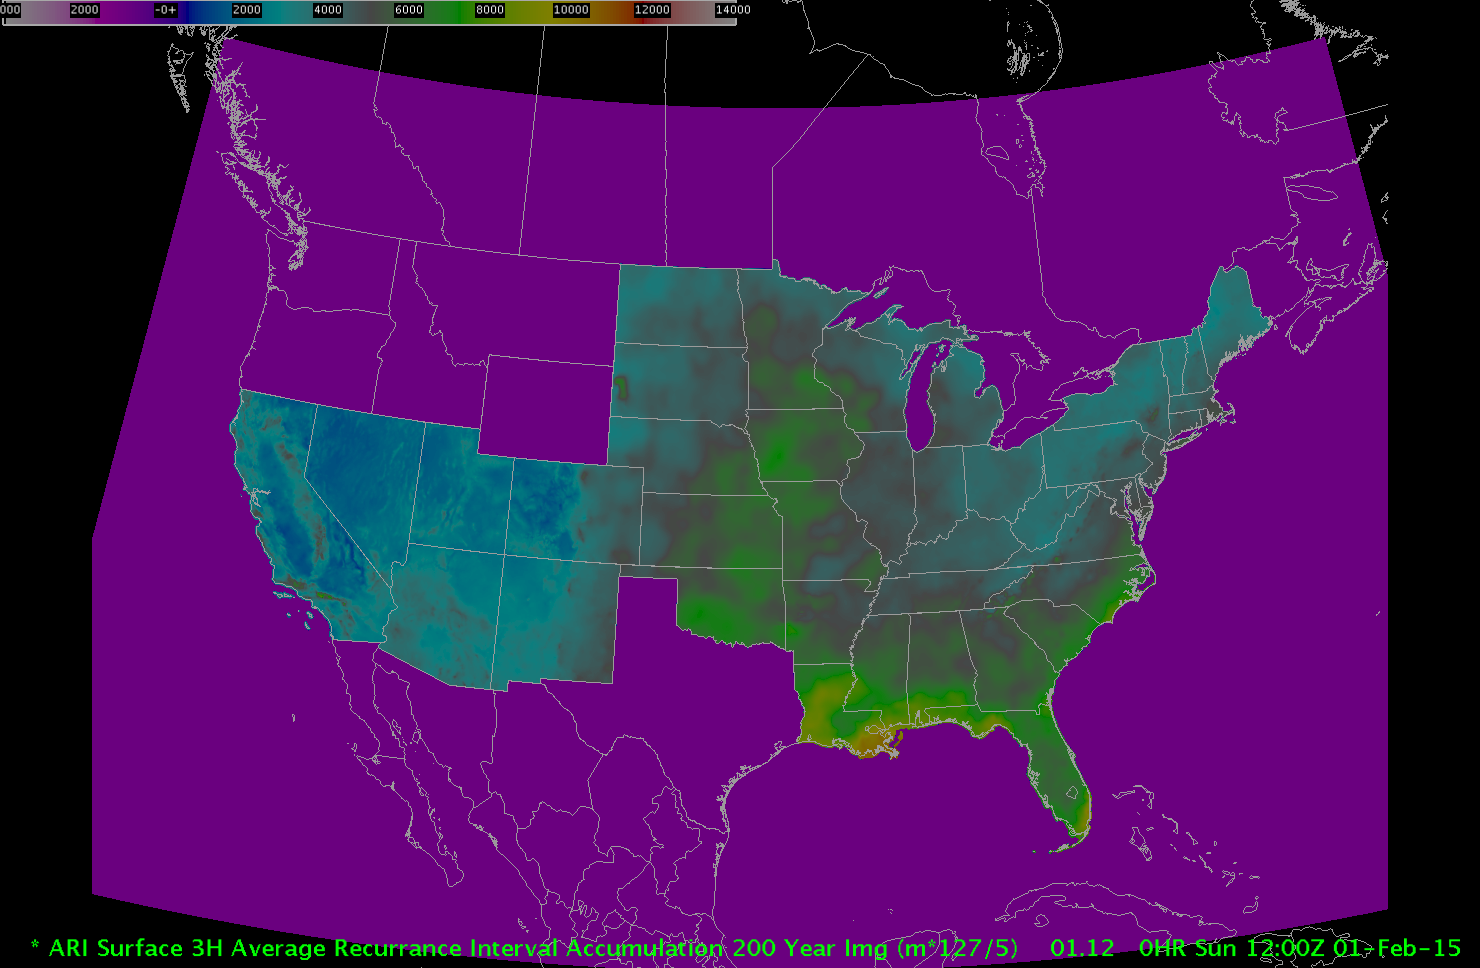
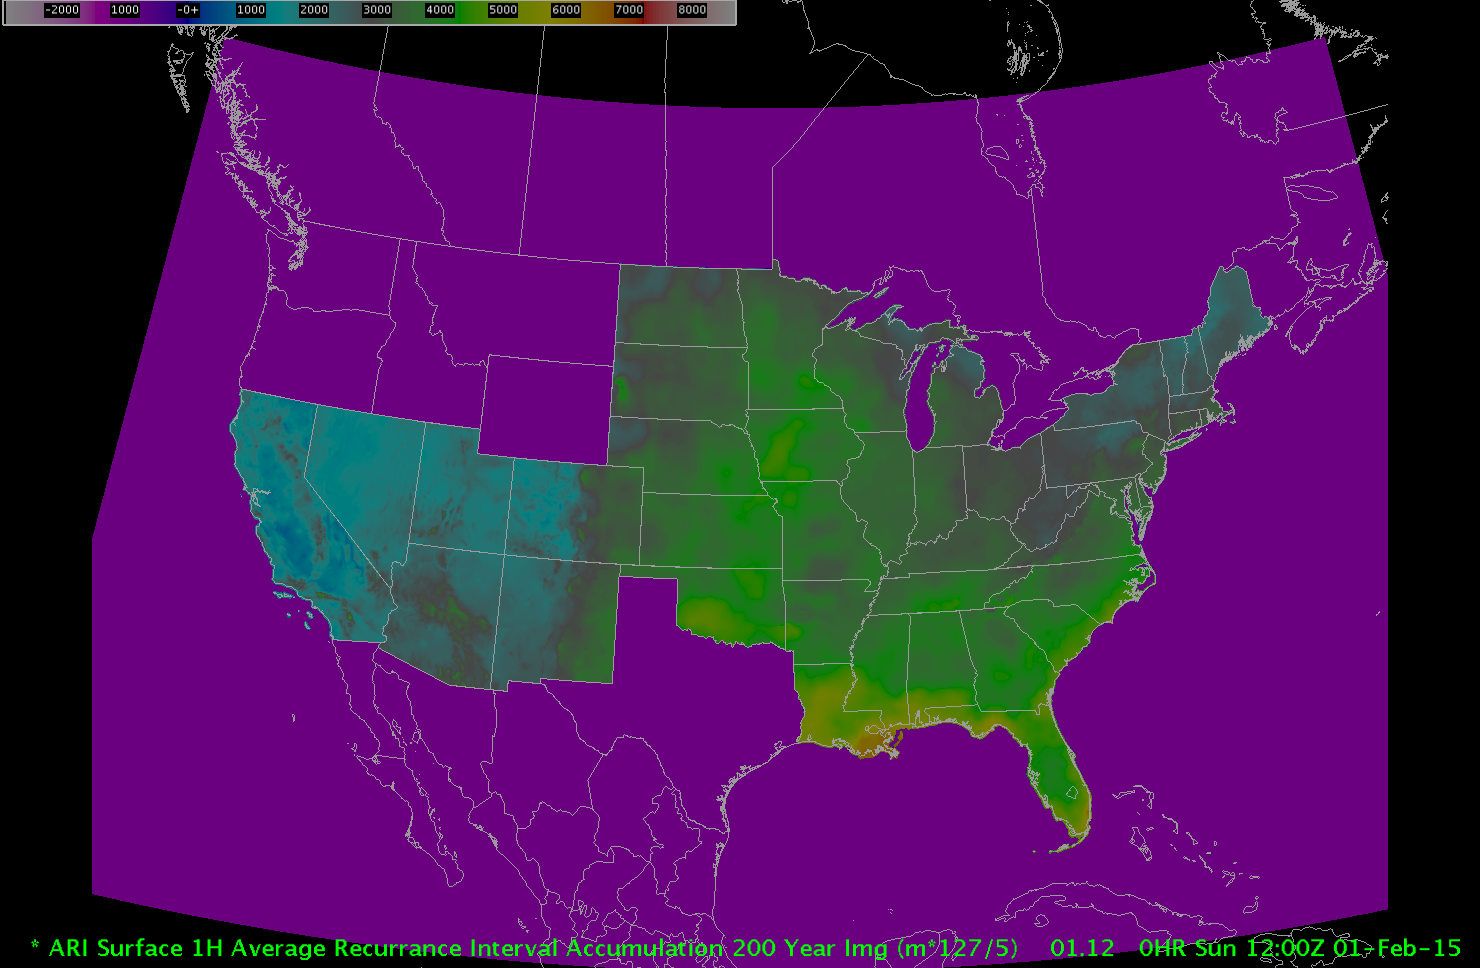
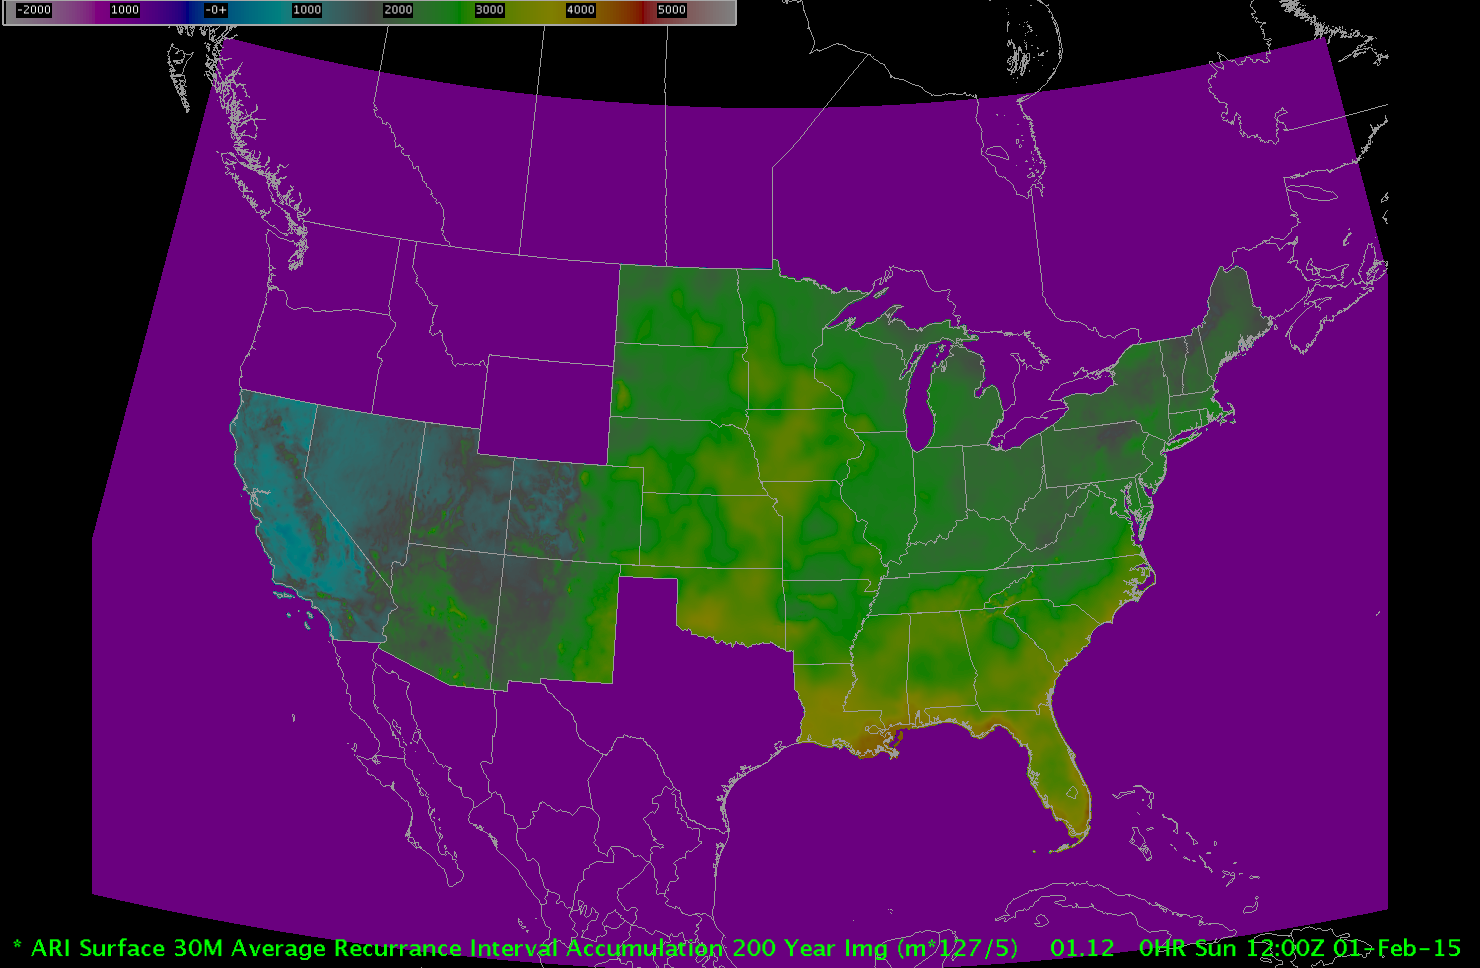
200 Year (24 hour, 12 hour, 6 hour, 3 hour, 2 hour, 1 hour, 30 min)
100 Year (24 hour, 12 hour, 6 hour, 3 hour, 2 hour, 1 hour, 30 min)
50 Year (24 hour, 12 hour, 6 hour, 3 hour, 2 hour, 1 hour, 30 min)
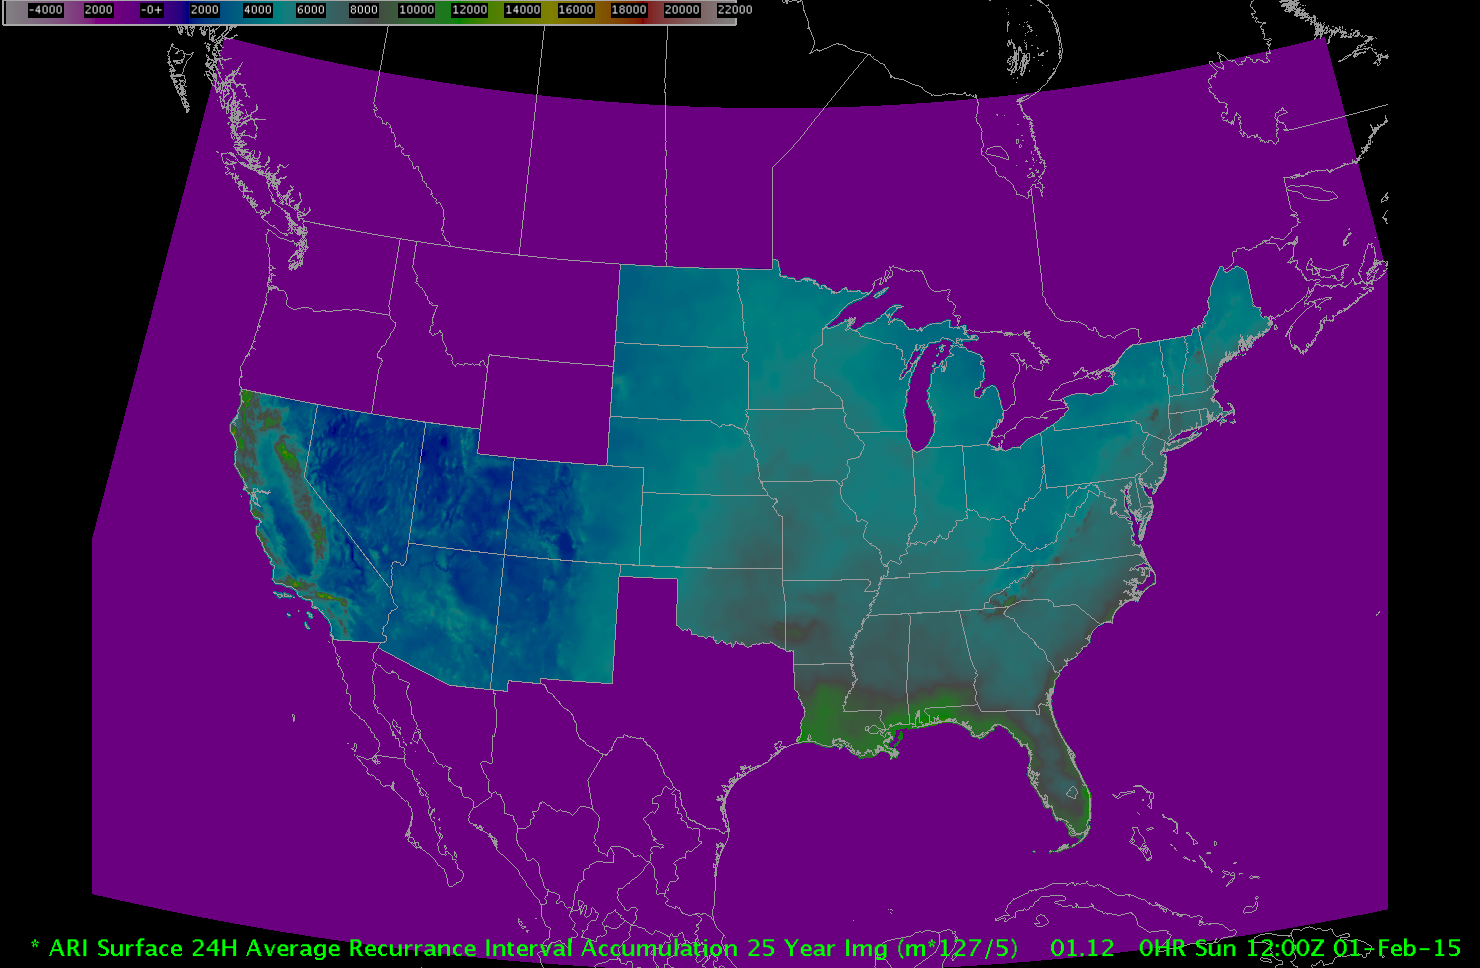
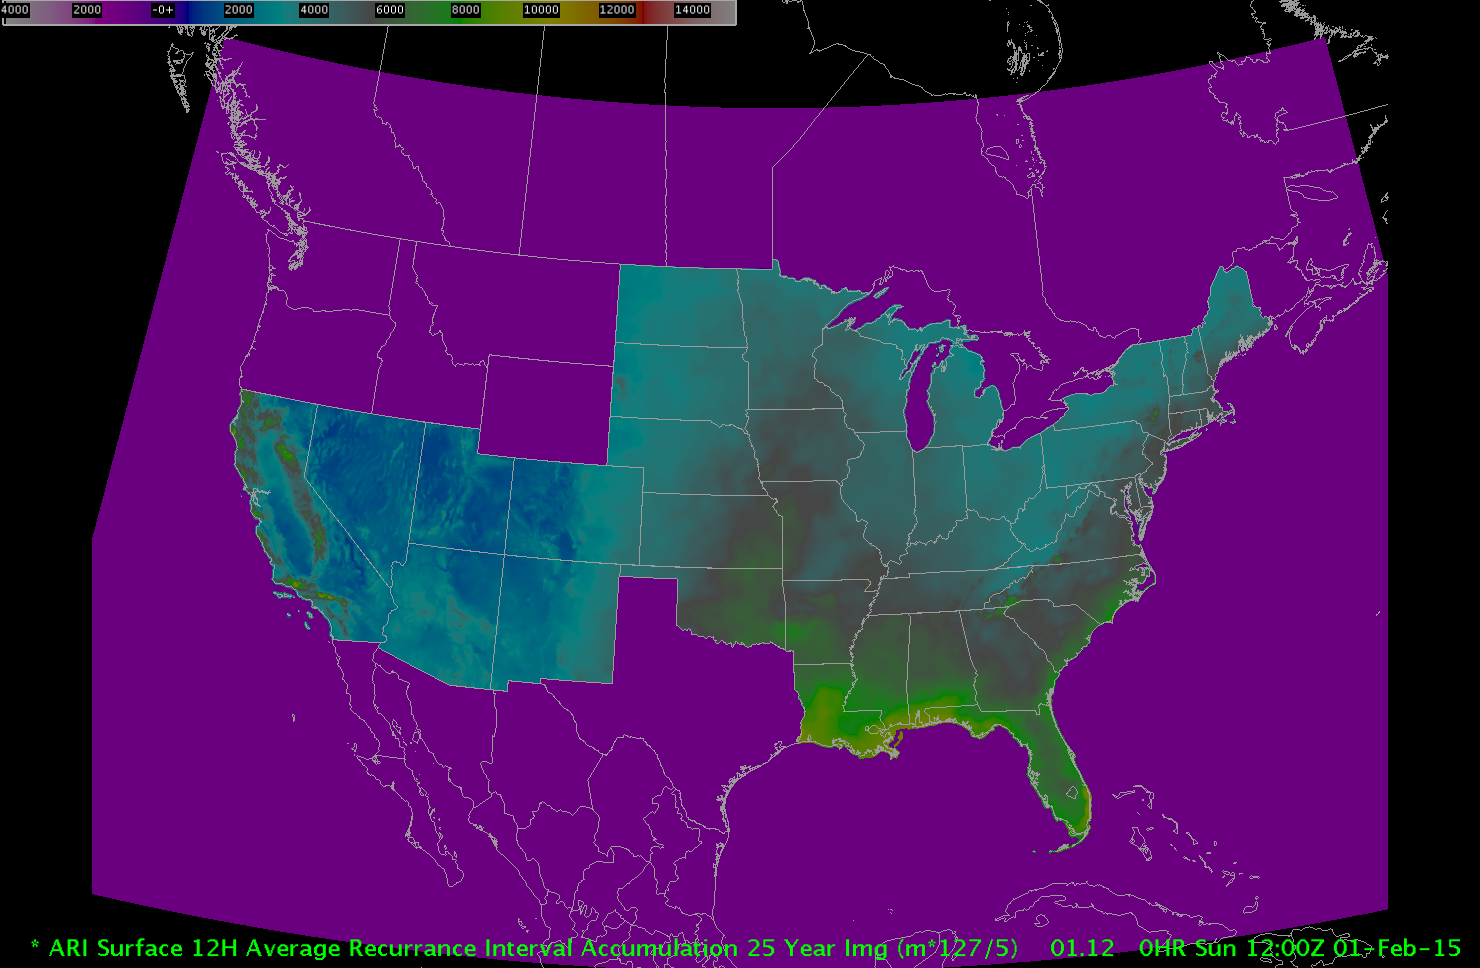
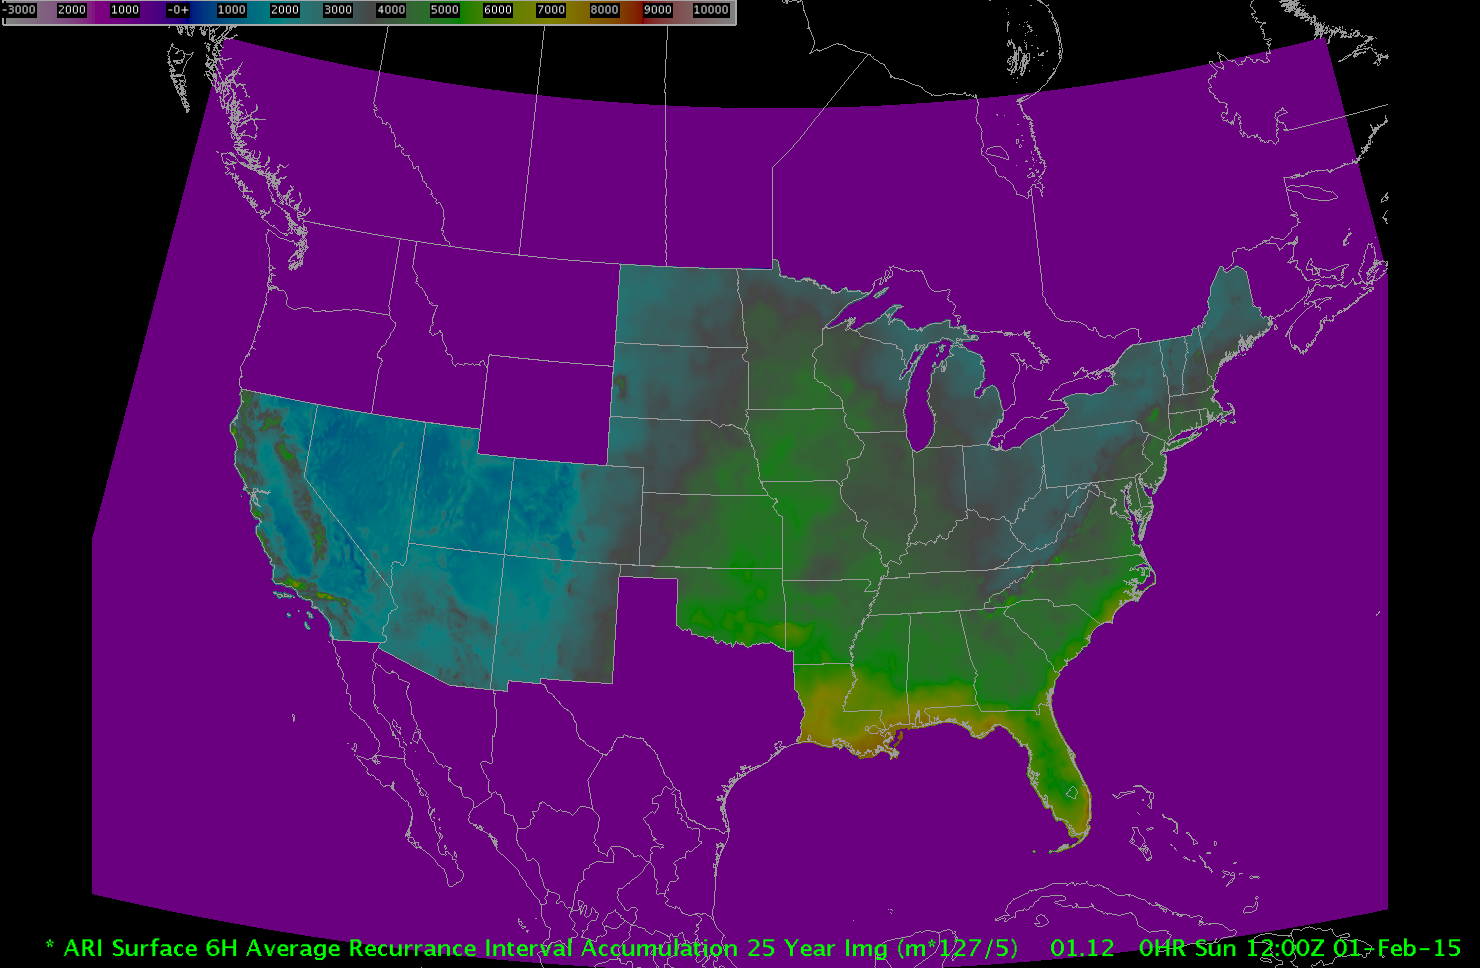
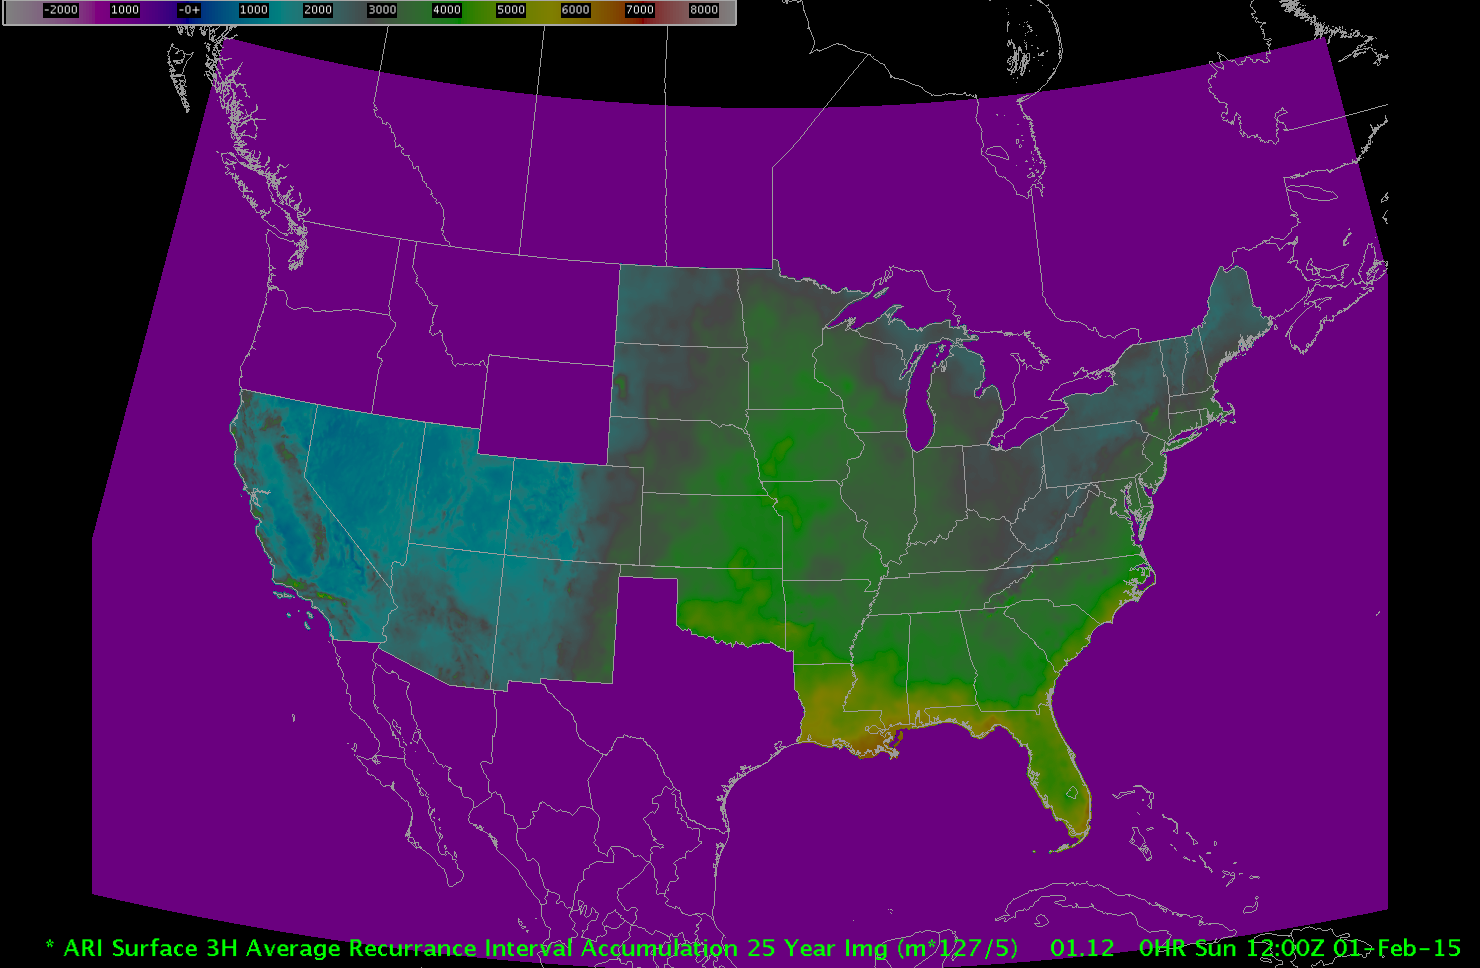
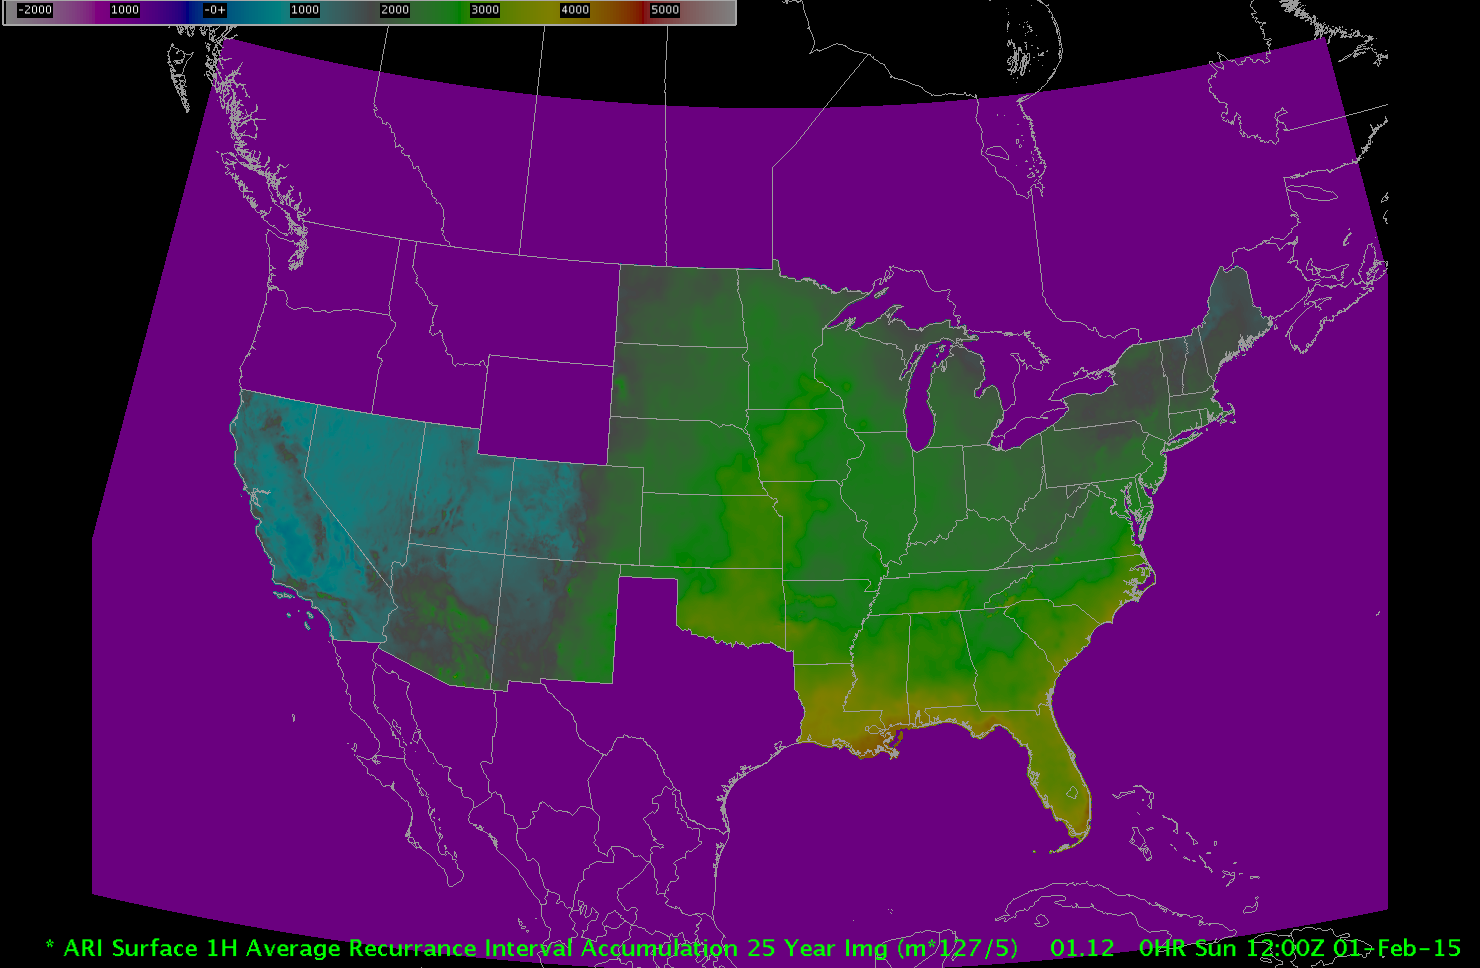
25 Year (24 hour, 12 hour, 6 hour, 3 hour, 2 hour, 1 hour, 30 min)
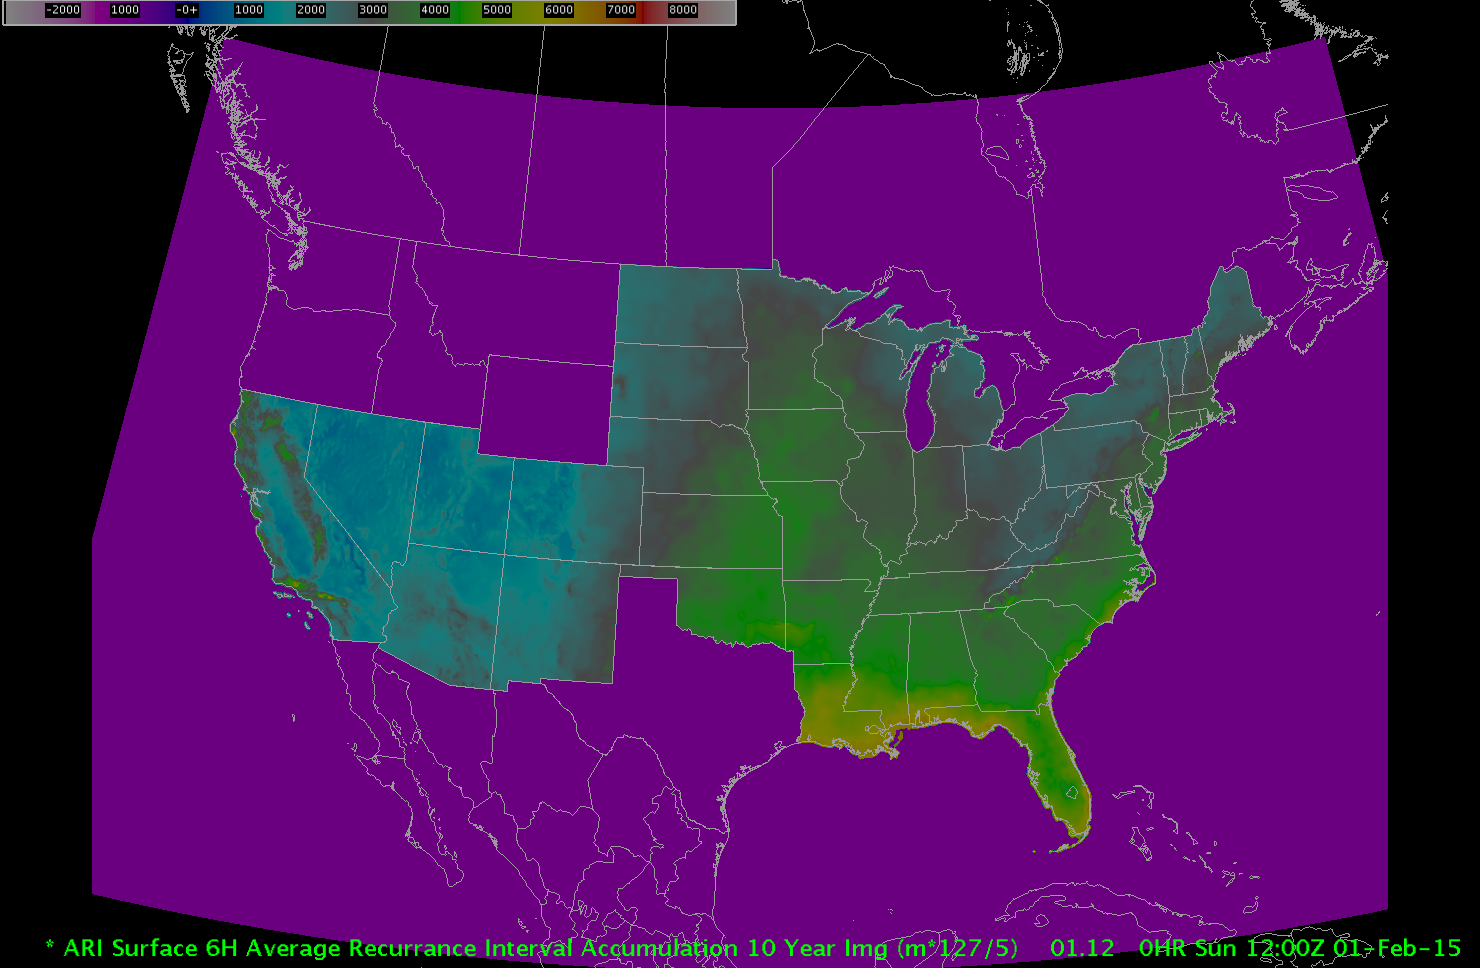
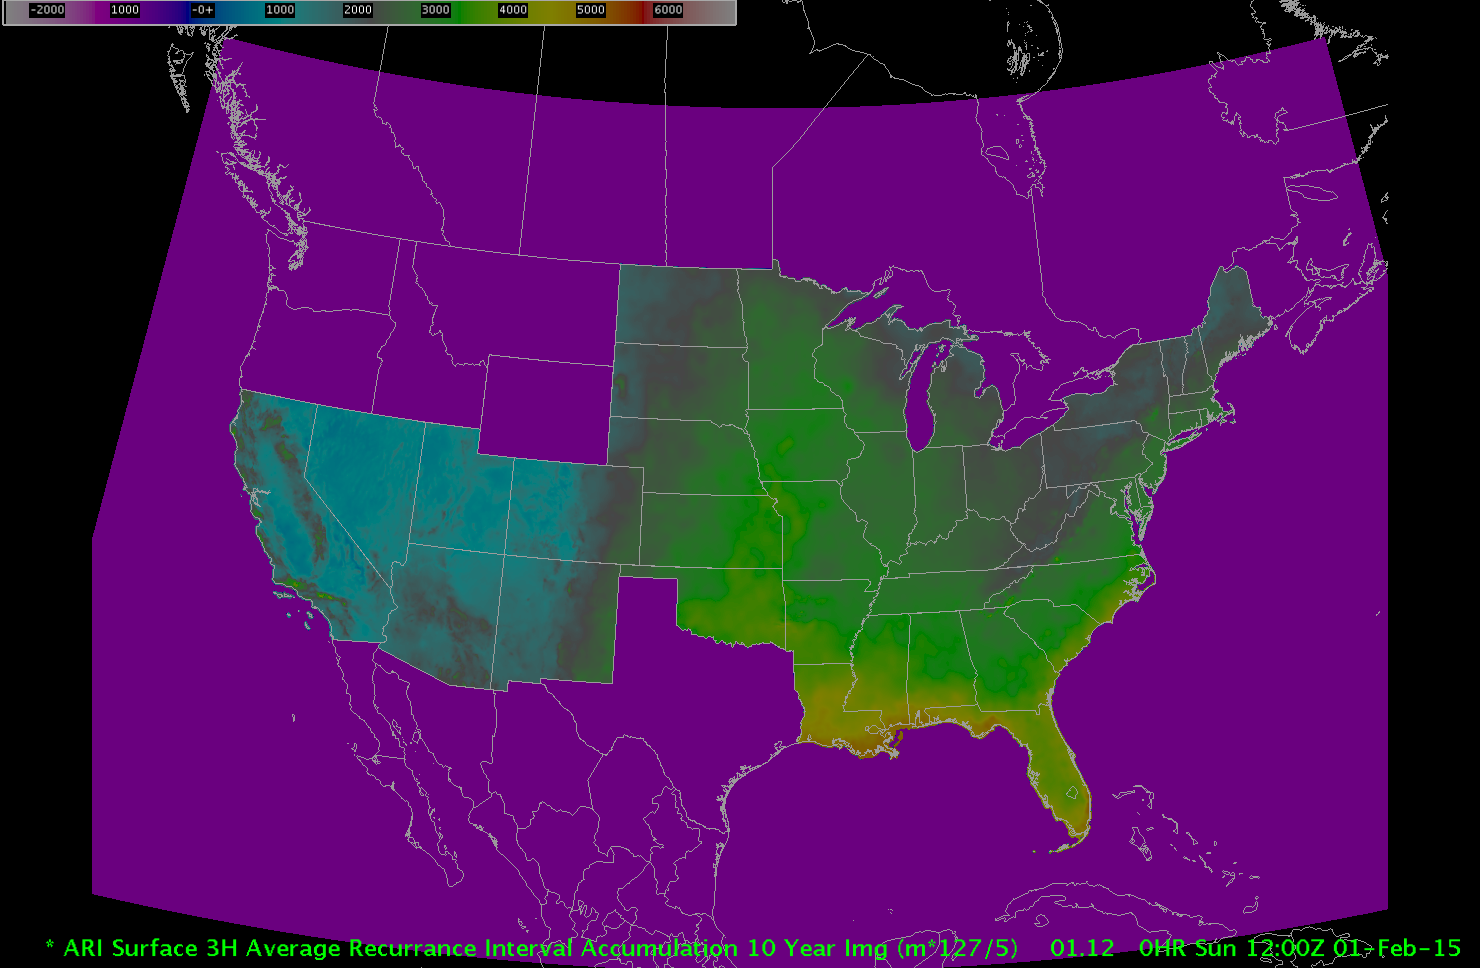
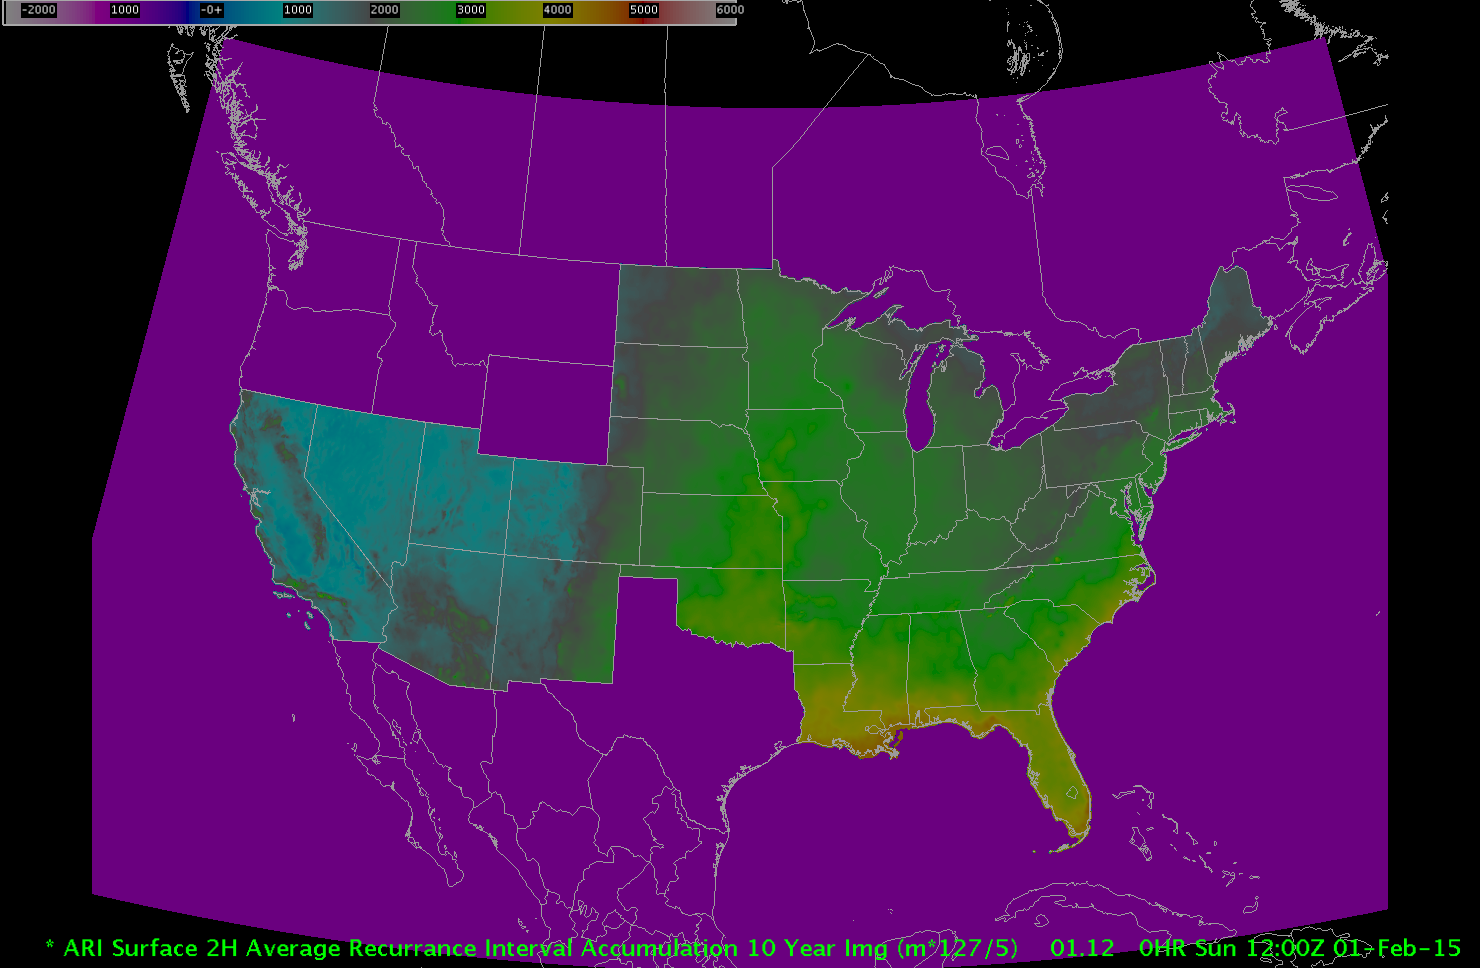
10 Year (24 hour, 12 hour, 6 hour, 3 hour, 2 hour, 1 hour, 30 min)
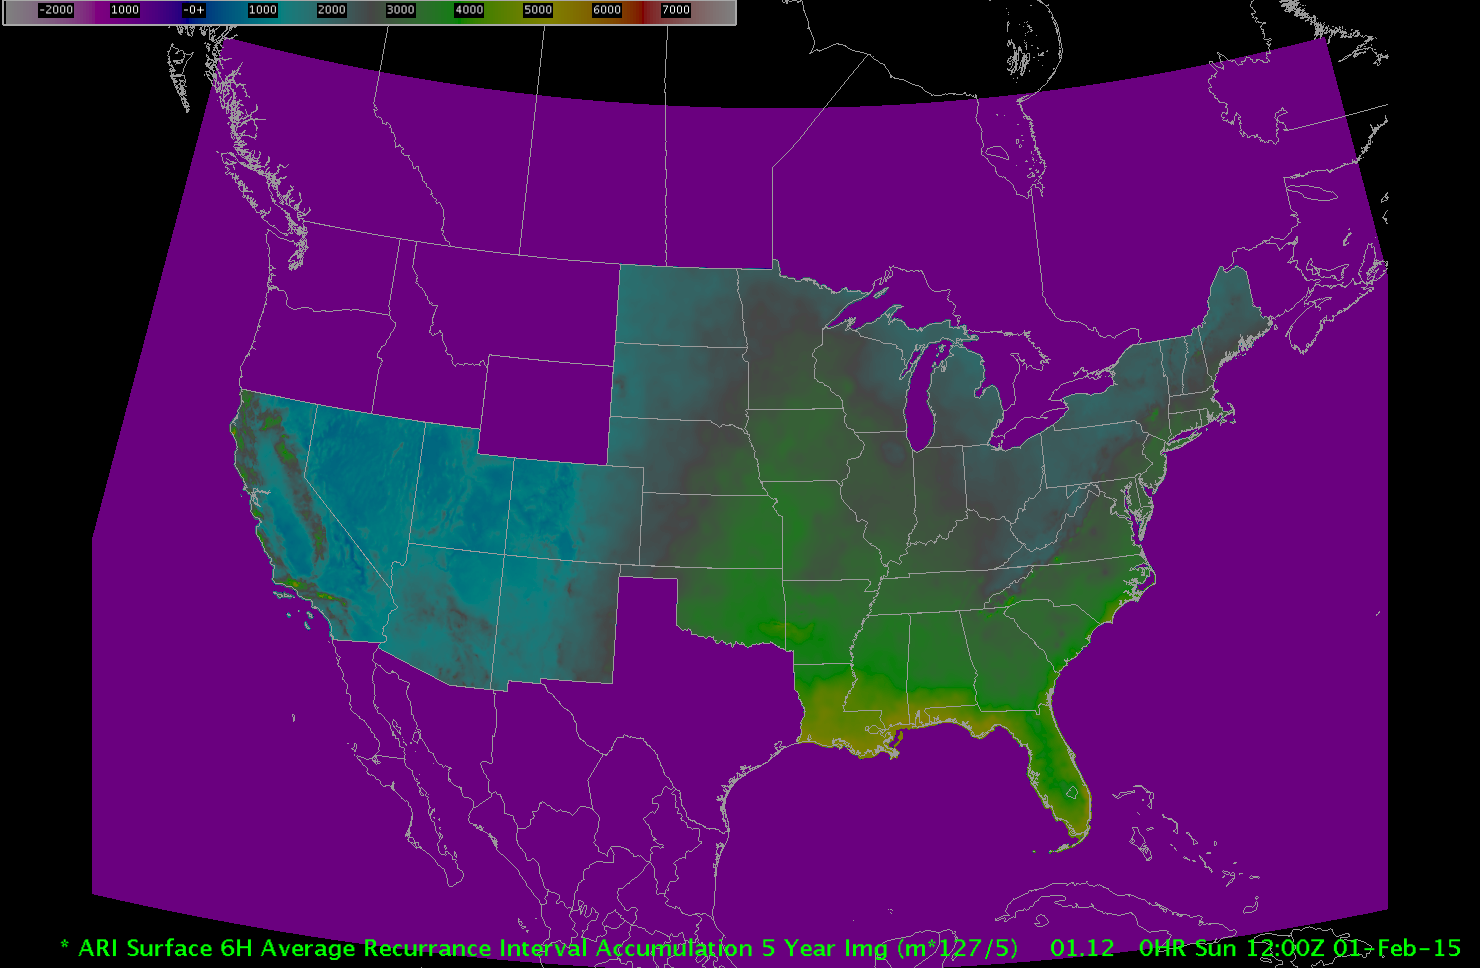
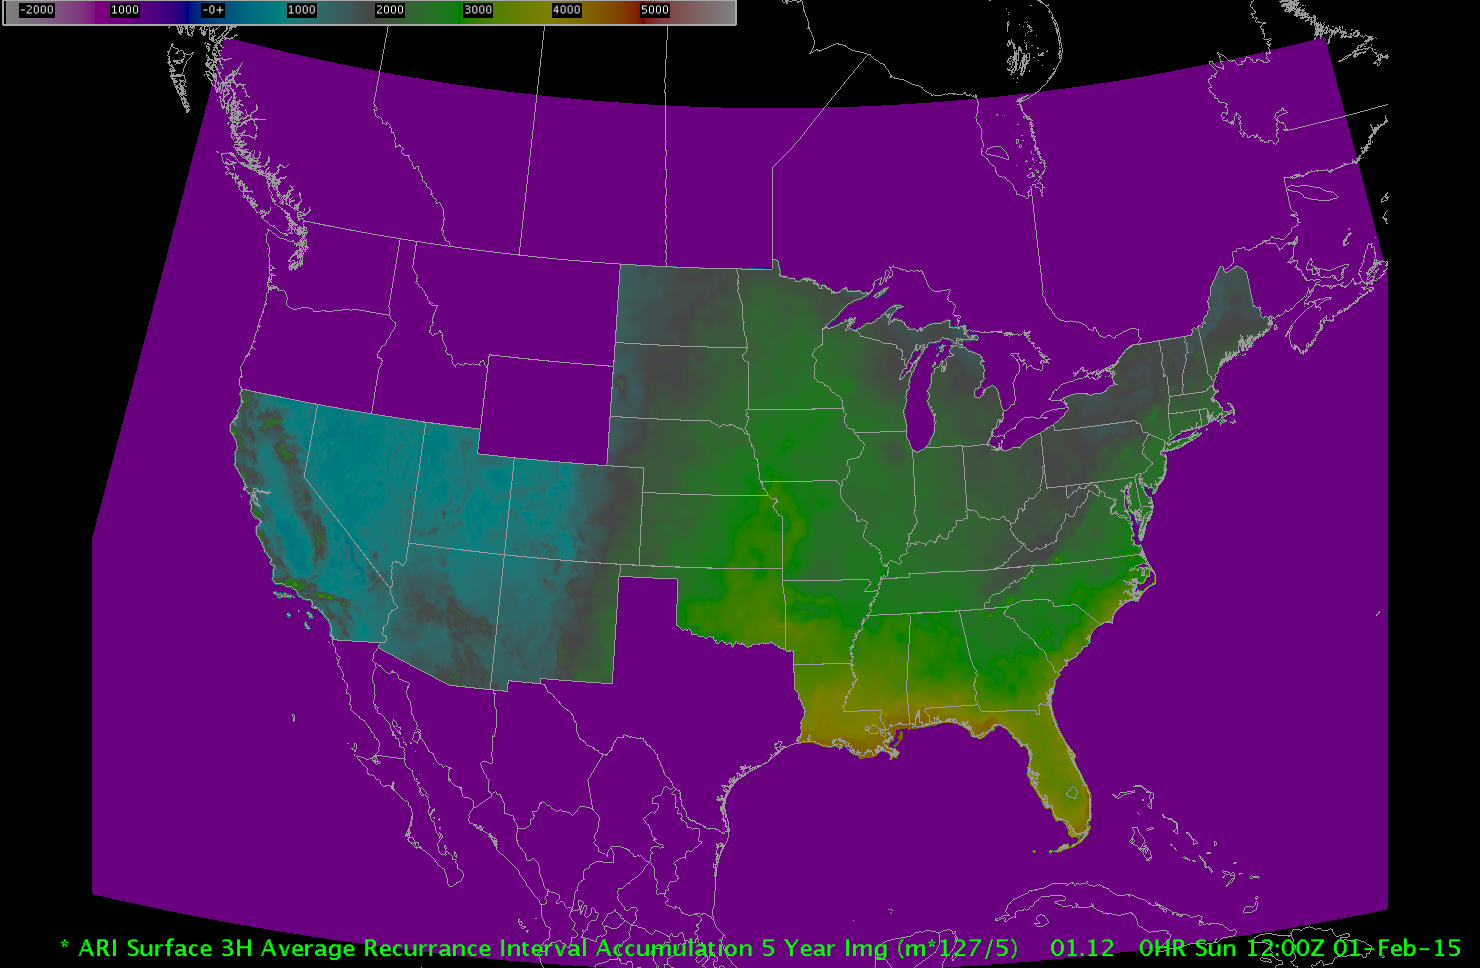
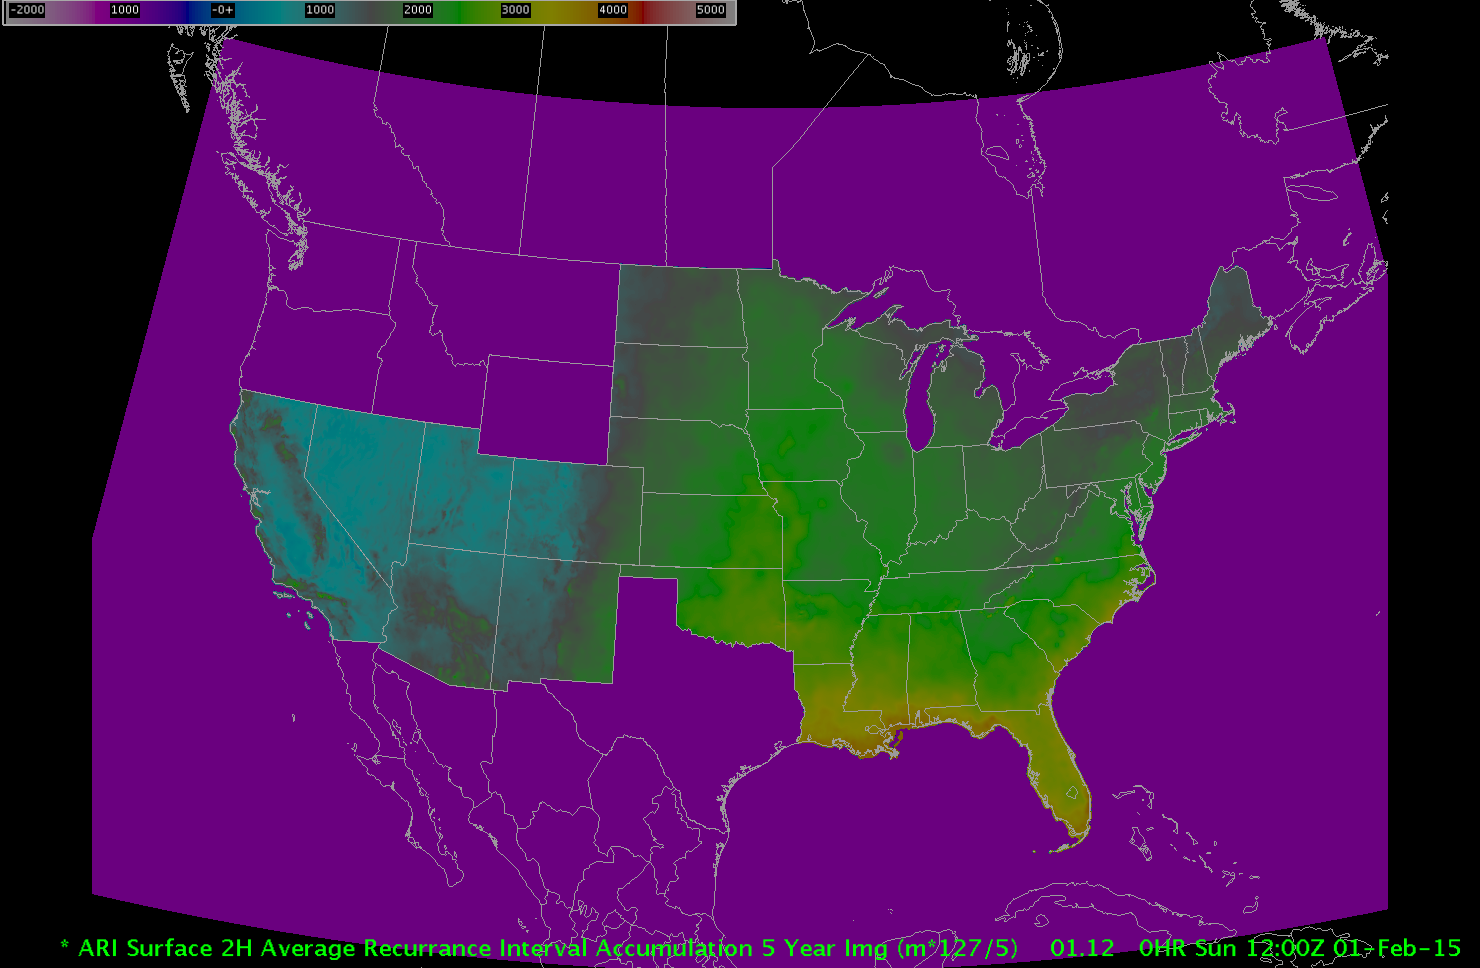
5 Year (24 hour, 12 hour, 6 hour, 3 hour, 2 hour, 1 hour, 30 min)
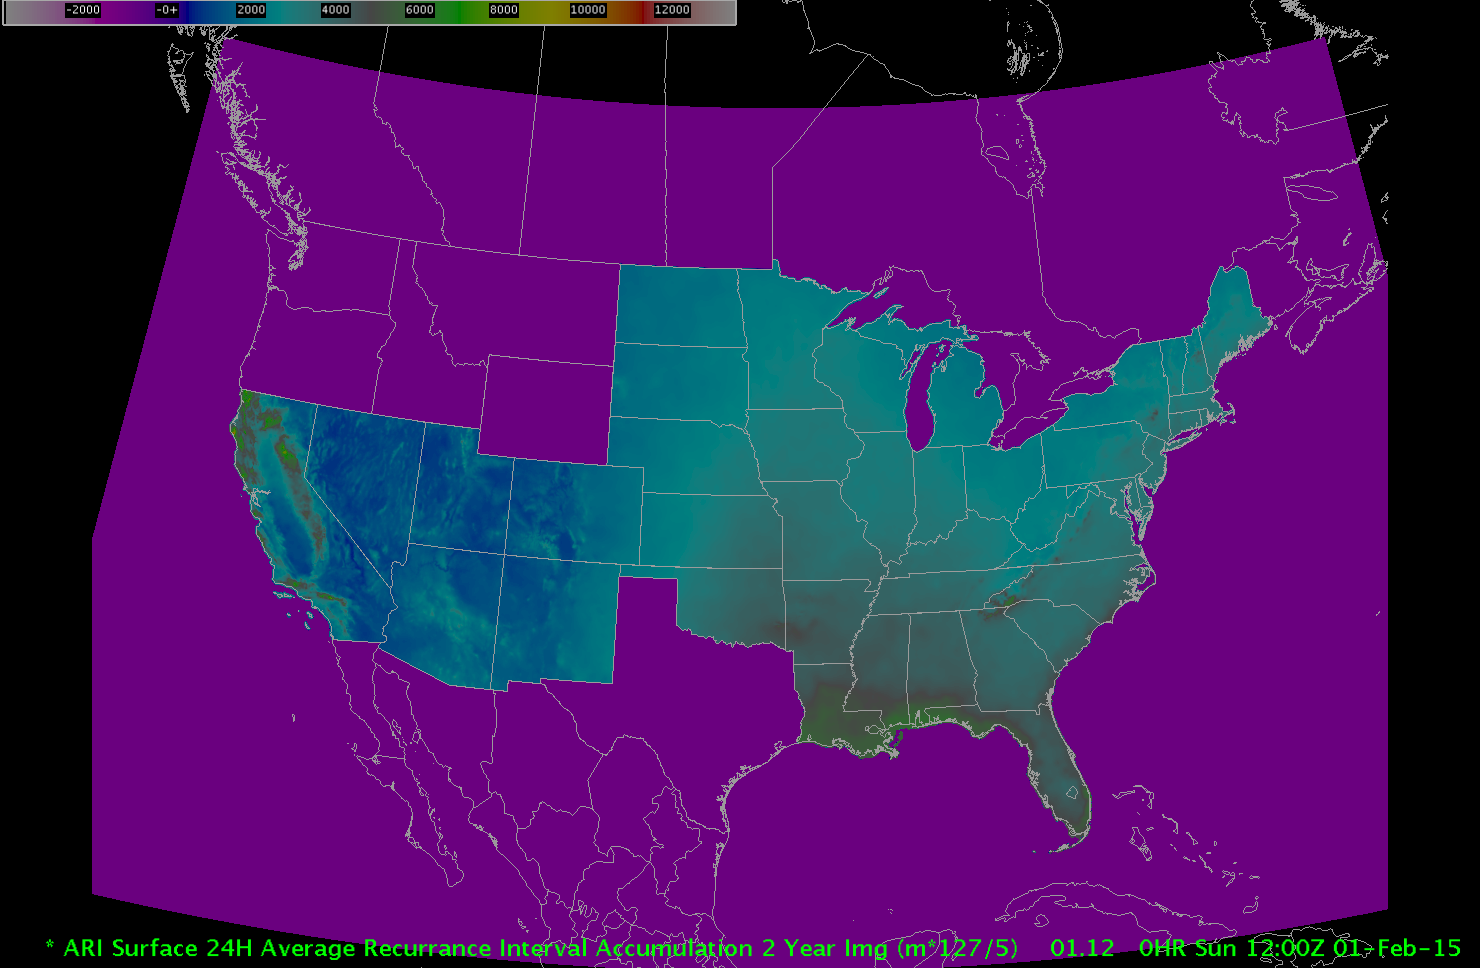
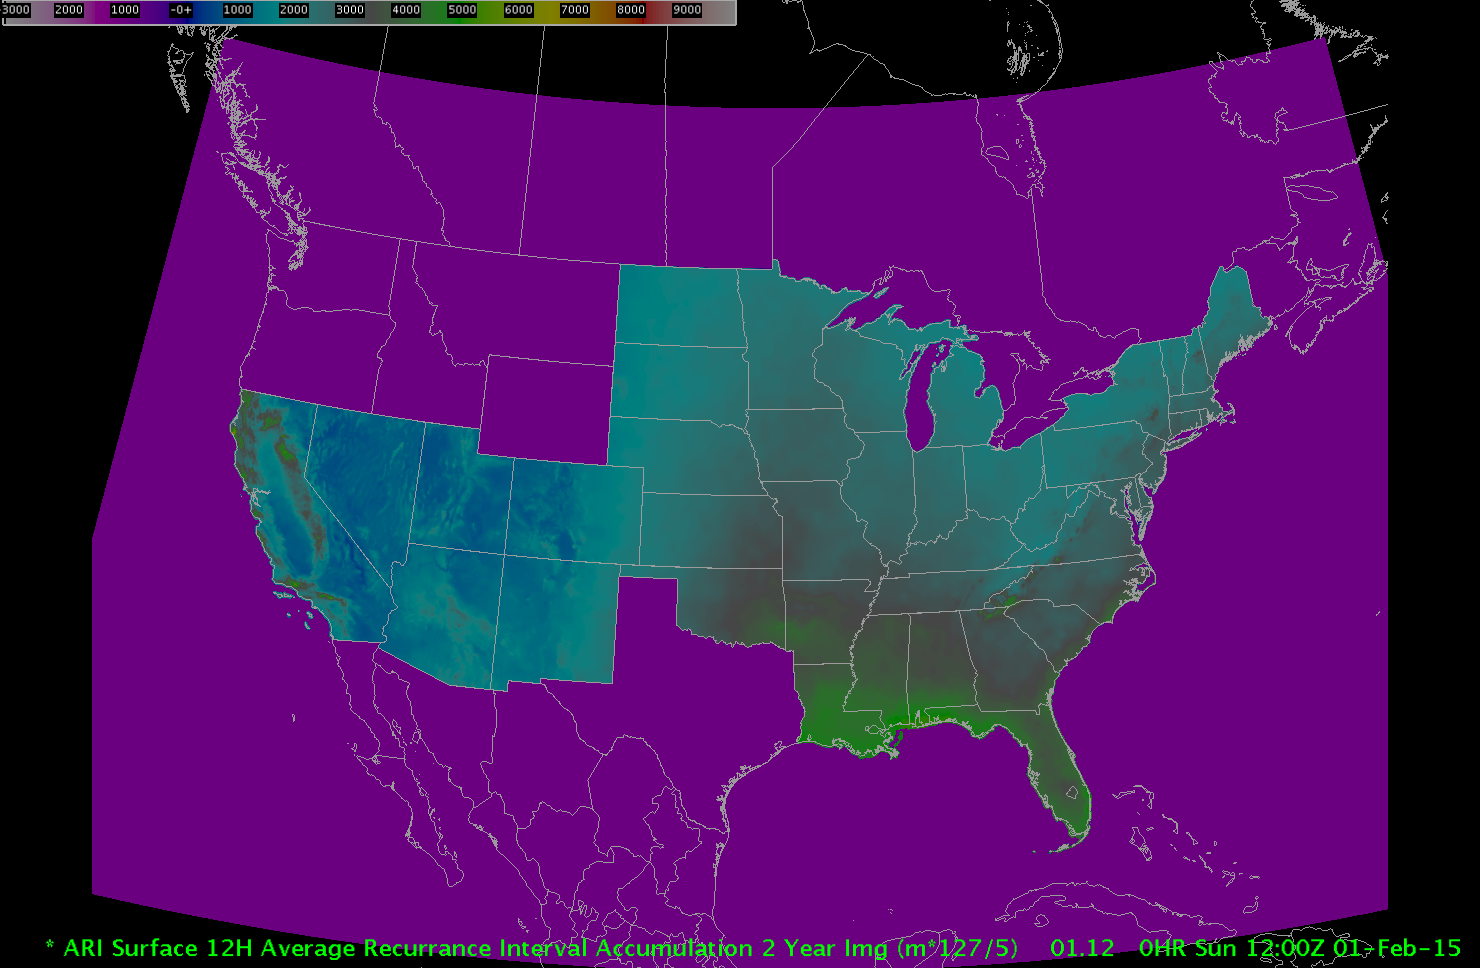
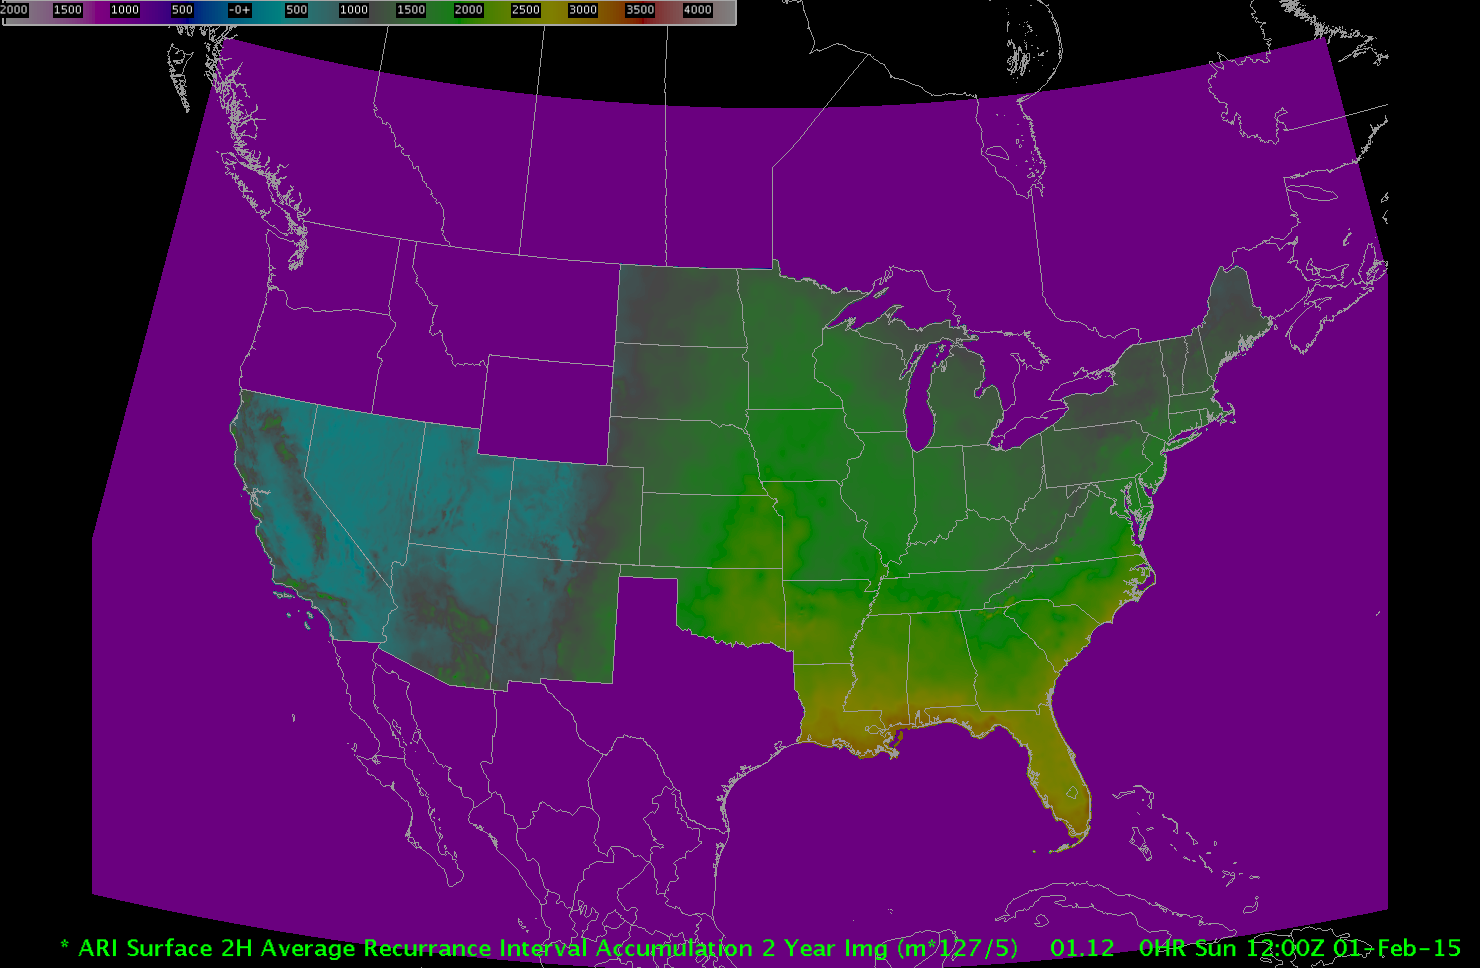
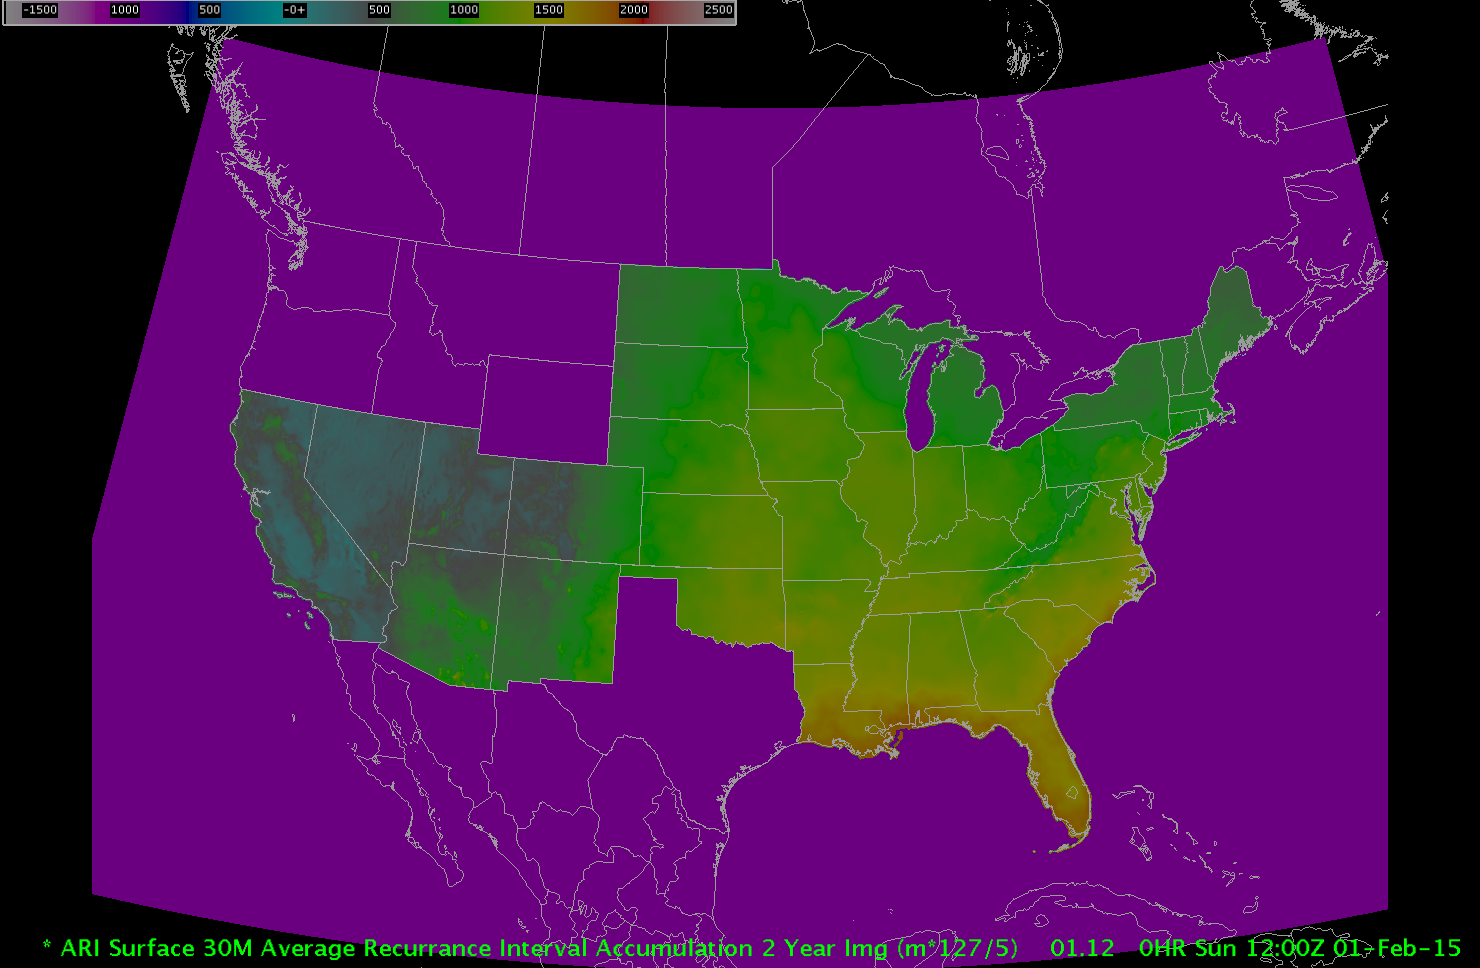
2 Year (24 hour, 12 hour, 6 hour, 3 hour, 2 hour, 1 hour, 30 min)
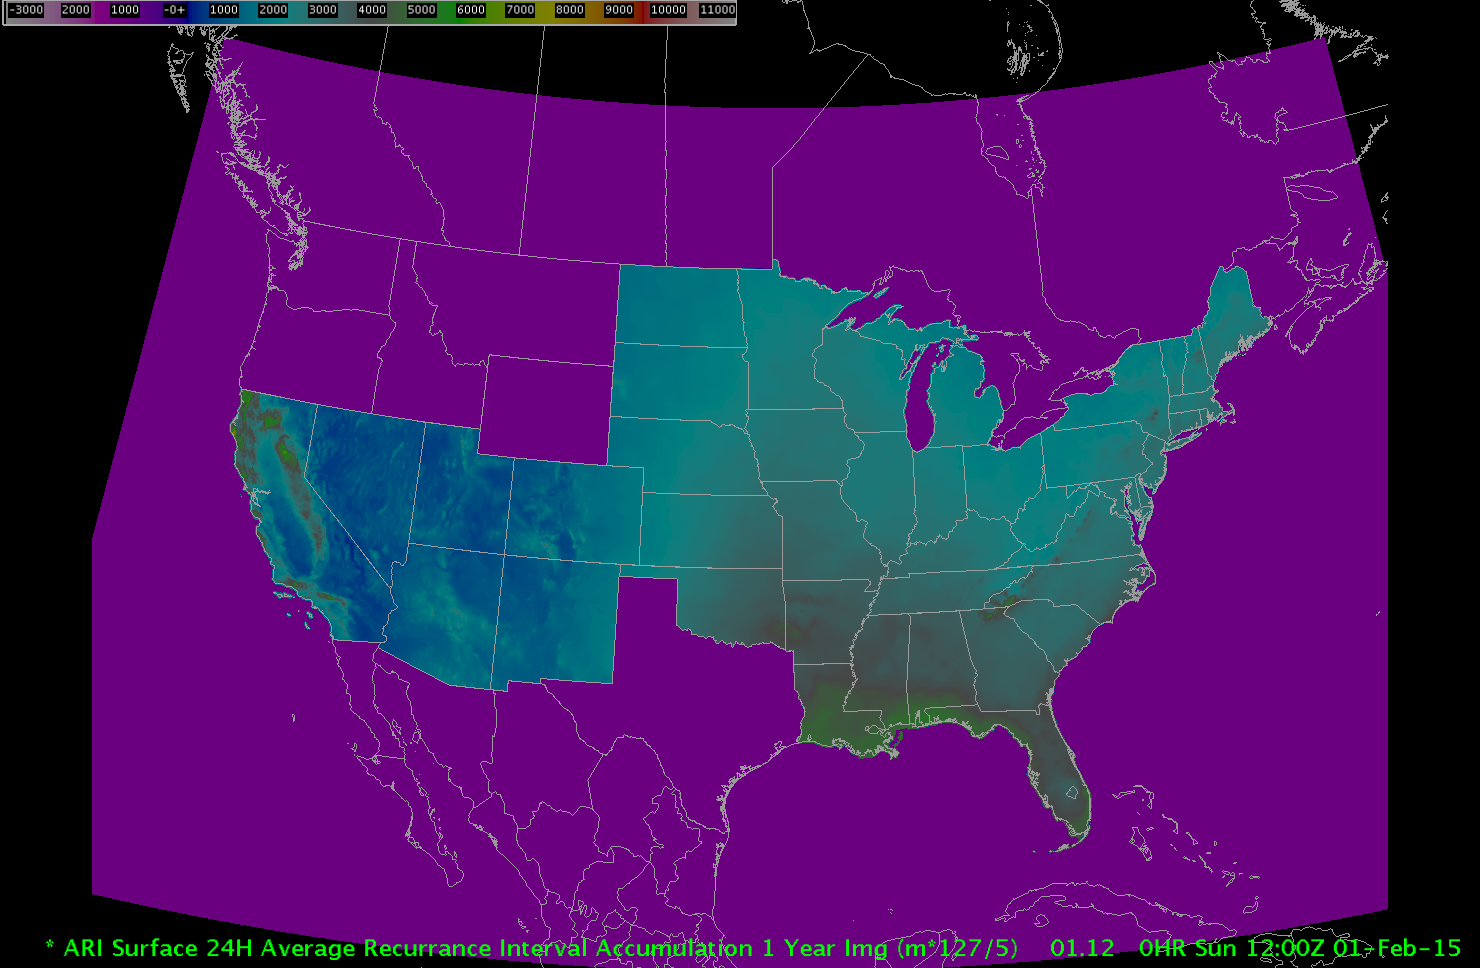
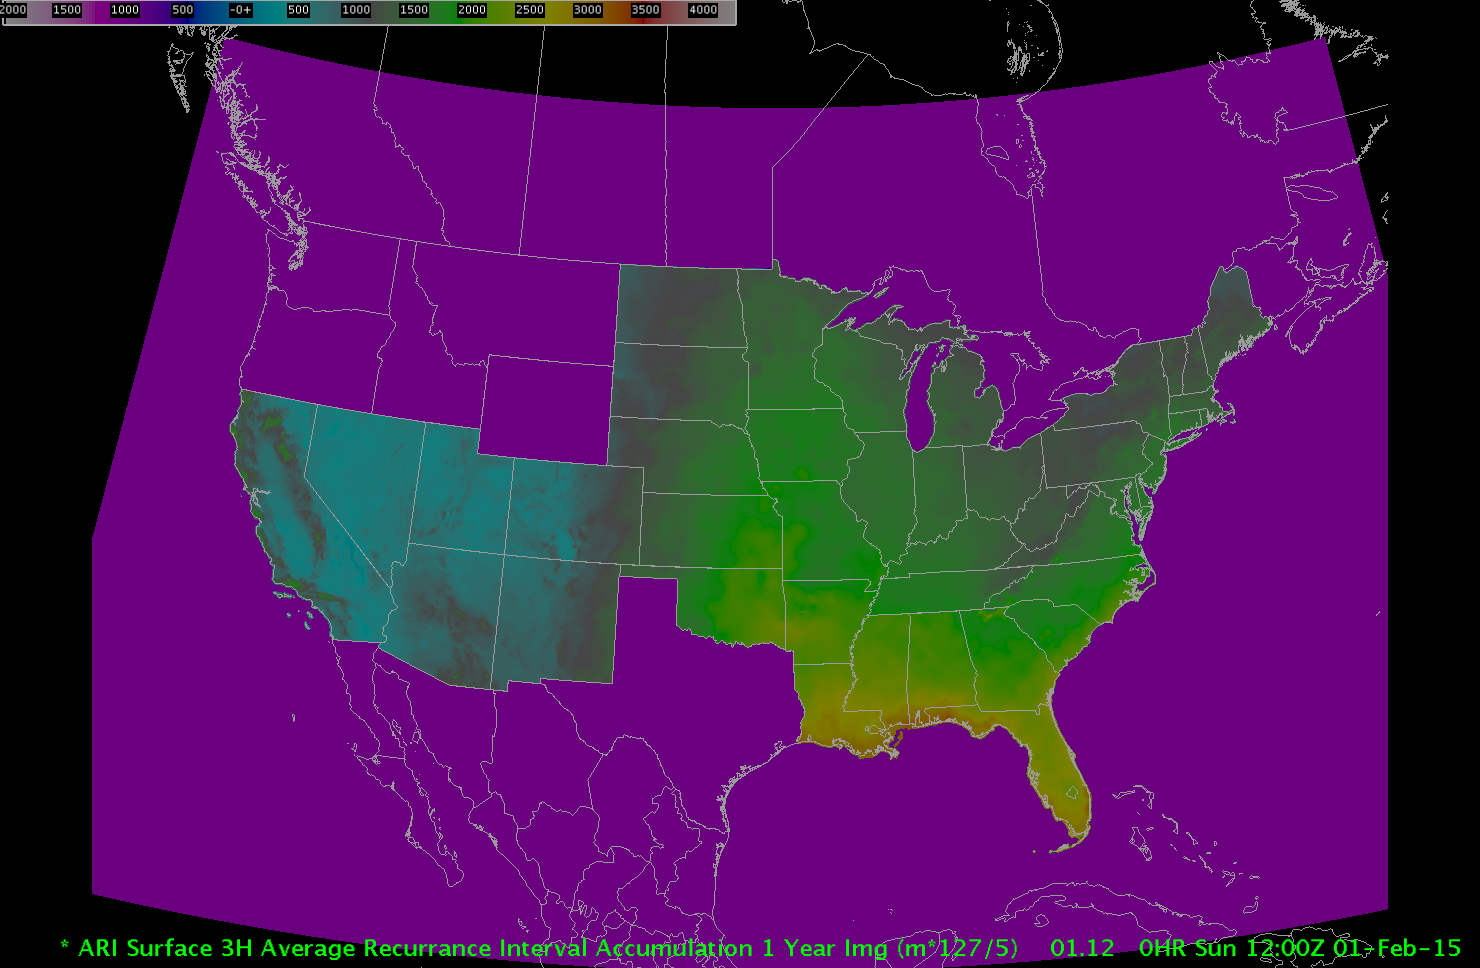
1 Year ( 24 hour, 12 hour, 6 hour, 3 hour, 2 hour, 1 hour, 30 min)