


CAVE Fundamentals
Product Overlays
This lesson provides instructions on loading multiple products into a single display, and it references tasks from previous lessons over loading and editing product displays.
Graphic Products vs. Image Products
When working in the D2D perspective within CAVE, it is important to understand the difference between image products and graphic products. In CAVE, graphics can be converted to images and images can be converted to graphics.
Graphic products
Graphic products are maps containing plotted or contoured data, soundings, or other plotted data. These products can be either observational data or model output products. Graphic products are beneficial for data analysis because multiple graphic products can be loaded into a single display panel and viewed concurrently over image products without masking the underlying data.
Graphic products contain less visual information than image products. Cursor sampling graphics only works for certain point measurements (e.g., surface observations). A single graphic product is displayed as one color, which can sometimes cause legibility issues. For instance, fields in a METAR station plot are all a single color, sometimes impeding interpretation. Further legibility issues can result from small font sizes or contour widths. Changing the panel Magnification and/or Density settings, or changing the product specific parameters (i.e., color, line width, etc.), can help mitigate some legibility issues with graphic product displays.
Image Products
Image products are continuous fields of data represented by color fills. The continuous color fill essentially creates a layer that can totally mask other layers of data underneath. The colors used in the color table can be changed or can be configured to blink, and the values can be sampled by right clicking on the background to select sampling or by configuring the mouse to sample using something like a long left click.
Pairing Combined Images and Product Stacking
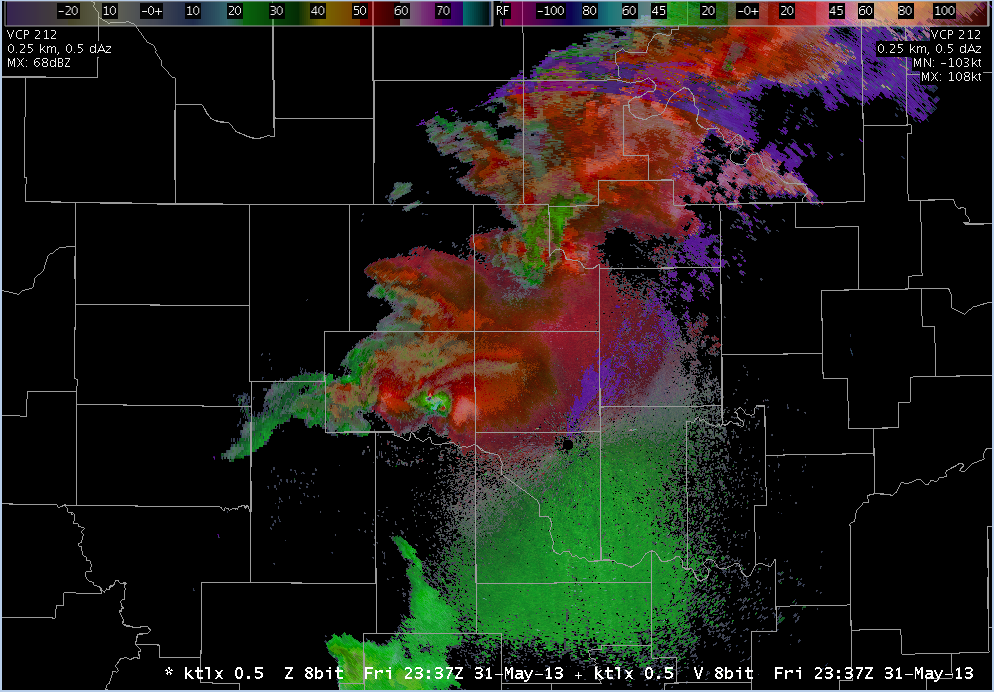
With the Combined Imaging button toggled on, when you load multiple images they are combined into one image where you can fade back and forth between the images using the +/- keys on the keypad or can toggle between images using the . on the keypad (with Num Lock on). The 0.5 Z/V product is a good example of this:
With the Combined Imaging button toggled off, when you load multiple images, they are stacked on top of each other. If they cover the same areas with their continuous color fills, then the top image typically will hide the data underneath unless the alpha channel for that color has been modified in the color table editor. Stacking can still be a viable way of loading multiple image products in an editor, but you will need to toggle the visibility of the image products by clicking on the product legends.
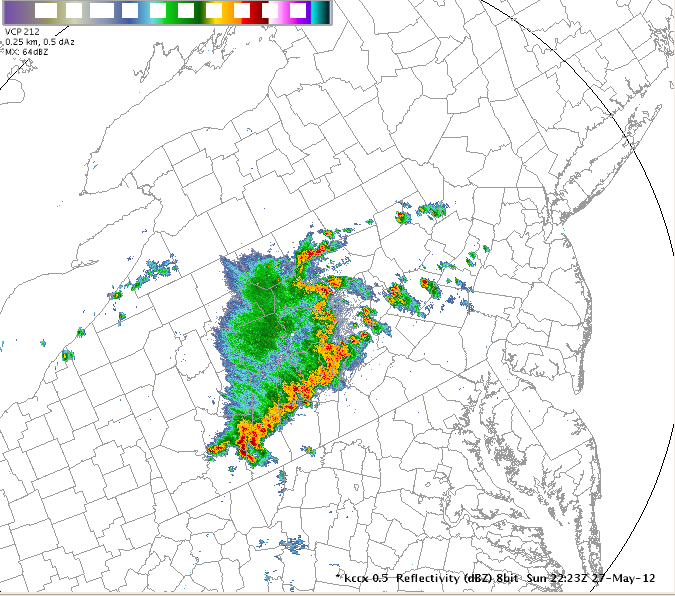
This task demonstrates how to load a radar image on a satellite image and add a model image.
View Jobsheet
Importance of Loading Order
AWIPS operators commonly overlay graphics and image products on a single display panel. The sequential order of how products are loaded into the display panel is crucial to how those products update. The first product loaded into a display, by default, determines the Time Match Basis which is the frequency at which the frames in that display panel will update. This will put a * in the product legend to identify the Time Match Basis.

Once you have multiple products loaded, you can assign the Time Match Basis through a right-click menu on the product legend. It is important to consider the frequency of the products when choosing which product you want to drive the updating as the Time Match Basis.
For instance, if a METAR product is loaded first, then radar data, the hourly METAR data drives the frame contents. Changing the time match basis to the radar data will allow the 5-10 minute resolution radar data to drive the frame contents. Surface observation time matching is unique in that once you load an image over the initial graphic, the time match basis cannot be reassigned to the surface observation.
This task demonstrates how to set the time match basis of a product in order to change which loaded set of data controls the update frequency of all data sets loaded in a current CAVE window.
View Jobsheet
Different Types of Graphic Product Overlays
Graphic products more subtly overlay image products because they typically do not contain the continuous color fills of an image product. Graphic products can vary significantly in their functionality and in their look and feel. In warning operations they generally fall into three categories: radar product overlays, Volume Browser product overlays, and other product overlays.
Radar Product Overlays
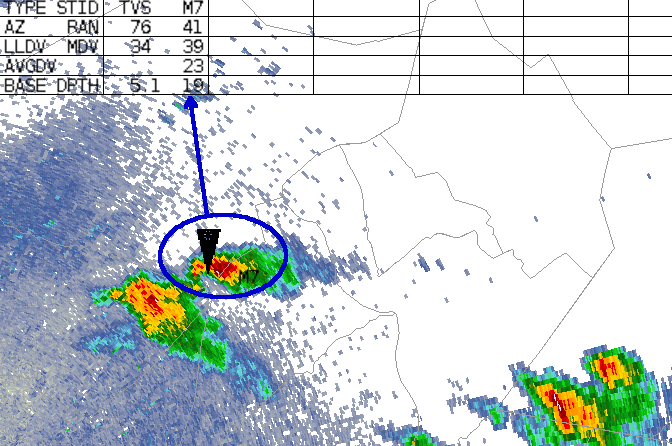
Numerous radar graphic products can be overlaid on radar image products. This includes such products as Storm Track Information (STI), Tornado Vortex Signature (TVS), and Meso Rapid Update (MRU). The number of pages in a particular table will be noted in the product legend at the bottom right of the screen by x/y, where x is the current page being viewed and y is the number of pages in the table. Multiple pages of radar graphic tables are cycled through by middle-mouse clicking on the product legend.
This task demonstrates how to load and toggle a graphic product overlay into a frame after first loading an image product.
View Jobsheet
Volume Browser Product Overlays
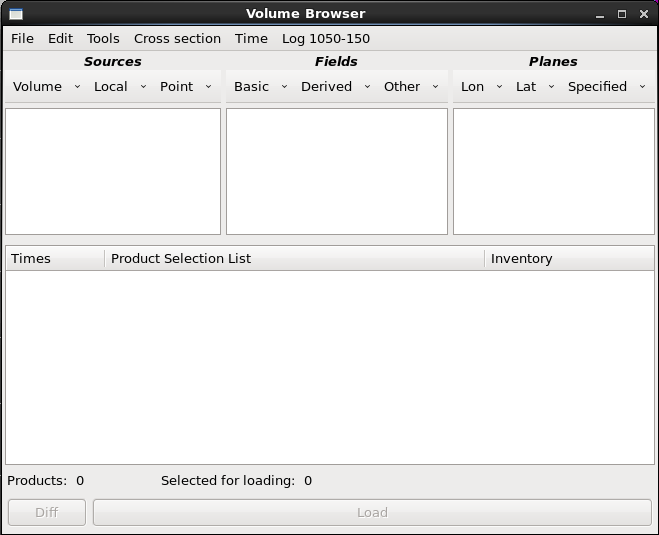
The Volume Browser is a unique tool in the D2D perspective that loads grid data from a user-selected Field (e.g. vorticity), Source (e.g. NAM12), and Plane (500MB pressure). You can load plan view (horizontal), cross sections, time height displays, variable versus height, sounding displays, and time series by selecting the type of display from the simple menus at the top of the Volume Browser window. While many grid data fields can be loaded from the D2D Volume menu Families, the Volume Browser allows you to load specific fields in your coordinate of choice (e.g. temperature, height, pressure, etc.). A detailed description of the Volume Browser and its usage falls outside the scope of this course. However, we will introduce some of the basics of the Volume Browser in the job sheets.
This task will demonstrate how to use the Volume Browser to load a graphic overlay product (e.g., CAPE) in the same display panel as an image product (e.g., base reflectivity).
View Jobsheet
Other Product Overlays
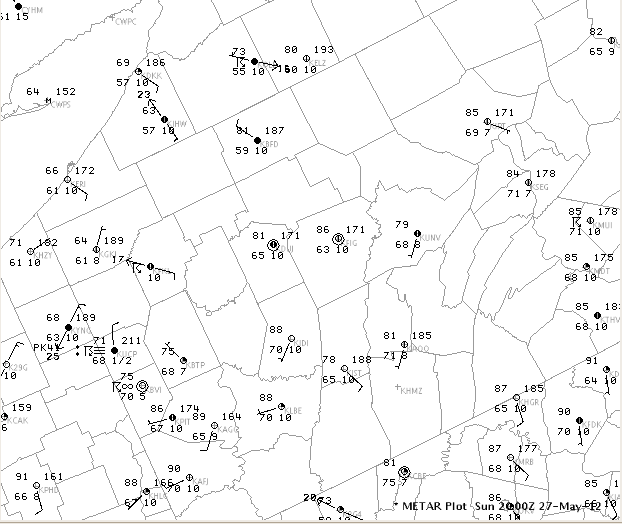
Other AWIPS graphic products such as METAR observations, warning polygons, etc. are useful to overlay on radar image products. These products are mostly located under the Obs or NCEP/Hydro menus in CAVE.
This task demonstrates how to load a graphic overlay (METAR surface observations) in a display panel with an image product (base reflectivity).
View Jobsheet