


PGEN Static Overlay Jobsheet - OCLO
PGEN Static Overlay Jobsheet
Purpose:
Tasks:
- Select Regional scale.
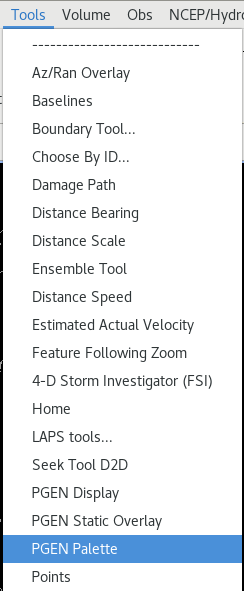
- From the Tools menu in D2D, select PGEN Palette (Fig 1).
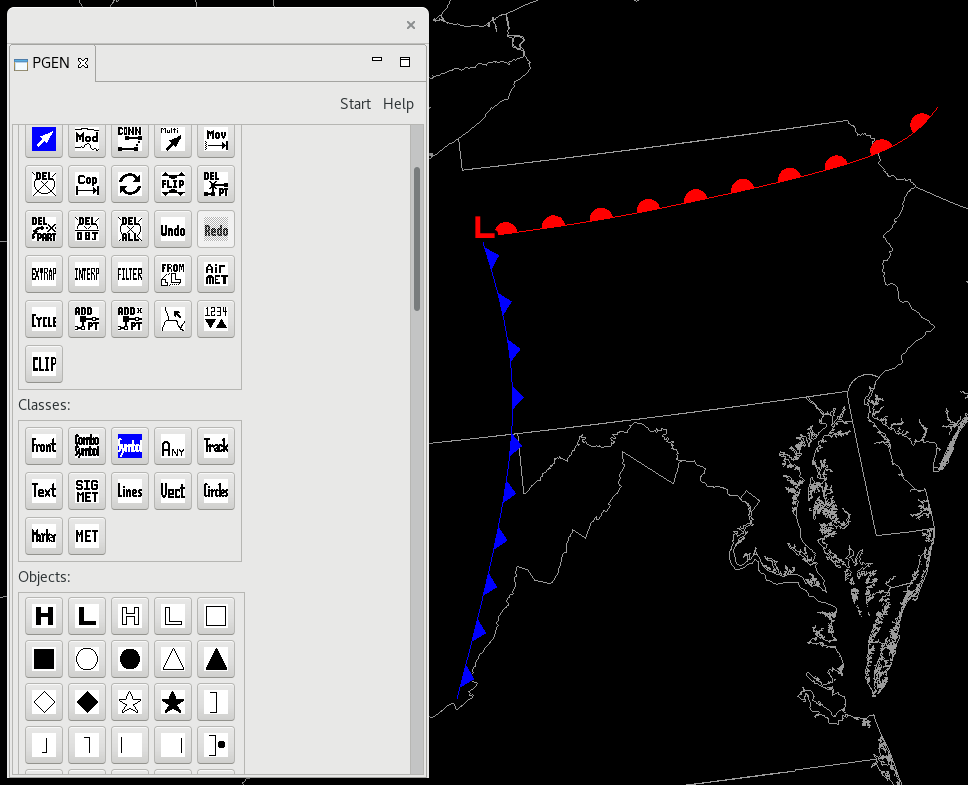
- From the Classes section of the Toolbox, select Front.
- From the Objects section, select the cold front icon.
- Starting in the upper right of the CAVE editor, draw the front by left clicking in the CAVE editor in multiple locations toward the bottom left of the CAVE editor.
- Right click to terminate the front.
- If you are unhappy with your front (or any other objects you insert), you can delete it by selecting the Delete Element icon from the Actions section and double clicking on your front.
- Select a different front icon and draw a second front.
- From the Classes section, select Symbol.
- From the Objects section select the "L", and left click in the CAVE editor to put a low pressure symbol (L) in an appropriate spot (Fig 2).
- You can adjust the size of the symbol by changing the Size value in the Symbol Attributes popup window before you insert the symbol.
- From the Classes section, select the Lines icon.
- Under the Objects section click on the Dotted Line icon.
- Left click in multiple locations in the CAVE editor to draw a closed polygon.
- From the Classes section, select the Text icon.
- Under the Objects section click on the Text icon.
- Type in some text in the Text: window in the Text Attributes popup window.
- Left click in the polygon you just drew to drop in the text.
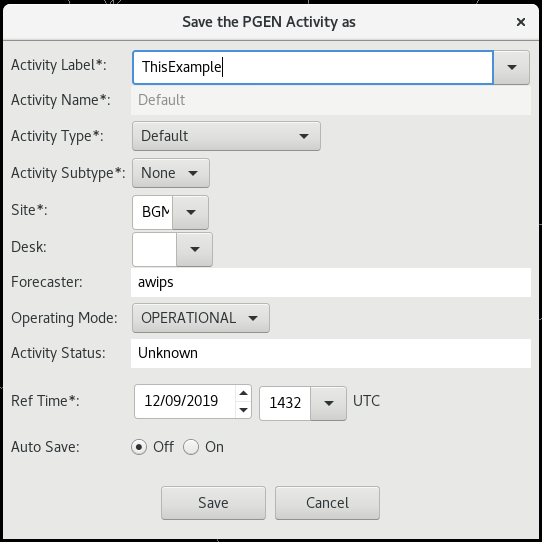
- From the Controls section, click on Save As to save your PGEN graphic. Give it an appropriate name in the Activity Label and click the Save button. (Fig 3).
- Close the PGEN Pallette by clicking on the X in the tab labeled PGEN.
- Load data into the map editor display (in this example we will load satellite data).
- From the Tools Menu, select PGEN Static Overlay.
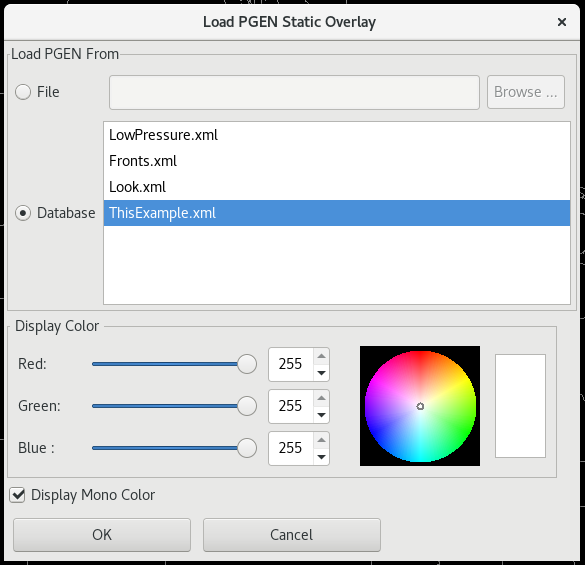
- Click on the Database button then select the name of the PGEN graphic you saved. Uncheck the Display Mono Color button if you want to display the PGEN graphics in color. Click OK (Fig 4).
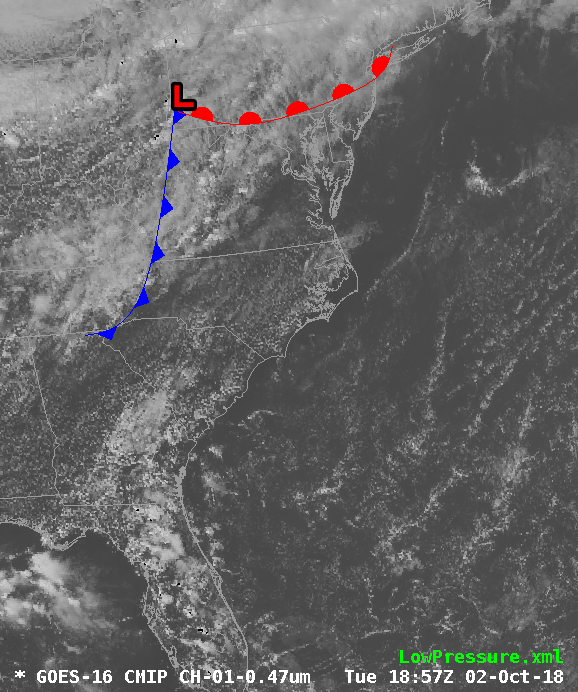
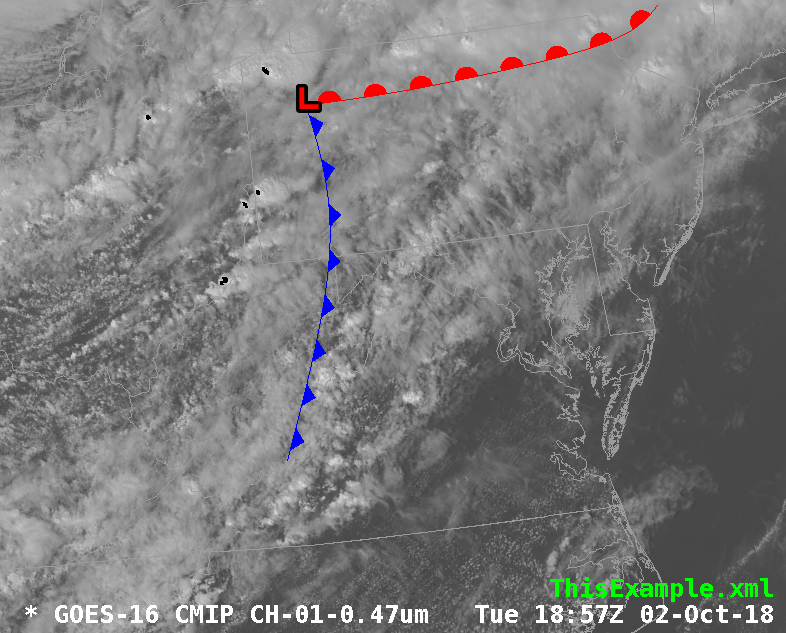
- You should now see the PGEN graphic show up as a product overlaid on top of the previously loaded data. Note that the PGEN file also shows up in the product legend (Fig 5).
- The PGEN display can be saved in a procedure or perspective display. This allows more flexibility in sharing annotations in an operational environment.