


Overlaying a Surface Plot on a Base Reflectivity Product - OCLO
- 01- CAVE Fundamentals
- Setting the Time Match Basis of a Product
- Loading and Toggling Radar Graphic Overlay Products
- Overlaying CAPE on a Base Reflectivity Product
- Overlaying a Surface Plot on a Base Reflectivity Product
- Overlaying Model Image on Radar and Satellite
- Transferring Screen Products Between the Main Display Pane and Side Panes
- Loading, Arranging, Renaming, and Unloading Additional Map Editors
- Zooming In or Out of a Product View
- Panning a Zoomed-In Image in the Main Display Panel
- Switching the Color Table for a Radar Image Product
- Editing the Current Color Table
- Unload a Map Overlay
- Loading a Map Overlay
- Changing a Map's Display Characteristics
- Loading the Alphanumeric Information for a VWP Product
- Using the AFOS Browser to Load an Area Forecast Discussion
- Move and Adjust Width of AlertViz
- Launch Text Section Log and Display Detailed View
- Loading and Using the AWIPS Data Monitor
- Blinking a Range of Data Values
- Printing the Contents of the Main Display Panel
- Creating a Screen Capture of the Main Display Panel
- Saving/Loading Editor and Perspective Displays
- 02- D2D Fundamentals
- Create a New Procedure
- Opening an Existing Procedure
- Load a Product from the Product Inventory
- Clearing a Product from the Main Display Panel
- Manually Toggling and Looping Single Elevation Angle Products in Time
- Create an Image Combination and Toggle Between the Images
- Use Panel Combo Rotate and All Panel Sample on Dual Pol
- 03- D2D Radar
- Load Radar Products for Single Radar and Radar/MRMS Mosaics
- Toggling Product Displays
- Viewing Radar Cursor Readout Information
- Loading Products into Four-Panel Displays
- Submit an OTR for a Three Hour Precip (THP) Product
- Build a New Request in the RMR GUI
- Managing Active Requests in the RMR GUI
- Loading an All Tilts Product into the Main Display Panel
- Load a VWP Hodograph
- Load a Vertical Reflectivity Cross-Section Image Product Using the Volume Browser
- Load a Horizontal Reflectivity Cross-Section Image Product Using the Volume Browser
- 04- D2D Satellite
- 05- D2D Upper Air
- Load NSHARP into your CAVE Display
- Change NSHARP Configurations
- Cycling Through the Tables
- Toggling Display Insets
- Toggling Graphs and Statistics
- Interact with the Inventory in the D2D Skewt Standard Screen Configuration and Use Keyboard Shortcuts
- Configuring a Sounding and Hodograph Display
- Changing the Parcel Lifting Method
- Display Multiple Active Soundings
- 06- D2D Tools
- 07- D2D Applications
- Issue A New Severe Thunderstorm Warning
- Follow Up a Severe Thunderstorm Warning with a Severe Weather Statement
- Loading an FFMP Basin Trend Graph and Downstream Basin Trace
- Assessing QPE, Ratio, and Diff
- Closing the FFMP Table
- Loading the FFMP Basin Table
- Loading a SCAN Storm Cells Table
- Interacting with the SCAN Storm Cells Table
- Launching the MESO and TVS Tables
- Closing the SCAN Cell Table
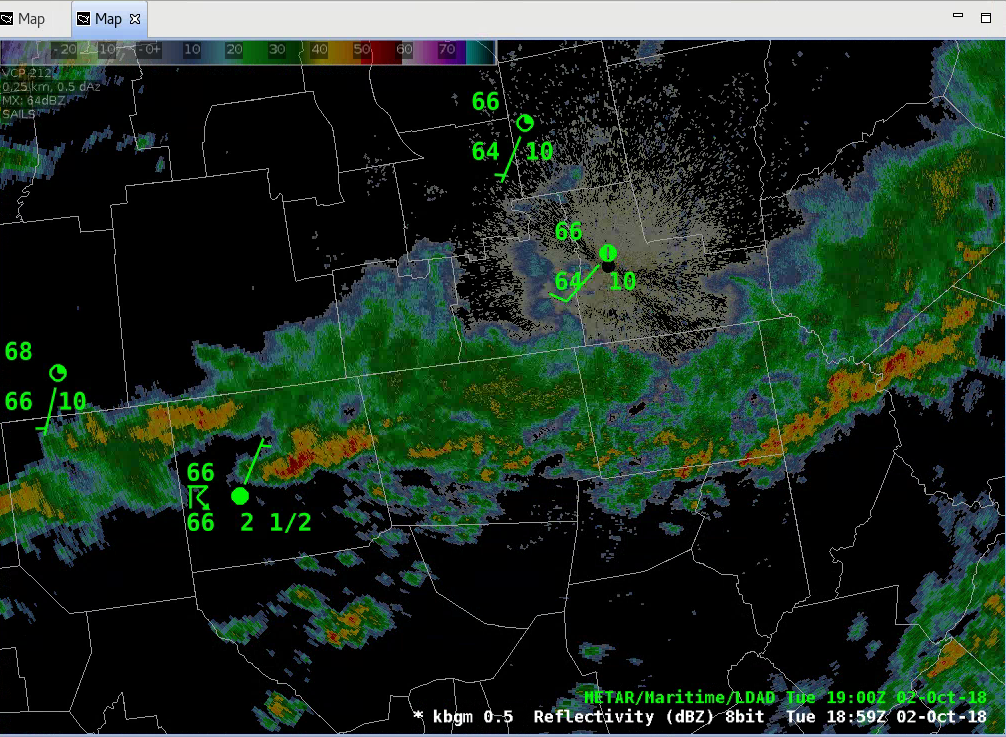
Purpose:
This task demonstrates how to load a graphic overlay (METAR surface observations) in a display panel with an image product (base reflectivity).Tasks:
- From the Radar menu, select 0.5 Reflectivity.
- From the Obs menu, select Surface Plot.
- You may need to reduce the intensity of the radar data by setting the Alpha channel to 50% in the Image Properties window (Ctrl + I).
- Right-click and hold on the METAR text in the product legend and select Magnification.
- In the submenu that appears, select 2.
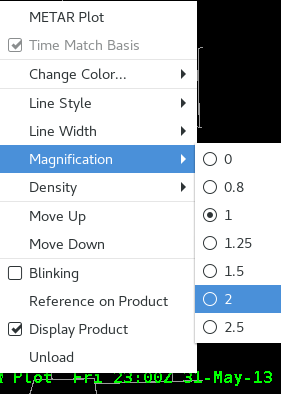
- The size of the station plot should be about twice as big and much more legible.
- The size of the station plot should be about twice as big and much more legible.
- Task Complete!