Interacting with the SCAN Storm Cells Table - OCLO
- 01- CAVE Fundamentals
- Setting the Time Match Basis of a Product
- Loading and Toggling Radar Graphic Overlay Products
- Overlaying CAPE on a Base Reflectivity Product
- Overlaying a Surface Plot on a Base Reflectivity Product
- Overlaying Model Image on Radar and Satellite
- Transferring Screen Products Between the Main Display Pane and Side Panes
- Loading, Arranging, Renaming, and Unloading Additional Map Editors
- Zooming In or Out of a Product View
- Panning a Zoomed-In Image in the Main Display Panel
- Switching the Color Table for a Radar Image Product
- Editing the Current Color Table
- Unload a Map Overlay
- Loading a Map Overlay
- Changing a Map's Display Characteristics
- Loading the Alphanumeric Information for a VWP Product
- Using the AFOS Browser to Load an Area Forecast Discussion
- Move and Adjust Width of AlertViz
- Launch Text Section Log and Display Detailed View
- Loading and Using the AWIPS Data Monitor
- Blinking a Range of Data Values
- Printing the Contents of the Main Display Panel
- Creating a Screen Capture of the Main Display Panel
- Saving/Loading Editor and Perspective Displays
- 02- D2D Fundamentals
- Create a New Procedure
- Opening an Existing Procedure
- Load a Product from the Product Inventory
- Clearing a Product from the Main Display Panel
- Manually Toggling and Looping Single Elevation Angle Products in Time
- Create an Image Combination and Toggle Between the Images
- Use Panel Combo Rotate and All Panel Sample on Dual Pol
- 03- D2D Radar
- Load Radar Products for Single Radar and Radar/MRMS Mosaics
- Toggling Product Displays
- Viewing Radar Cursor Readout Information
- Loading Products into Four-Panel Displays
- Submit an OTR for a Three Hour Precip (THP) Product
- Build a New Request in the RMR GUI
- Managing Active Requests in the RMR GUI
- Loading an All Tilts Product into the Main Display Panel
- Load a VWP Hodograph
- Load a Vertical Reflectivity Cross-Section Image Product Using the Volume Browser
- Load a Horizontal Reflectivity Cross-Section Image Product Using the Volume Browser
- 04- D2D Satellite
- 05- D2D Upper Air
- Load NSHARP into your CAVE Display
- Change NSHARP Configurations
- Cycling Through the Tables
- Toggling Display Insets
- Toggling Graphs and Statistics
- Interact with the Inventory in the D2D Skewt Standard Screen Configuration and Use Keyboard Shortcuts
- Configuring a Sounding and Hodograph Display
- Changing the Parcel Lifting Method
- Display Multiple Active Soundings
- 06- D2D Tools
- 07- D2D Applications
- Issue A New Severe Thunderstorm Warning
- Follow Up a Severe Thunderstorm Warning with a Severe Weather Statement
- Loading an FFMP Basin Trend Graph and Downstream Basin Trace
- Assessing QPE, Ratio, and Diff
- Closing the FFMP Table
- Loading the FFMP Basin Table
- Loading a SCAN Storm Cells Table
- Interacting with the SCAN Storm Cells Table
- Launching the MESO and TVS Tables
- Closing the SCAN Cell Table
Purpose:
This task demonstrates how to interact with the SCAN Storm Cells table, and it requires deep convection and radar algorithm products (best done on WES-2 Bridge)Tasks:
Assumptions:
- The SCAN Storm Cells table has been loaded (see previous Task)
- In the CELL Table, left-click on an attribute containing an algorithm attribute (hSize) with a black background.
- The cells will now be sorted by the numerical value in the column you just selected, and the background behind the attribute title will become purple.
- In the CELL Table, left-click the same attribute that now contains a purple background.
- Selecting the attribute title multiple times will toggle the sorting by highest and lowest value.
- In the CELL Table, left-click on a cell id (e.g. M3) in the ident column.
- The row will highlight blue, and the CAVE editor will zoom in on the cell icon display containing a hexagon.
- In the CELL Table, right-click on the same cell id.
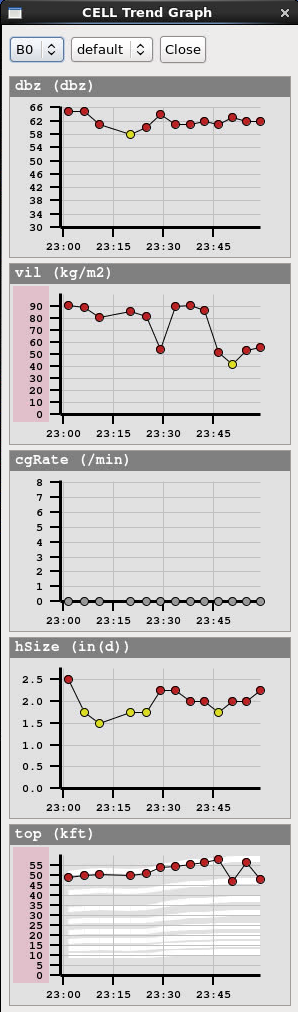
- A trend set of algorithm detections for this cell will display in a CELL Trend Graph window. If the values are particularly high, the y-axis will expand and highlight red.
- The trend sets can be configurable through the Configurations Trend Sets menu in the CELL Table.
- In the CELL Trend Graph, left-click on the Close button.
- The Cell Trend Graph window should close.
- In the CELL Table, left-click on a numerical value in the dbzHt column (e.g. 15.50) for one of the storm cells.
- The Cell Trend Graph for the dbzHt (height of maximum reflectivity) for that algorithm “ident” should display.
- For the height values given SCAN shades the beam height as white swaths, so you can see the gaps between beam centerlines, and the impact it can have on the height detection.
- Task Complete!