Purpose:
Track cloud-top temperatures and load additional meteograms
Tasks:
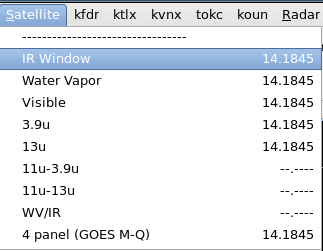
- Load an IR Window satellite product from the Satellite menu
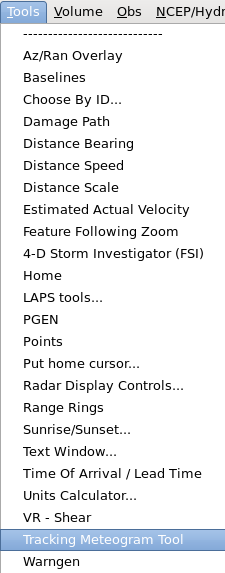
- Zoom in to the cloud top you want to track, and step through the sequence using the arrow keys on the keyboard and skip to the last frame. From the Tools menu, load the Tracking Meteogram Tool.
- A Drag Me To Feature icon will appear.
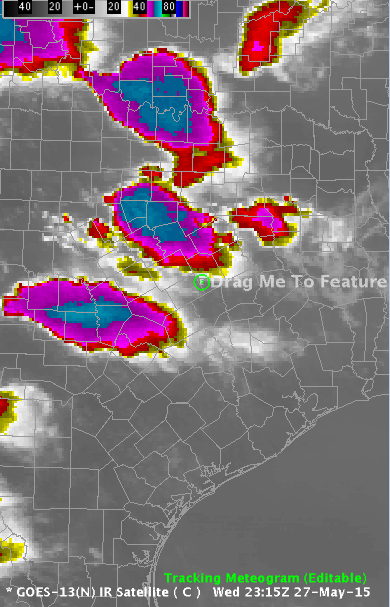
- Move the Drag Me To Feature Icon to the cold cloud tops by left clicking inside the circle and dragging it.
- Enlarge the circle with your mouse by hovering over it and using the scroll wheel to approximately match the size of the cloud top you wish to track. Do not make the circle excessively large as that could lead to undersampling of data. Prior to 16.1.2 the radius inside the circle will sample the data 10 times, which may not be enough to capture your peak values.
- TIP: The Tracking Meteogram will linearly interpolate the position and size of the circles when you move/resize them. To avoid having to deal with circles fanning out in size from the current frame, always start on the last (most current) frame and make the initial move to the feature you wish to investigate from this last frame.
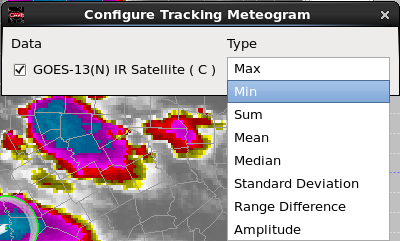
- Right click and hold inside the current frame (green) circle and select Configure Meteogram.
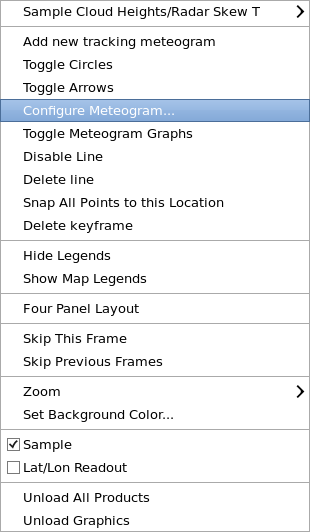
- By default, the Tracking Meteogram will calculate and display the Max value inside a tracking circle. Since we are trying to track the coldest cloud top temperatures, we need to change the calculation to minimum by selecting Min from the pulldown menu under Type.
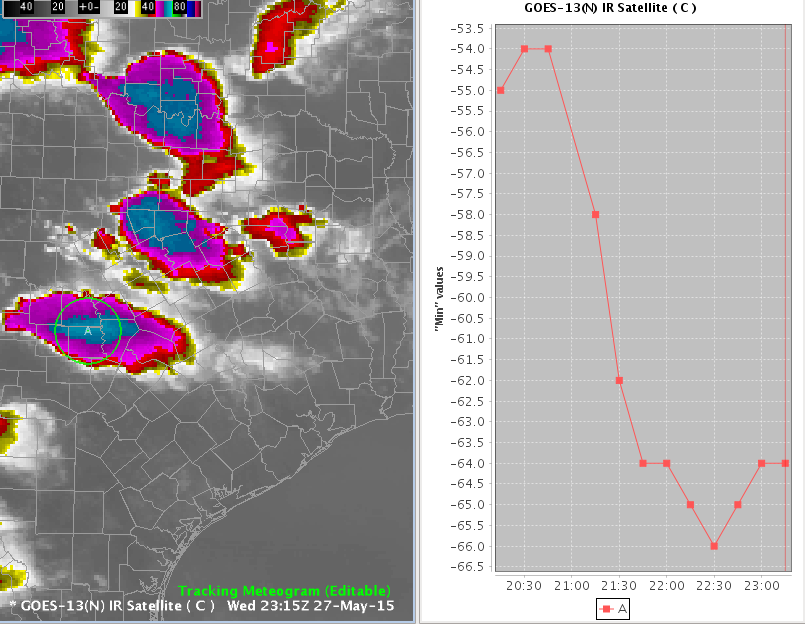
- Right click and hold inside the current frame and select Toggle Circles. This action removes all circles except the current frame. The result is a cleaner display.

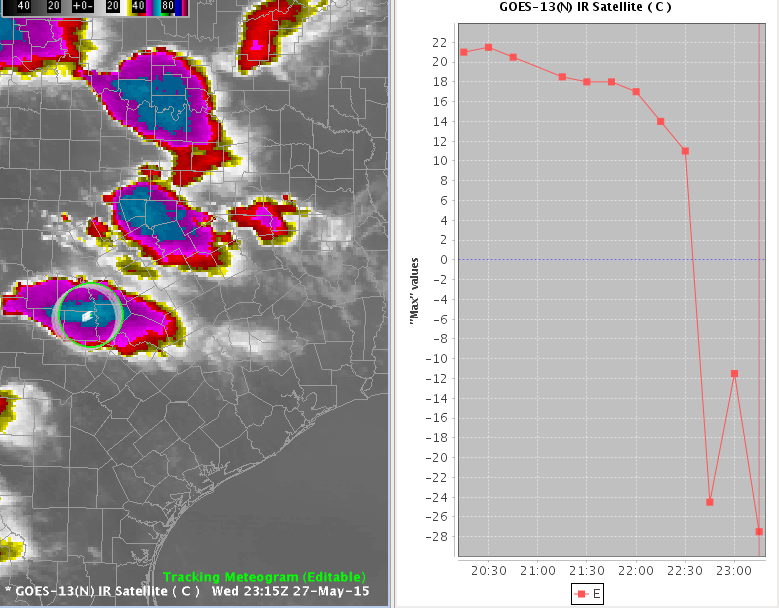
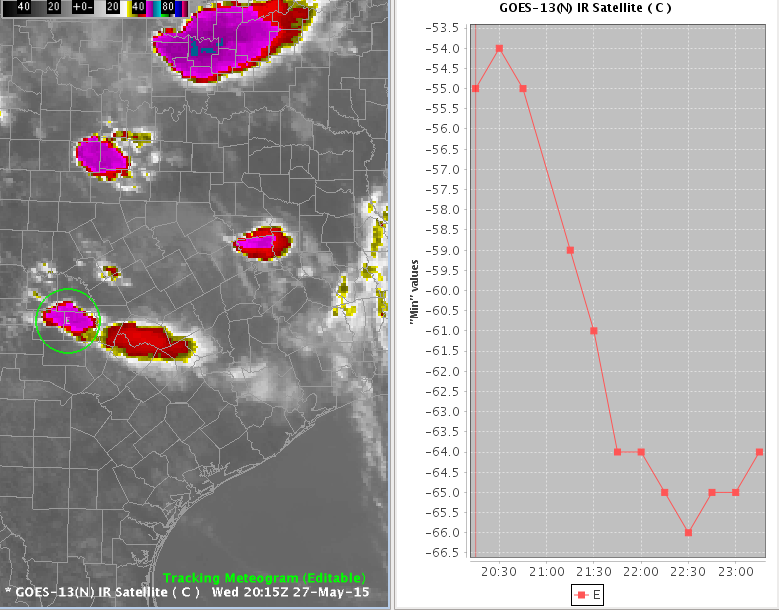
- The image below is the result of configuring the Meteogram to Min and toggling off the circles.
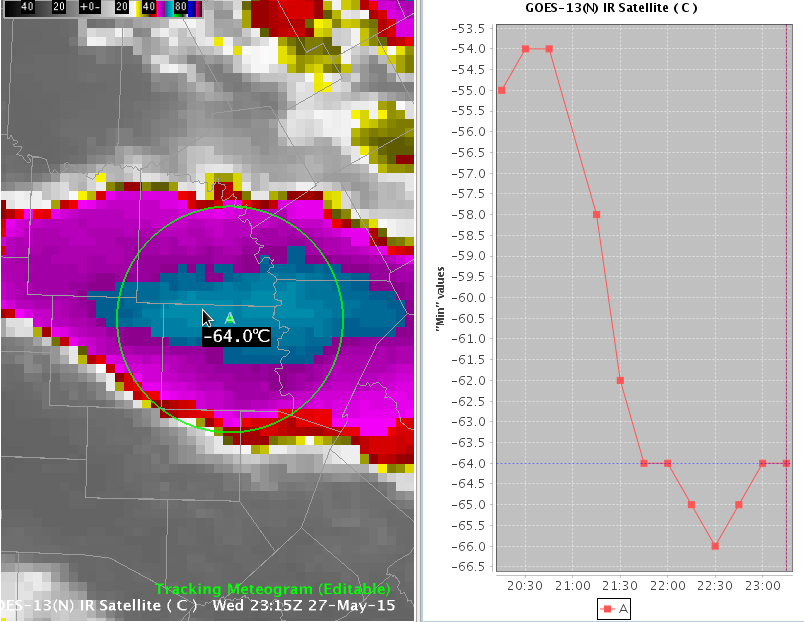
- Zoom in to the coldest cloud top and sample the cloud top temperatures with the mouse cursor and compare it to the Tracking Meteogram output. Change the magnification in the CAVE toolbar to a larger value, like 2.5, to be able to better read the sampled value and the ID letter at the center of the circle that corresponds to the line label in the graph (e.g. A). The values should match or be very close. Use the vertical red line on the plot to identify the current frame of data. Click on the line of the data plot where it intersects the vertical red line to create the dotted horizontal blue line to aid in readout of data. If the values are significantly different, try reducing the size of your circle to prevent undersampling.
- TIP: After interacting with the plot, you need to left-click back in the map editor to activate the toggle capability of the mouse keyboard and so you can use the arrows to step through frames.
- Click on the editor, and zoom back out. Step back to the first frame and move that frame’s circle to the location of the feature. This will trigger a good interpolation of circle positions at intervening frames. Step through each frame to make sure the circle captures the cloud top minimum temperatures. Adjust each circle position and resize accordingly to make sure that the minima is resolved
- TIP: The Tracking Meteogram uses linear interpolation to adjust the size and position of circles of neighboring circles after user manipulation. Therefore it is suggested to reposition more frequently than resize, as resizing could have an unwanted impact on other circles in the sequence.
- Analyze your meteogram. In the graph above we can see the cloud top temperature minimum values significantly cooling from around -55C at 2015z to -66C at 22:30z as the storm deepens and intensifies
- To being the process of overlaying another storm’s cloud top temperature on the graph, zoom out and find another storm to analyze. Then right click and hold in the map editor display and select Add new tracking meteogram.
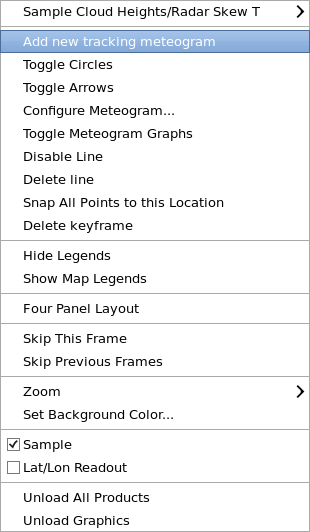
- An additional Drag Me To Feature icon will appear.
- Repeat the tracking steps on a new storm. You will not have to Toggle Circles or make the Min Configuration again because that only needs to be done once to the first Meteogram and will be inherited on any additional Meteograms in this editor. If you mess up and wish to start over, you can always right click inside the Tracking Meteogram circle you wish to delete and select Disable Line
Steps to add another meteogram:
- Zoom in on a feature on last frame with the Tracking Meteogram Tool loaded and right click in the editor and select Add new tracking meteogram.
- Move circle (left mouse drag) to a feature and then resize (scroll wheel over the circle).
- Sample data and compare to graph noting vertical red line position for current frame.
- Note meteograms will inherit Type configured (e.g. Min), so you won’t have to change this. If you want to change the Min calculation on the current Tracking Meteogram you can right click on the editor and select Configure Meteogram to change Type.
- Click on the editor and step back in the loop and recenter/resize as needed.
- Interrogate the meteogram.
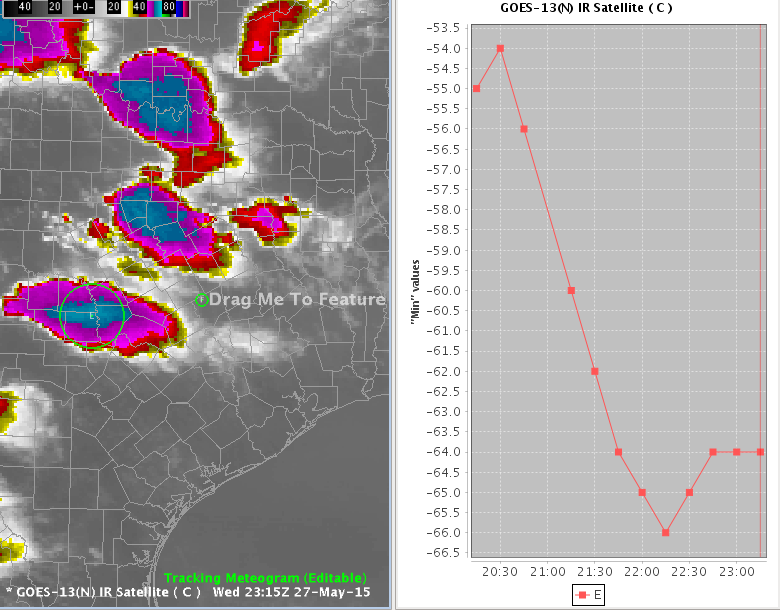
- The final display should look something like this:
In the above image, note the lines E and F in the graph correspond to the letters at the center of the circles in the D2D editor. In this example, both storms display a trend toward colder cloud-top temperatures. Thus, they are getting stronger.


