


Rain Rate Classification Product - OCLO
Rain Rate Classification (RRC) Product
Purpose:
This jobsheet covers the new Rain Rate Classification (RRC) product display in 23.2.1 AWIPS.Tasks:
RPG Build 21 produces a new Rain Rate Classification (RRC) algorithm which is extremely helpful for understanding the rain rate relationships driving Dual Polarization QPE. AWIPS Build 23.2.1 will ingest and display the new RRC product. The RRC has been added to the national RPS list (RPGOP configuration files for storm and clear-air categories in the /awips2/rcm/data/config/drop-ins folder on dv1), so RRC will automatically show up after installing AWIPS 23.2.1.
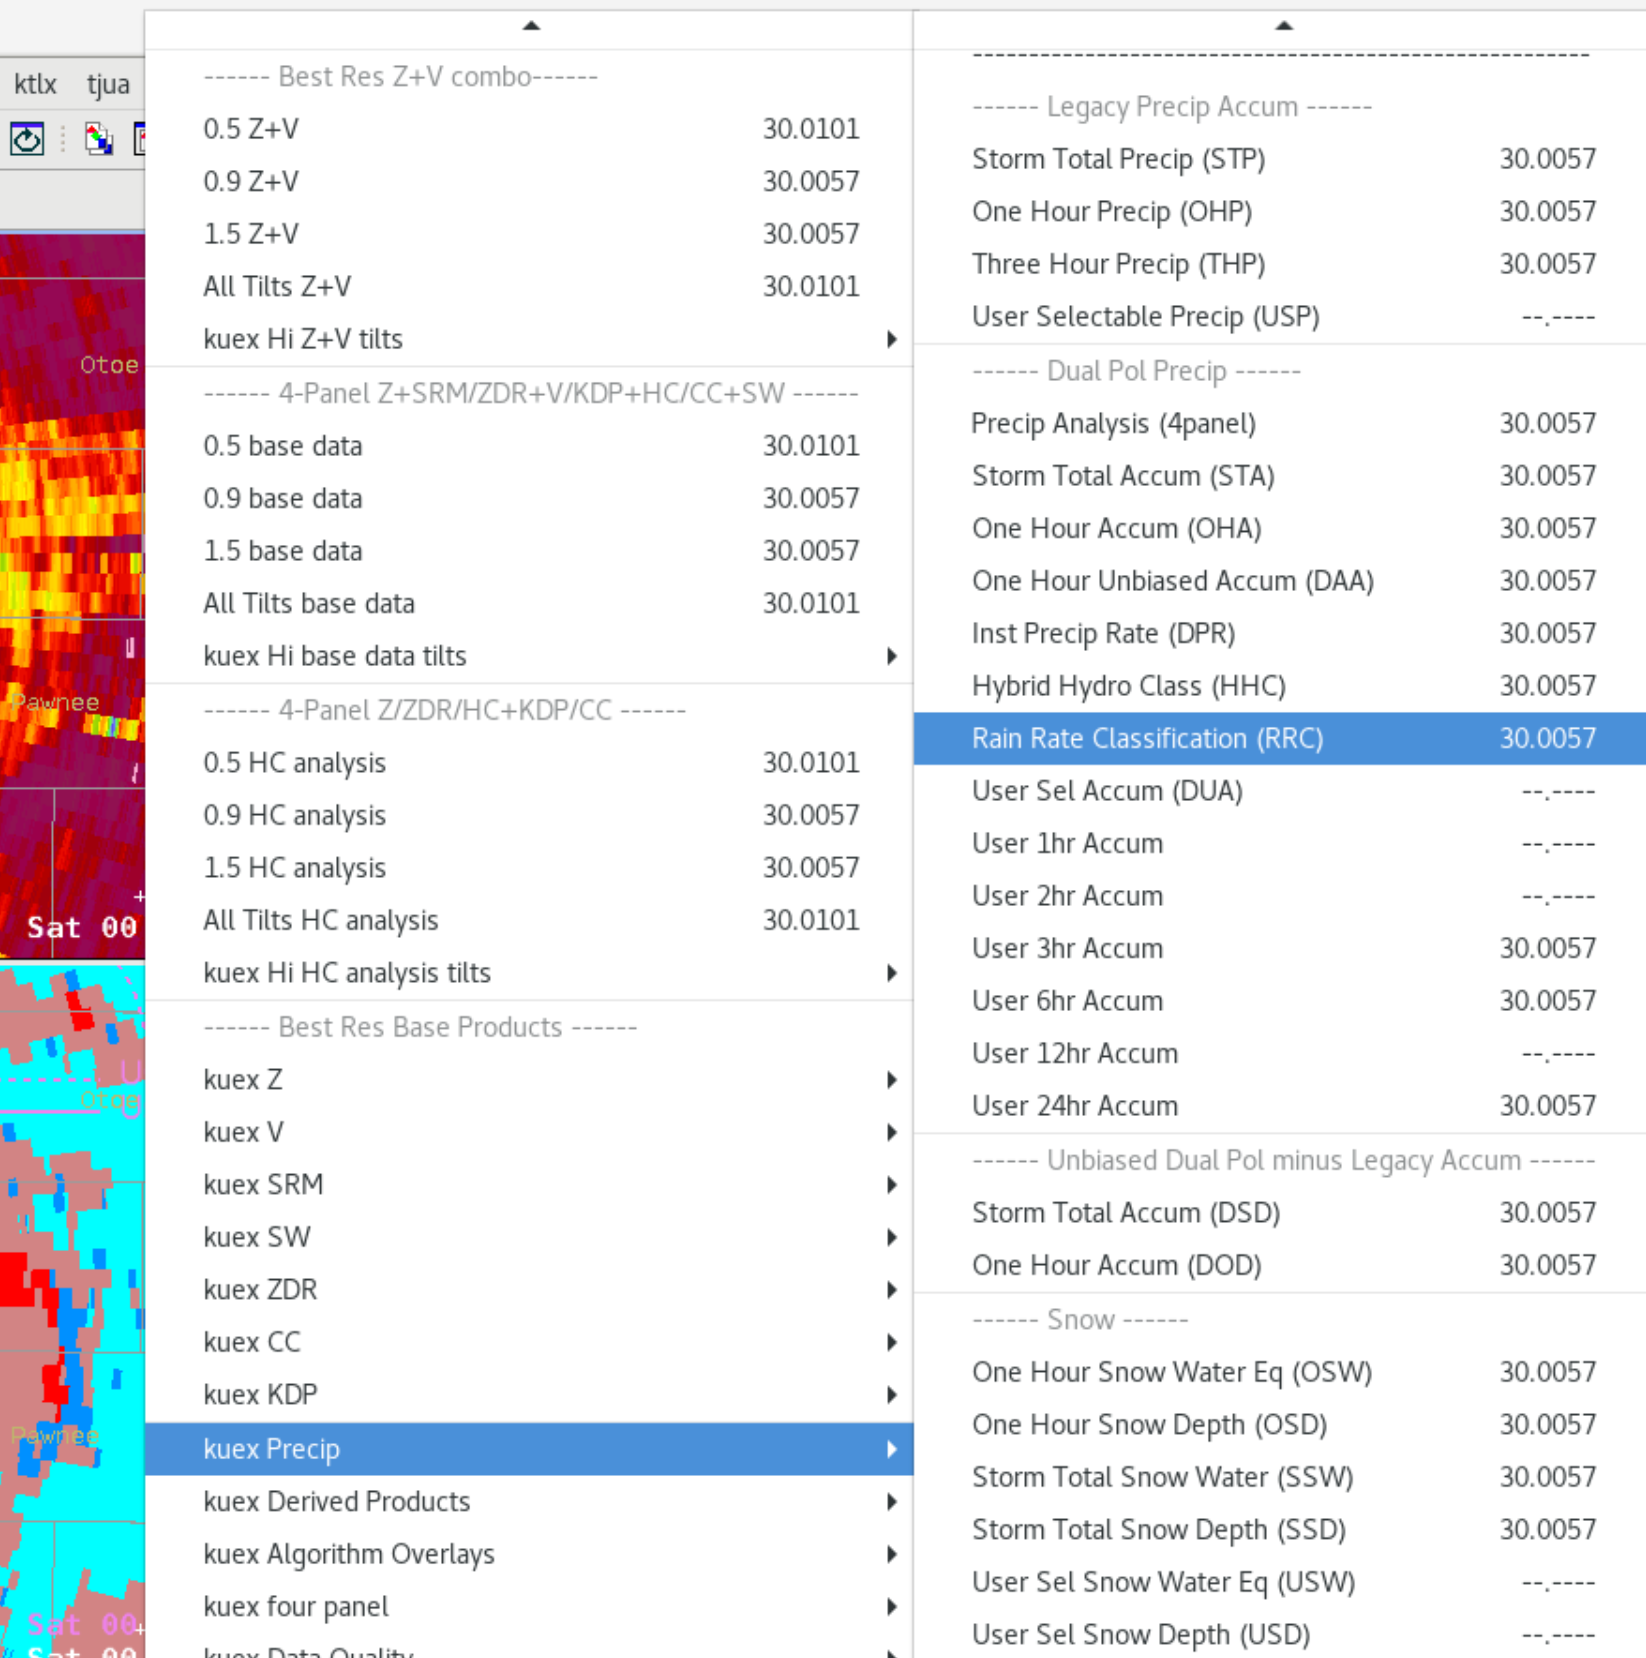
- To load the RRC, navigate through the Precip menu for your local radar:
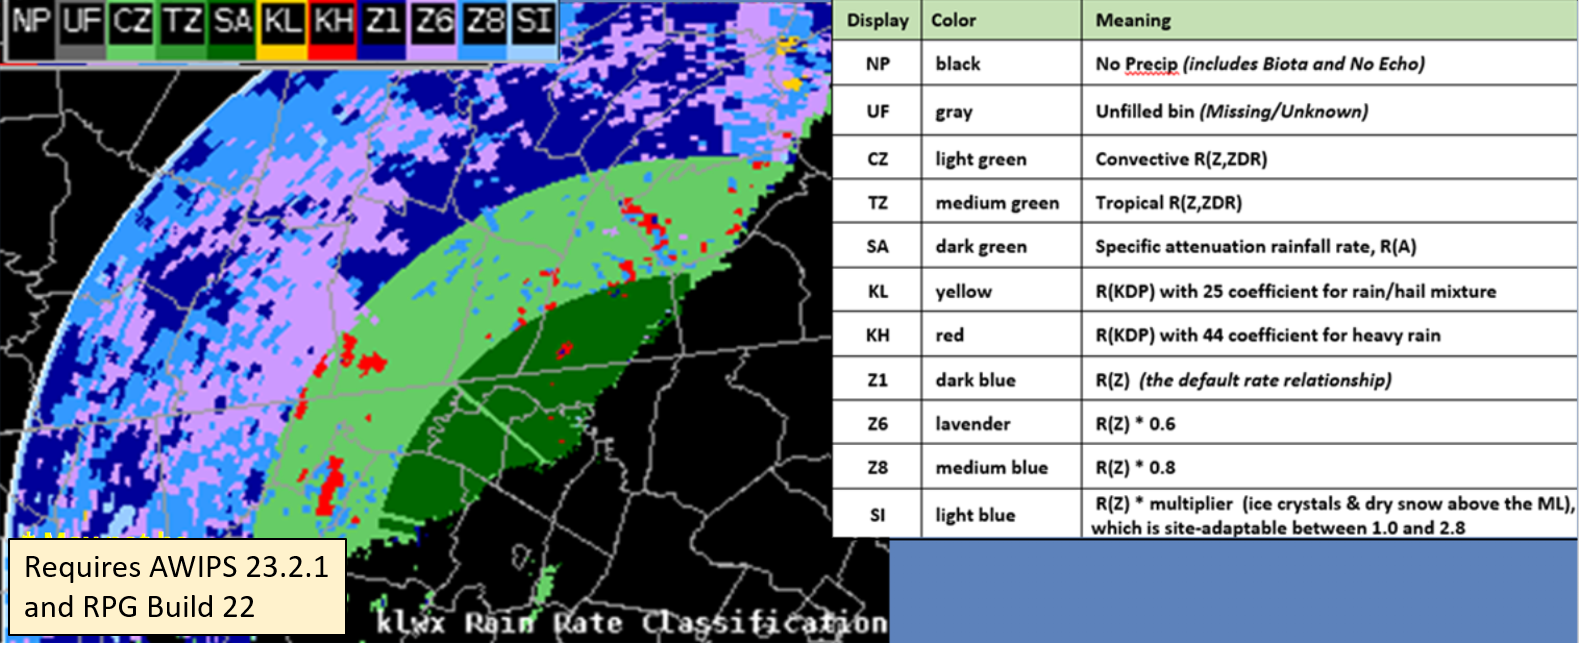
- Here is a table describing the unique rain rate relationships. For heavy rainfall, note the new superior specific attenuation is going to be driving a lot of close range precipitation estimates, and we can now see the heavy rain KDP-driven rates and with both high and low coefficients. The lower coefficient for the rain/hail mixtures is supposed to cut down on melting hail bias with very high KDP values (generally > 4 deg/km).
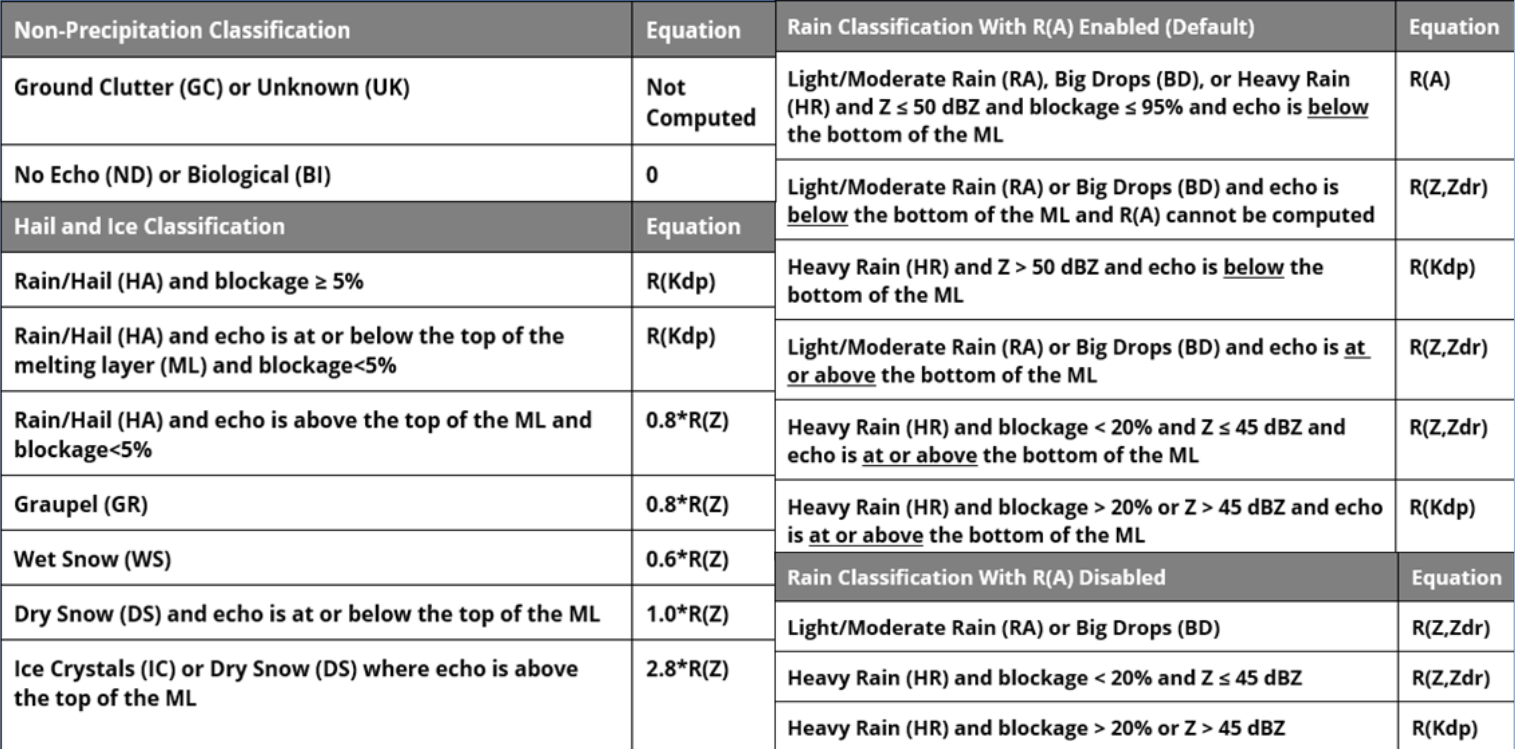
- As you can see from the above image, today's default Dual Pol precip algorithm varies substantially according to the details of the melting layer (ML) and the intensity of the precipitation with sharp changes as a function of range (beam height).
- Close Range Below the Melting Layer: Specific Attenuation dominates the rates for light/moderate rain. Have highest confidence in these estimates.
- Moderate Range below the Melting Layer: ZDR dominates the rates for light/moderate rain or heavy rain with lighter reflectivities. Have lower confidence in these estimates than SA and KDP.
- Heavy Rain and High Reflectivity Below the Melting Layer: KDP equations dominate heavy rain and hail at close and moderate ranges using different coefficients that try to limit the unique impact of melting hail signatures. Have higher confidence in these estimates.
- Far Range Within and Above the Melting Layer: Dual Pol variables are not used within and above certain parts of the melting layer and a suite of reflectivity relationships are used, some of which are reduced by 20% or 40% and others that are unreduced (the ole 4.09"/hr is still alive and kicking for high Z in Z1!). Have lowest confidence in these estimates.
- Here is a summary of the different rain rate equations and their thresholds:
- While at first glance this may look complex, the RRC actually makes it very easy to help the forecaster quickly identify what is driving significant accumulations in the Dual Pol algorithm and whether you are going to believe anomalous features.
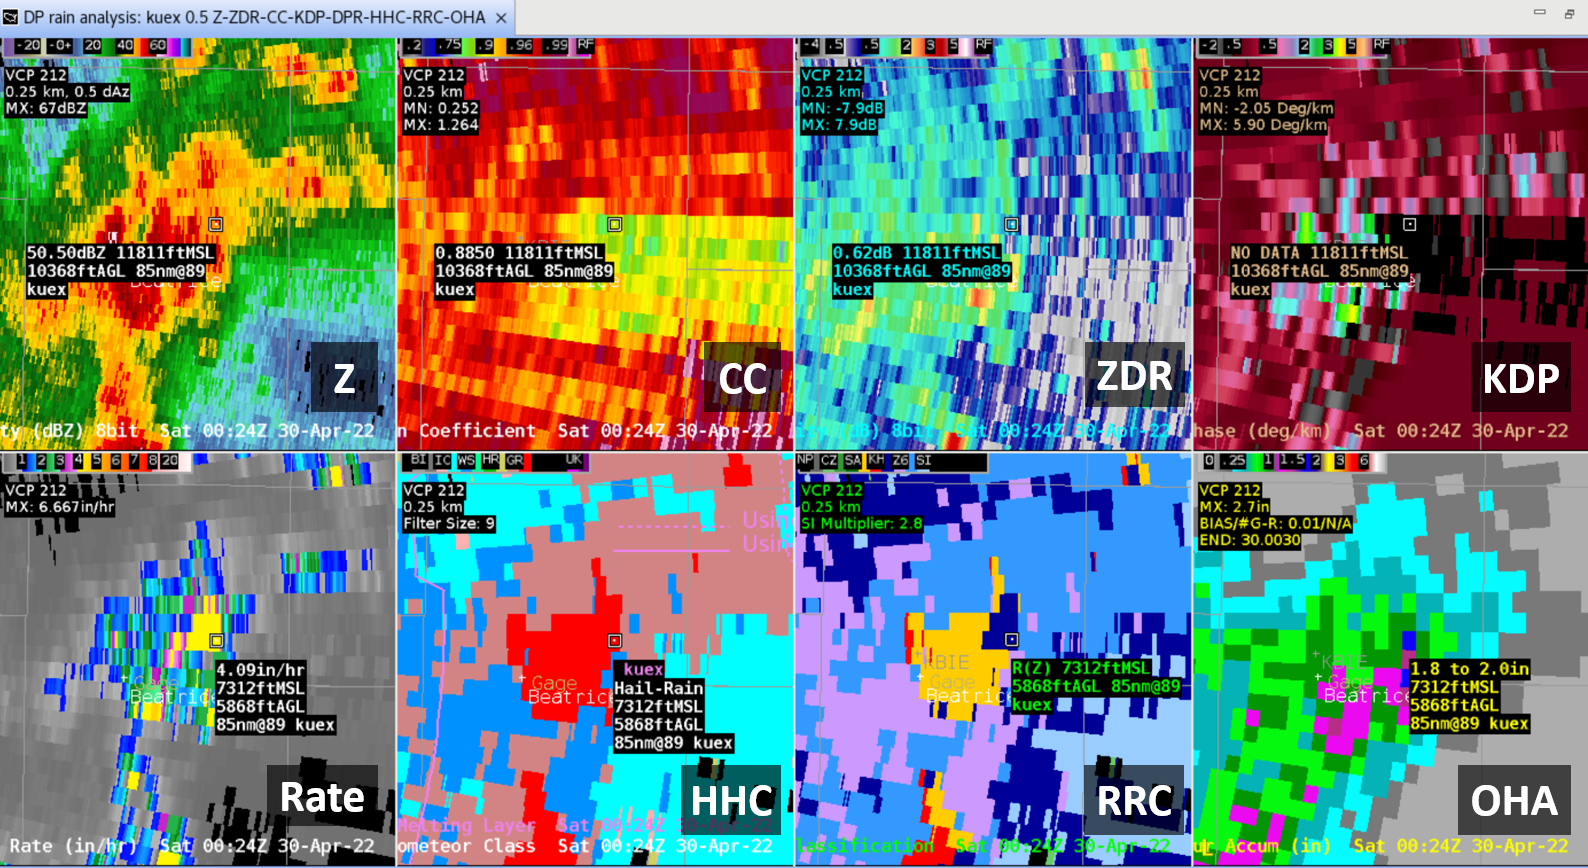
- Take this example of a convective situation where the peak one hour rainfall is 1.8"-2" pretty far from the radar at 85nm and around 10,400ftAGL which is above the ML for the beam center. Looping through the Dual Pol data shows the peak accumulations are in an area with anomalous precipitation rates of 4.09"/hr. The RRC shows many of the anomalous rate areas are occupied by the unreduced R(Z) relationship and is not using the Dual Pol data. The KDP data shows very low CC in this area with dropouts in KDP due to non-uniform beam filling as the top of the beam is entering the freezing level which is at 11,800ft. Instead of accumulations closer to 2" in an hour, the accumulations are more likely to be a little less, like 1-1.5" in an hour which is closer to what MRMS suggested in this case (1.5"-1.75" not shown).
- While rain gauge observations don't exist in the peak rainfall areas for this case, there were a number of Weather Underground stations in Beatrice that showed peak instantaneous rain rates generally 1-3"/hr and not the 4"/hr prominently featured in the Dual Pol data.
- The key to effectively using RRC to interrogate heavy rainfall is to zero in on significant accumulations or range-dependent anomalies and look for patterns of anomalous rates that are relatively large and have consistency to identify potential bias in your precip estimates. Identifying the different precipitation rates and rain rate class over the duration of significant precipitation accumulations can give you an idea of what is driving the Dual Pol rainfall and whether they are based on quality Dual Pol data beneath the ML where Dual Pol data excels. Have more confidence in the following relationships:
- Specific Attenuation - highest confidence
- KDP - higher confidence
- ZDR - lesser confidence
- Z - lowest confidence
- For a loop of RRC during this severe weather event, click on this video (Internet only).
- MRMS has a product similar to RRC available on their Development website (OPS->RQI/RAQI/Precip Flags->DP Rate Flag) available from NOAA networks:
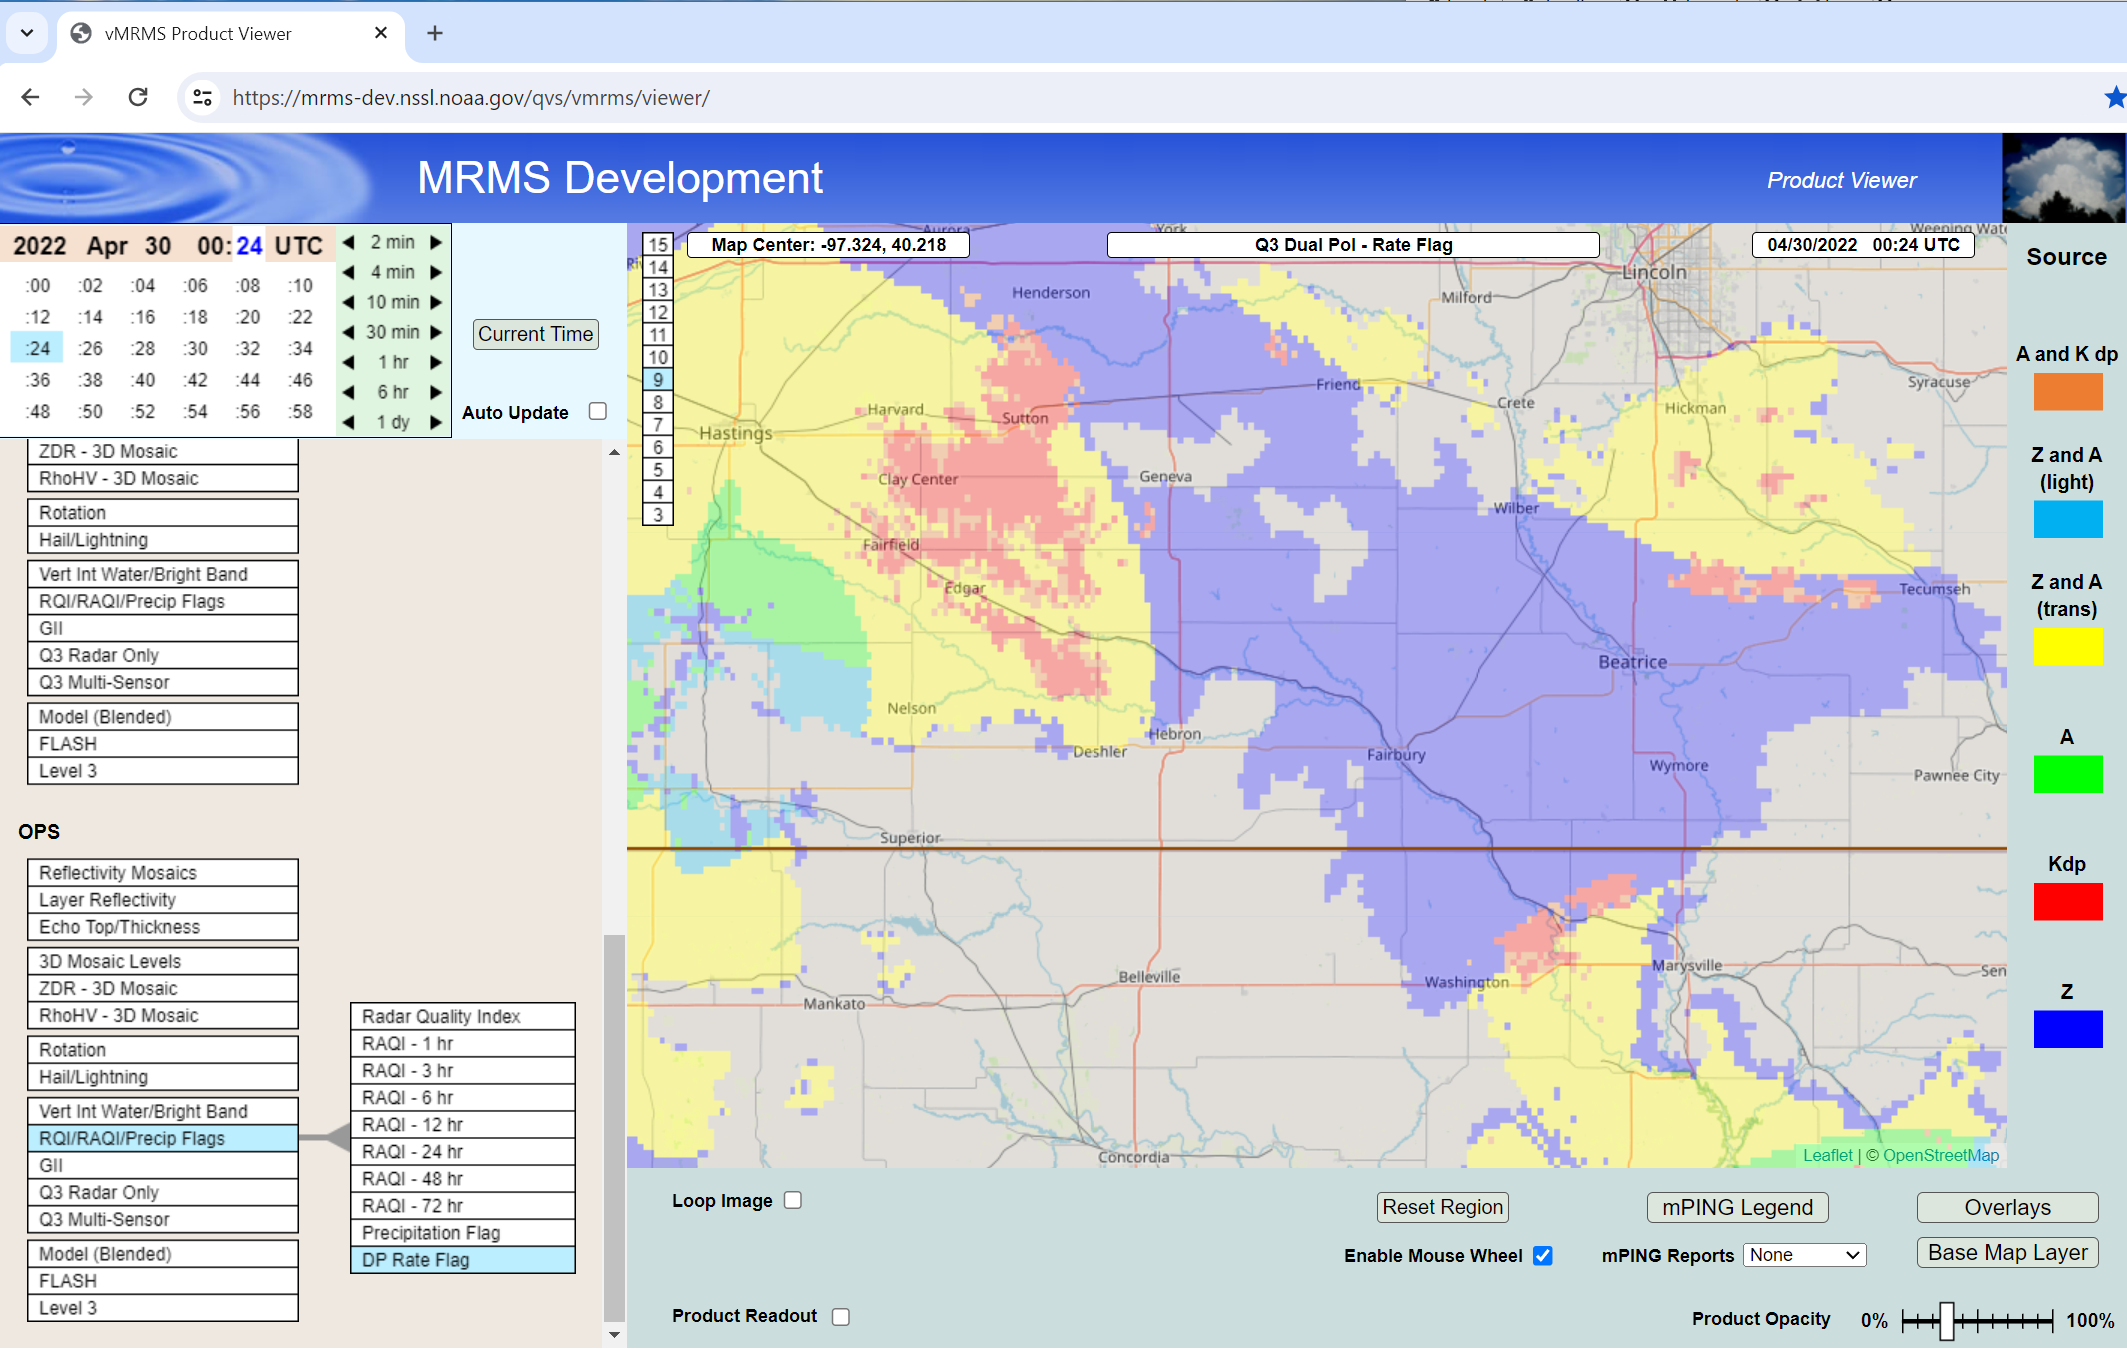
- The image above shows a Z-based rate equation for MRMS over Beatrice for the same time as in step 6, and the following image shows more widespread MRMS 3-4.5" instantaneous rate estimates over Beatrice indicating both Dual Pol QPE and MRMS were probably a bit too high at these far ranges from the radar where Z equations are used:

- For a comprehensive overview of comparing Dual Pol QPE and MRMS QPE, see the Overview of Precipitation Sources in AWIPS. For more related flash flood training, see the Flash Flood section of RAC.
- End of jobsheet.