NSHARP Hail and Tornado Reference - OCLO
NSHARP Hail and Tornado Parameters
This page is designed to identify where some of the newer hail and tornado parameters and tools in NSHARP are located and a little background on what the parameters are.To see these parameters, you must load an NSHARP sounding using the SPC Wide Screen Configuration (Configure->Display Pane Configuration->SPC Wide Screen Configuration).
Hail
Significant Hail Parameter (SHIP)
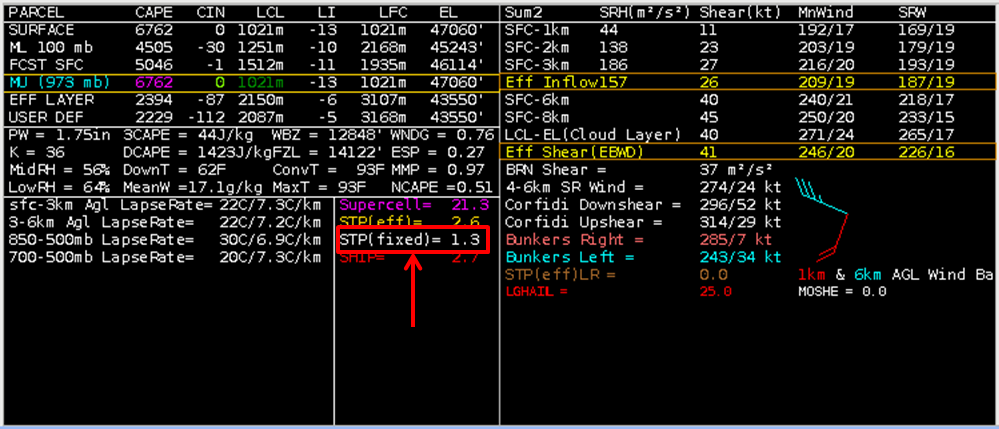
The SHIP values are visible from the bottom of the main data tables that are cycled through with the PvDt and NxDt buttons in the main NSHARP buttons control.
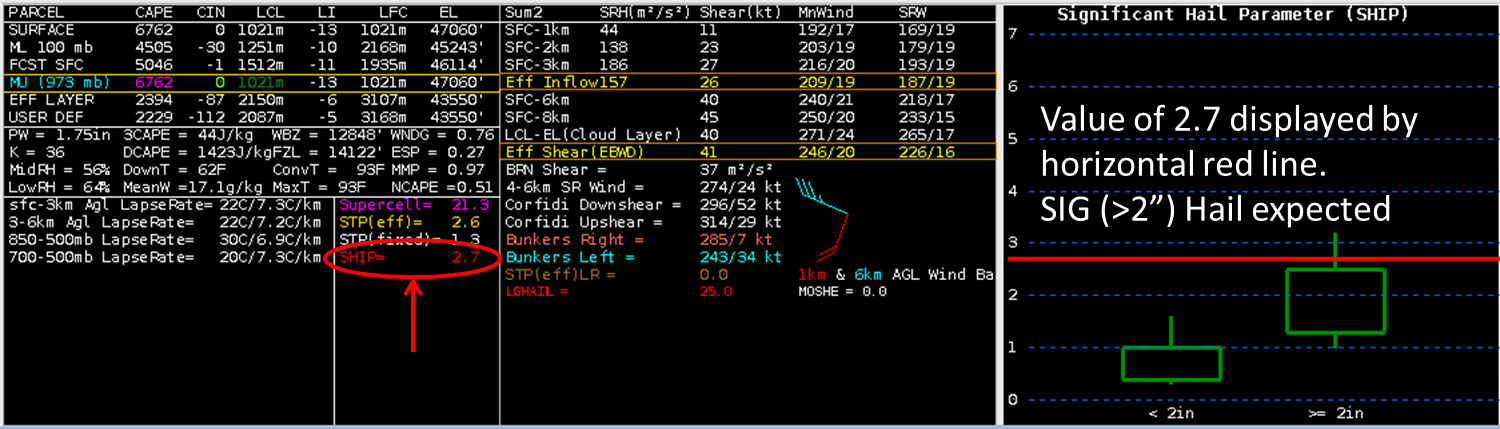
The Significant Hail Parameter (SHIP) was developed using a large database of surface-modified, observed severe hail proximity soundings. It is based on 5 parameters, and is meant to delineate between SIG (>=2" diameter) and NON-SIG (<2" diameter) hail environments.
SHIP = [(MUCAPE j/kg) * (Mixing Ratio of MU PARCEL g/kg) * (700-500mb LAPSE RATE c/km) * (-500mb TEMP C) * (0-6km Shear m/s) ] / 44,000,000
It is important to note that SHIP is NOT a forecast hail size.
Developed in the same vein as the STP and SCP parameters, values of SHIP greater than 1.00 indicate a favorable environment for SIG hail. Values greater than 4 are considered very high. In practice, maximum contour values of 1.5-2.0 or higher will typically be present when SIG hail is going to be reported.
Large Hail Parameter (LGHAIL)
The LGHAIL values are visible from the bottom of the main data tables that are cycled through with the PvDt and NxDt buttons in the main NSHARP buttons control.
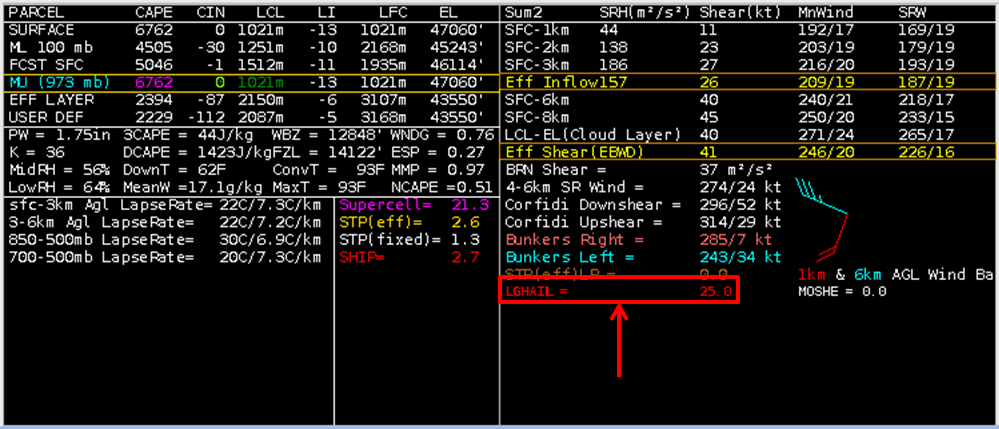
The LGHAIL parameter includes three thermodynamic components: [MUCAPE, 700-500 mb lapse rates, the depth of the hail growth zone (-10 to -30 C)]. It also includes three vertical shear components [surface to EL bulk shear, the direction difference between the ground-relative winds at the EL and in the 3-6 km layer, and the direction difference between the storm-relative winds in the 3-6 km and 0-1 km layers].
If if 0-6 km BWD < 14 m s -1 or MUCAPE < 400 J kg-1, LHP = 0. If both the shear and MUCAPE are >= to the above conditions (a loose supercell check):
LHP = (TERM A * TERM B) + 5
TERM A = (((MUCAPE-2000)/1000) + ((3200-THKHGZ)/500) + ((LR75-6.5)/2)) where THKHGZ is the depth of the hail growth zone (the -10 to -30 C layer), and LR75 is the 700-500 mb temperature lapse rate.
TERM B = (((ShearEL-25)/5) + ((GRWdirEL+5)/20) + ((SRWdirMID-80)/10)) where ShearEL is the magnitude of the vector wind difference between the surface wind and the mean wind in the 1.5 km layer immediately below the EL height for the MU parcel, GRWdirEL is the directional difference between the ground-relative mean wind in the 1.5 km layer below the EL and the mean wind in the 3-6 km layer AGL, and SRWdirMID is the directional difference betweem the mean storm-relative winds in the 3-6 km and 0-1 km layers.
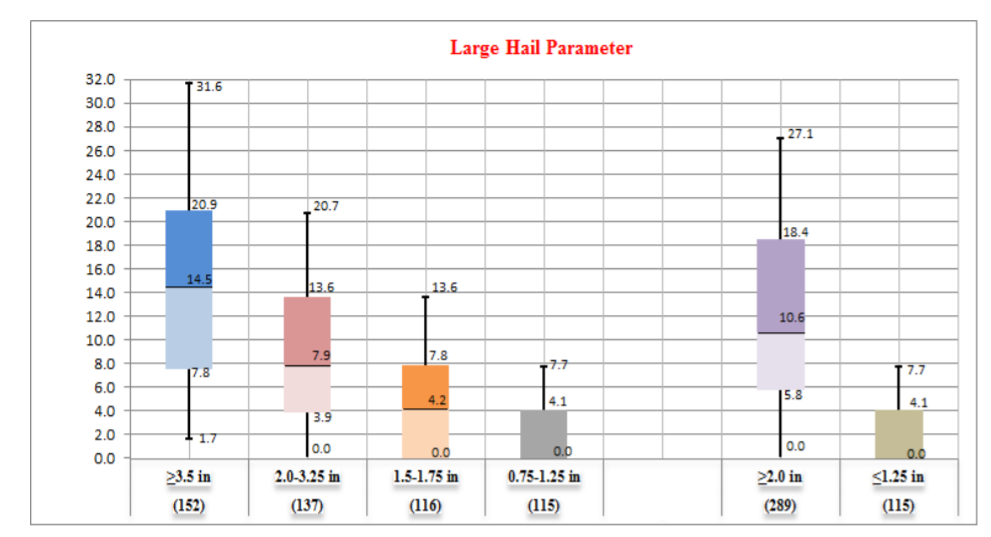
The LGHAIL parameter is meant to discriminate between significant hail (>= 2 inch diameter and smaller hail).
Below is a box and whiskers plot of LGHAIL and hail size from A.W. Johnson and K.E. Sugden 2014 (Internet link)
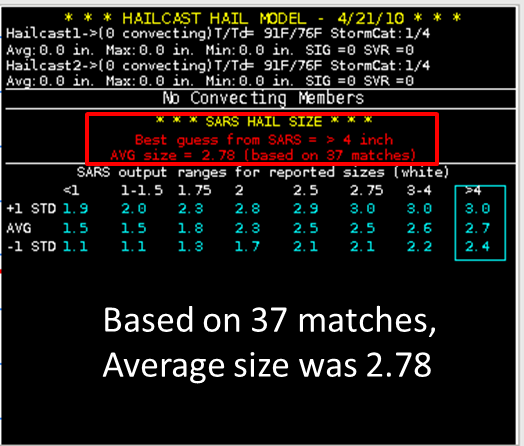
Hail Model and the Sounding Analog Retrieval System (SARS)
The hailcast hail model output is visible from the bottom-right part of the main display after clicking the HAIL button.
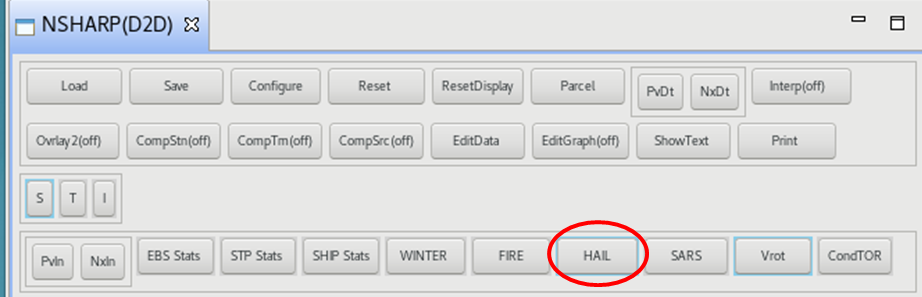
The SARS method returns a maximum expected hail report by matching existing environmental conditions to historic severe hail cases. These forecast maximum sizes are conditional on severe hail of any size occurring.
Tornado
Significant Tornado Parameter (STP)
The STP values are visible from the bottom of the main data tables that are cycled through with the PvDt and NxDt buttons.
STP is a composite index that can include effective bulk wind difference (EBWD), effective storm-relative helicity (ESRH), 100-mb mean parcel CAPE (mlCAPE), 100-mb mean parcel CIN (mlCIN), and 100-mb mean parcel LCL height (mlLCL).
The index is formulated as follows:
STP = (mlCAPE/1500 J kg-1) * ((2000-mlLCL)/1000 m) * (ESRH/150 m2 s-2) * (EBWD/20 m s-1) * ((200+mlCIN)/150 J kg-1)
The mlLCL term is set to 1.0 when mlLCL < 1000 m, and set to 0.0 when mlLCL > 2000 m; the mlCIN term is set to 1.0 when mlCIN > -50 J kg-1, and set to 0.0 when mlCIN < -200; the EBWD term is capped at a value of 1.5 for EBWD > 30 m s-1, and set to 0.0 when EBWD < 12.5 m s-1. Lastly, the entire index is set to 0.0 when the effective inflow base is above the ground.
There are multiple STP values listed in NSHARP:
STP(CIN) is based off a 100mb mean parcel, effective SHR, and effective bulk wind difference in the lower half of the storm. This is the preferred parameter because it incorporates the depth of the unstable inflow into the storm using the effective parcel with CAPE > 100 J/kg and CIN > -250J/kg.
STP(fixed) is based off surface-based CAPE and the CIN term is dropped. The shear levels are fixed using 0-1km SRH and 0-6km bulk wind difference.
STPC(test) is based off CAPE below 500mb.
A majority of significant tornadoes (F2 or greater damage) have been associated with STP values greater than 1 within an hour of tornado occurrence, while most non-tornadic supercells have been associated with values less than 1 in a large sample of RAP analysis proximity soundings.
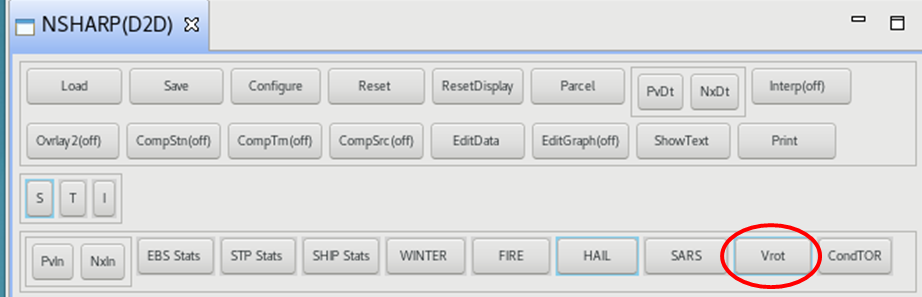
Vrot
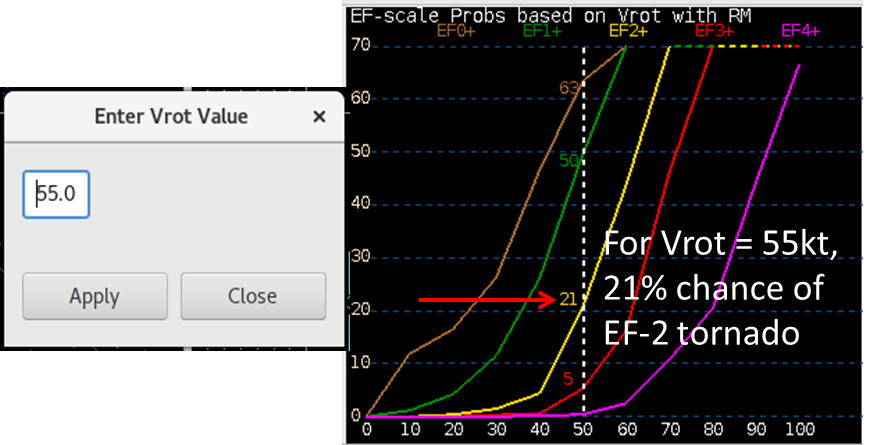
In NSHARP a rotational velocity (Vrot) calculated from a low-altitude radar velocity couplet can be entered into NSHARP using the Vrot button in the main NSHARP button window. Applying this number in NSHARP displays a vertical line plot in a graph that provides a probability of tornado for different EF scales.
Vrot is calculated as follows:
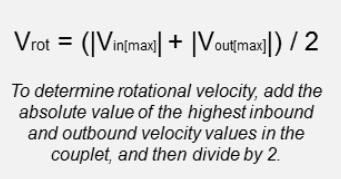
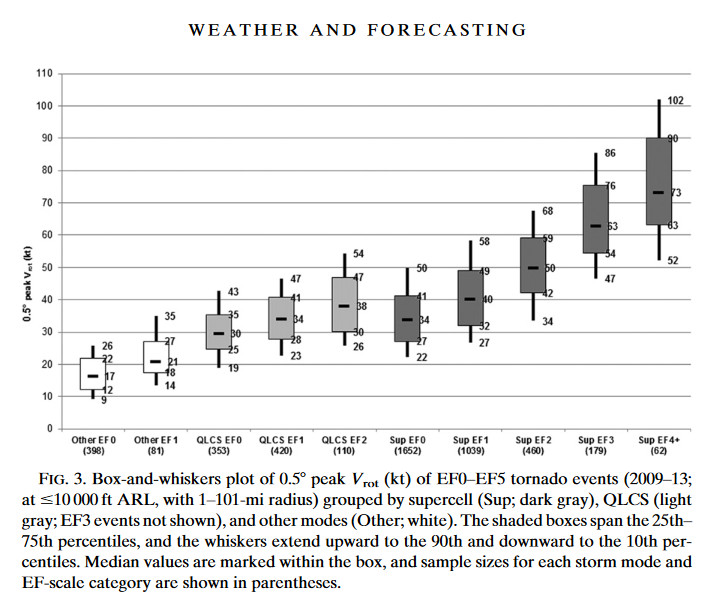
Below is a box and whiskers plot of Vrot and EF scale by Smith, B.T., Thompson, R.L, Dean, A.R., and Marsh, P.T. (2015; Internet link)
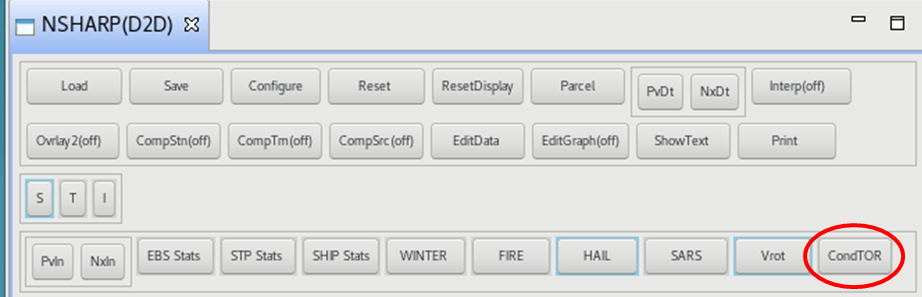
CONDTor
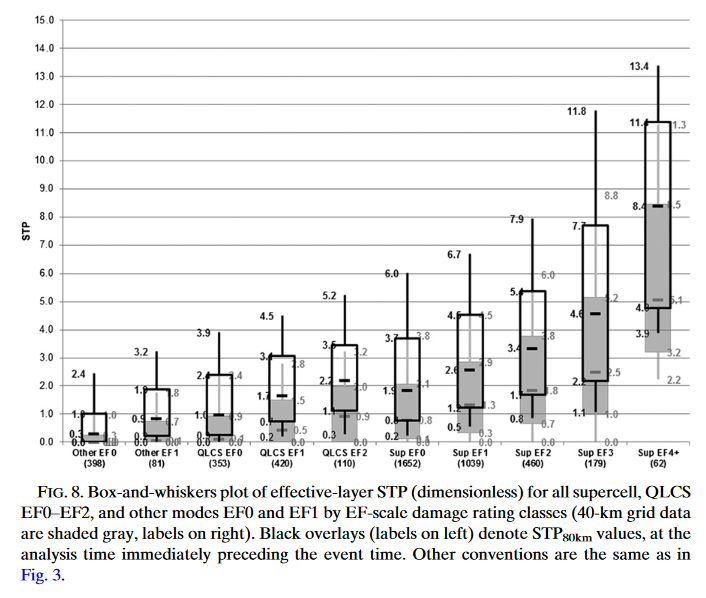
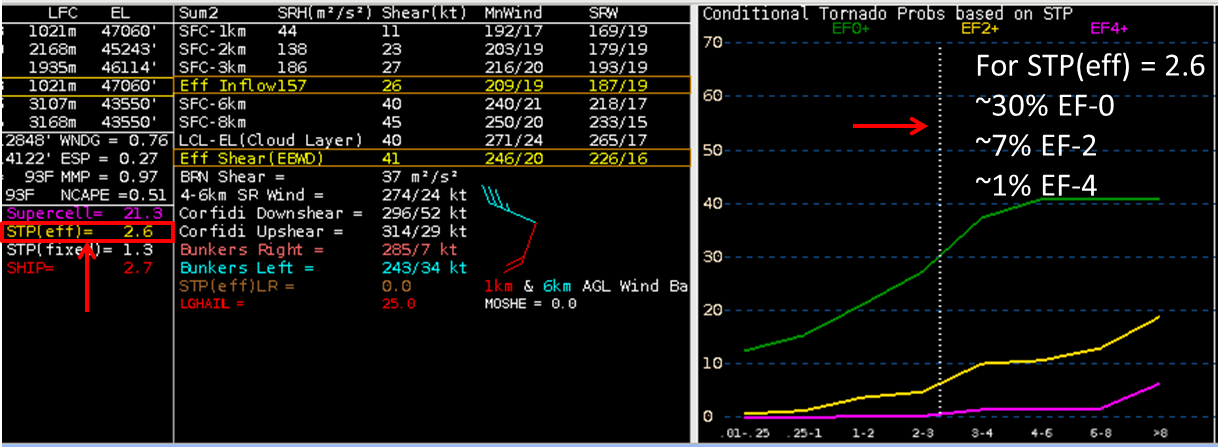
CONDTor is the conditional probability of tornado damage using the effective layer STP value. It is loaded using the CondTOR button in the main NSHARP buttons window.
The CONDtor graph is displayed on the bottom-right part of the NSHARP display, and it illustrates the effective STP [STP (eff)] and its relation to different EF scales. The current STP(eff) value is indicated by a vertical dotted line.
Below is a box and whiskers graph from Smith, B.T., Thompson, R.L, Dean, A.R., and Marsh, P.T. (2015; Internet link)