


MRMS All Tilts Job Sheets - OCLO
MRMS All Tilts Jobsheet
Summary: This jobsheet reviews the loading of MRMS All Tilts for 0.5-19km and 0.5-3km layers, and it steps through the keyboard shortcuts, noting changes in vertical resolution and time range of data displayed.
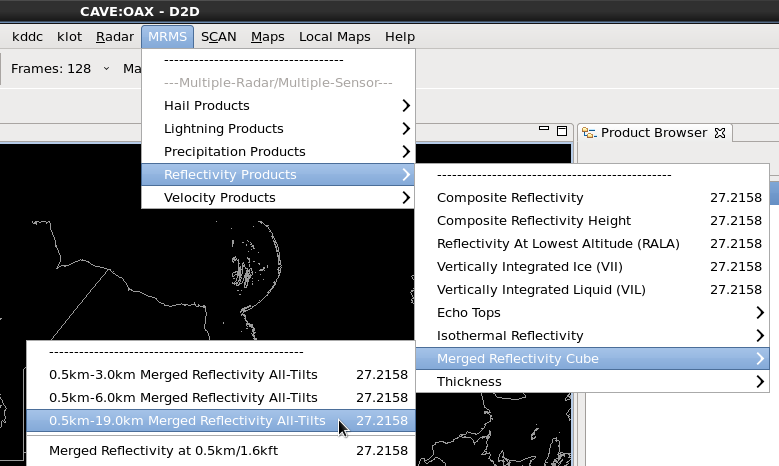
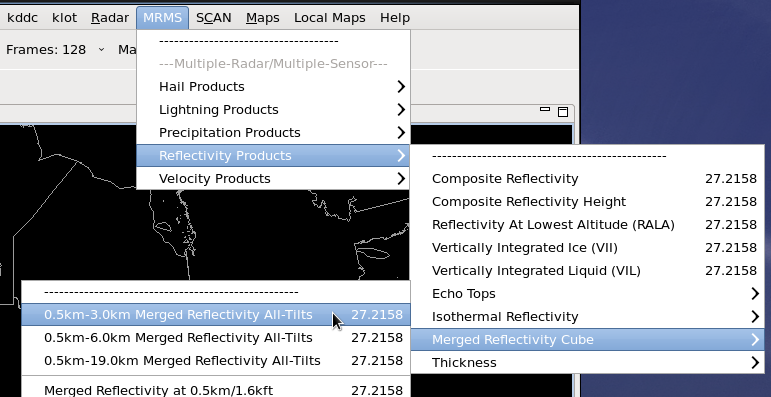
- Under the MRMS->Reflectivity Products->Merged Reflectivity Cube menu in D2D select 0.5km-19km Merged Reflectivity All-Tilts (Fig. 1).
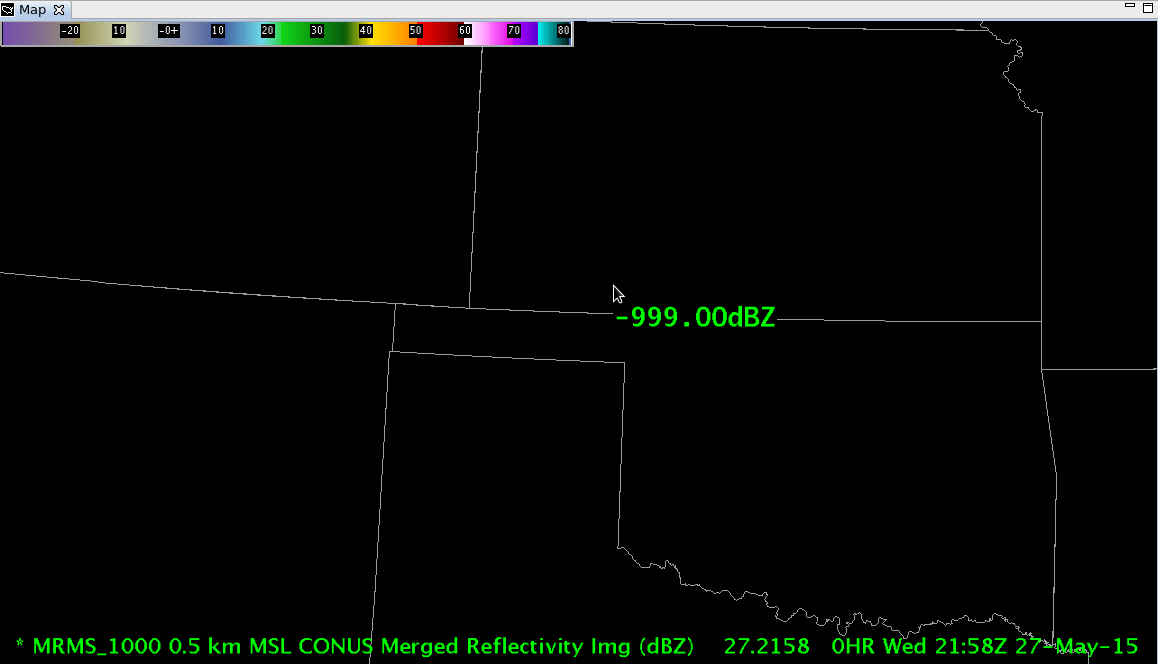
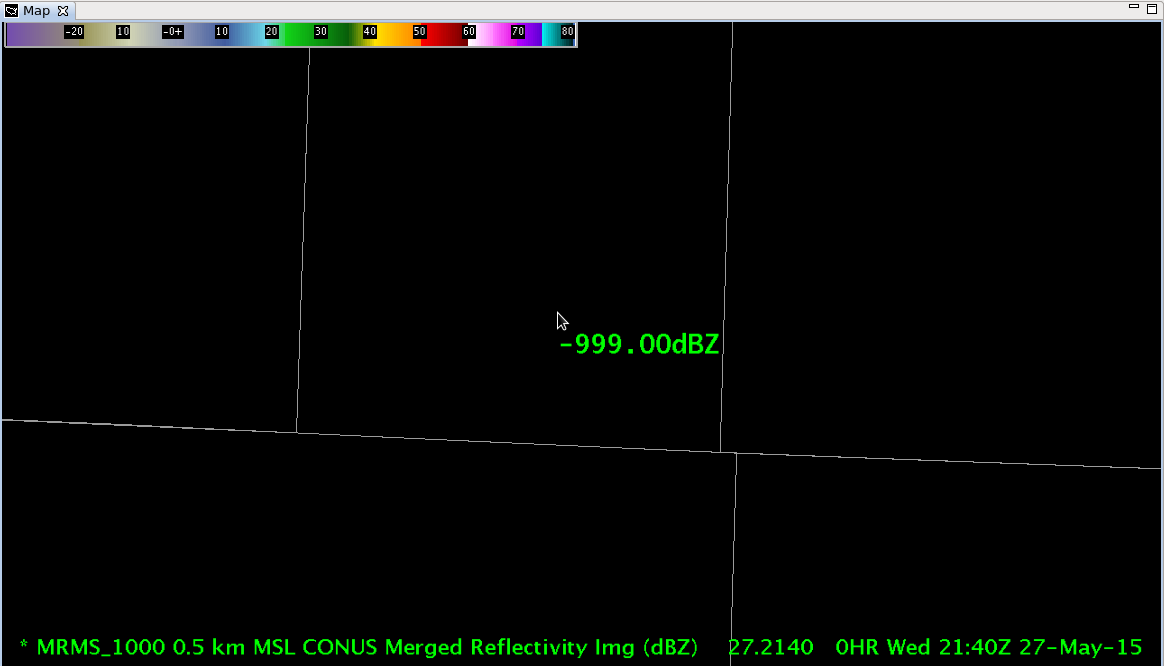
- Right click on the CAVE editor and select sample to turn on sampling. Use the up and down-arrow keys to step vertically through the reflectivity cube at the current time and navigate to the lowest layer at 0.5km above mean sea level. To determine the height, inspect the legend text on the lower left part of the display. Note the lack of reflectivity throughout the display if 0.5km is below ground (Fig. 2).
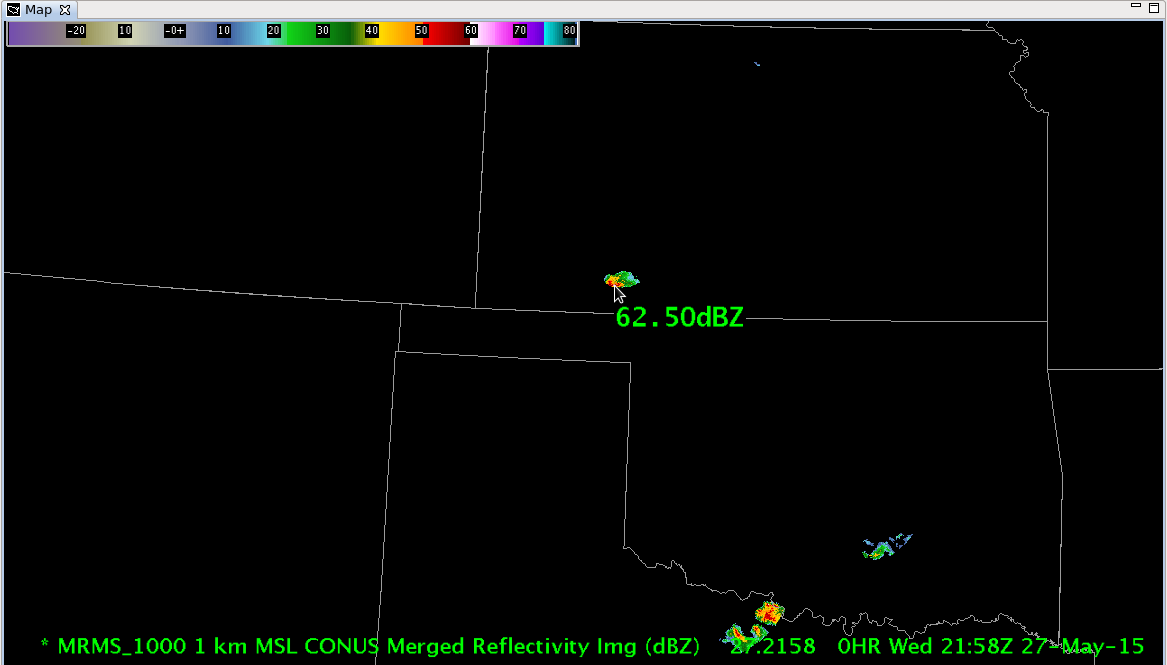
- Click on the up-arrow key until you see reflectivity data (this is probably close to the surface or where the lowest 0.5 degree tilts are; Fig. 3).
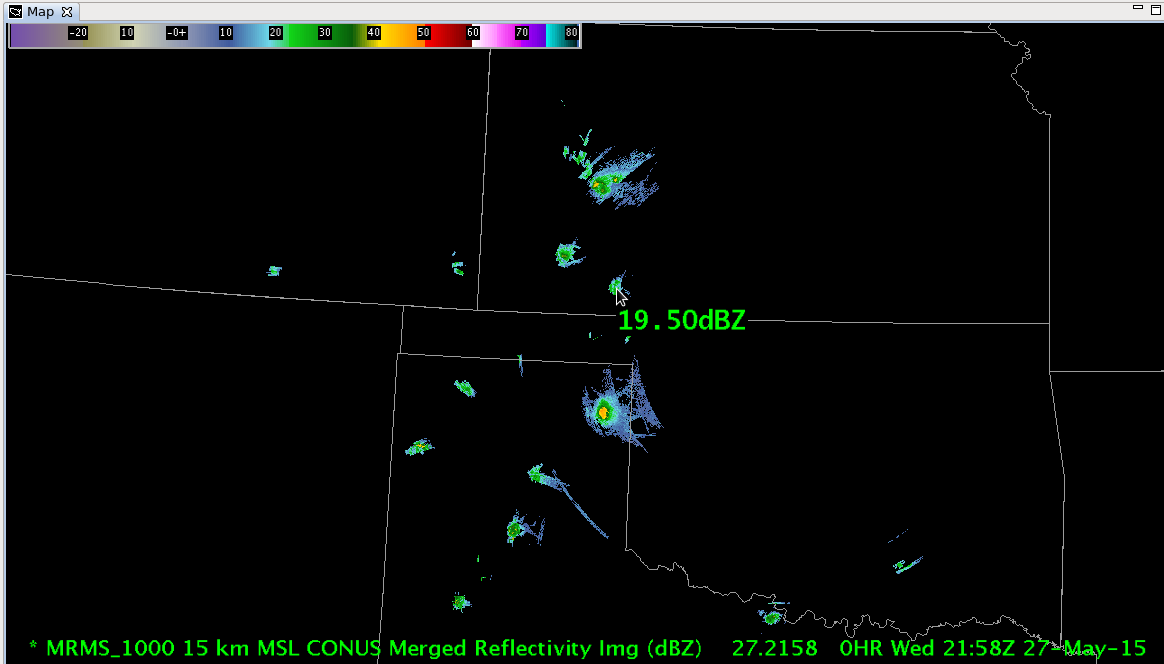
- Click on the up-arrow key until you get to upper levels and note the vertical resolution changes from 250m in low levels to 1km in upper levels (Fig. 4).
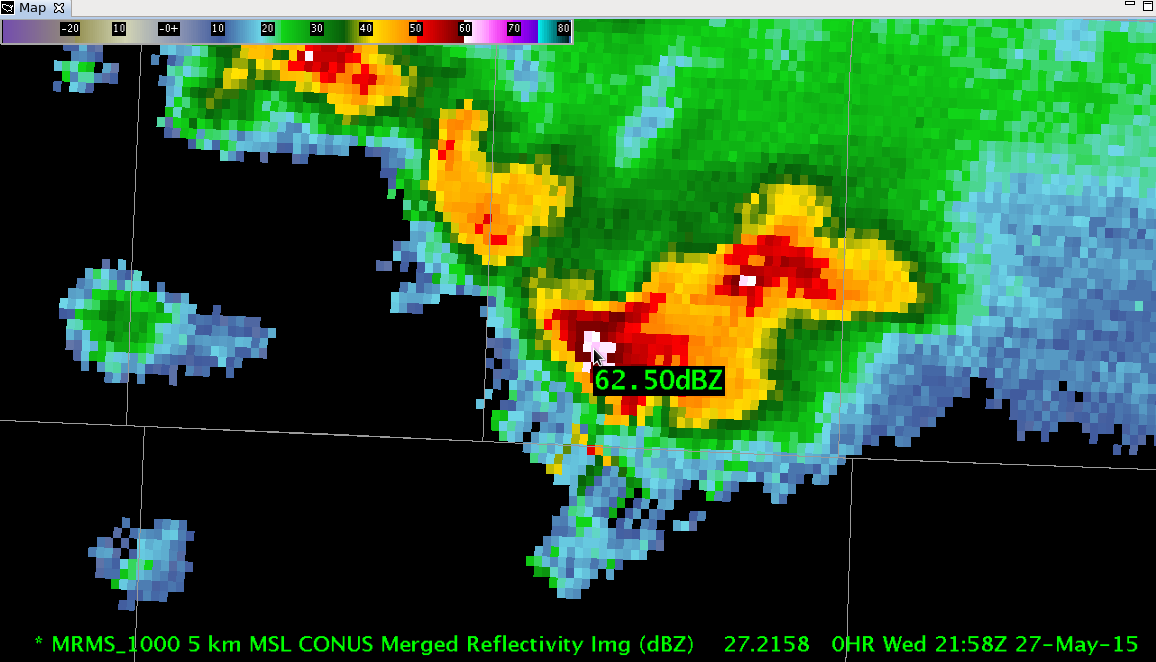
- Use the up and down-arrow keys to navigate to a frame of data with something interesting to view and notice the time in the legend text in the bottom right part of the display (Fig. 5).
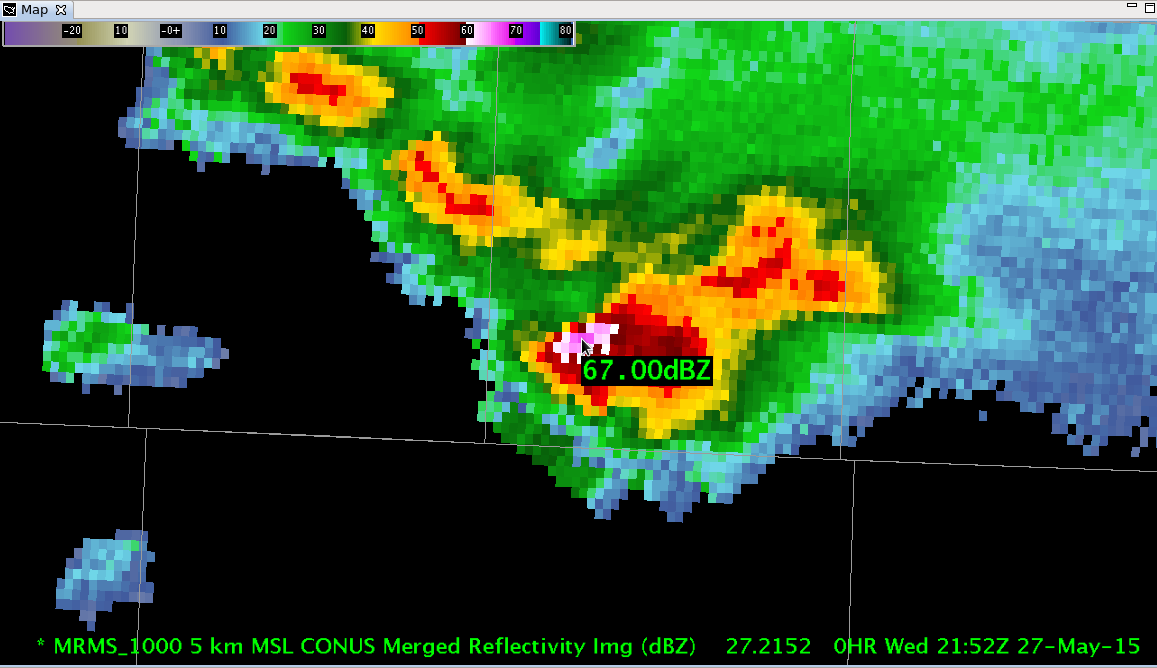
- Use the left and right-arrow keys to step through the 2-minute time steps. If your AWIPS is ingesting the full 33 layers every 2 minutes, you should see around 4 time steps covering a period of about 6 min (Fig. 6).
- Clear the display, and under the MRMS->Reflectivity Products->Merged Reflectivity Cube menu in D2D select 0.5km-3km Merged Reflectivity All-Tilts (Fig. 7).
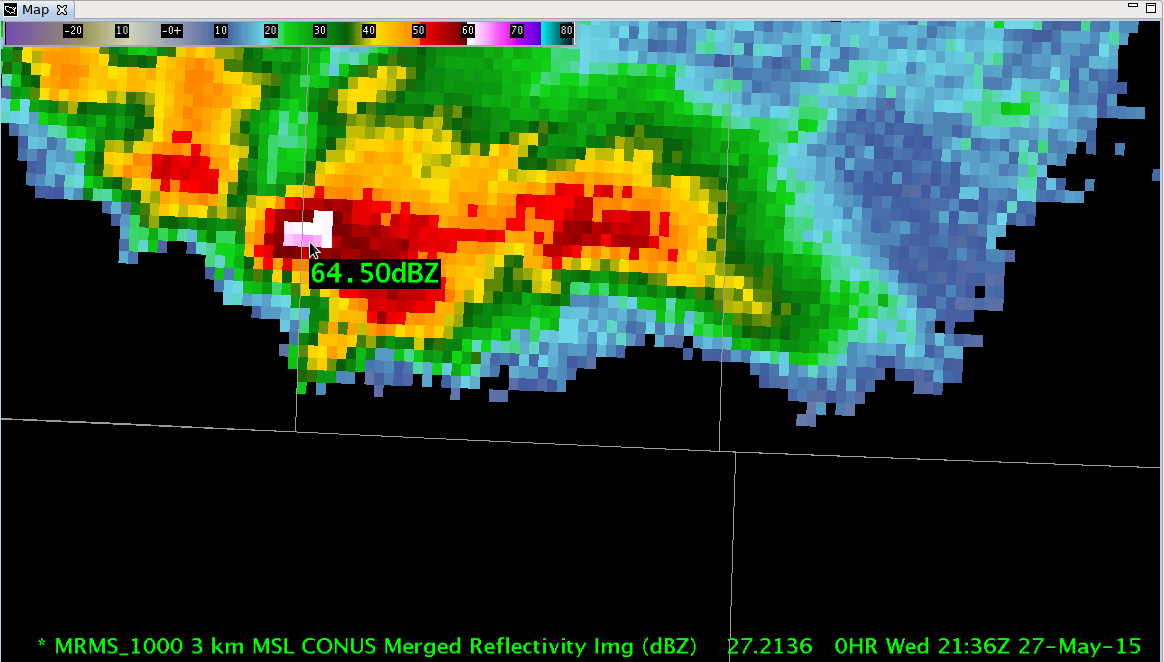
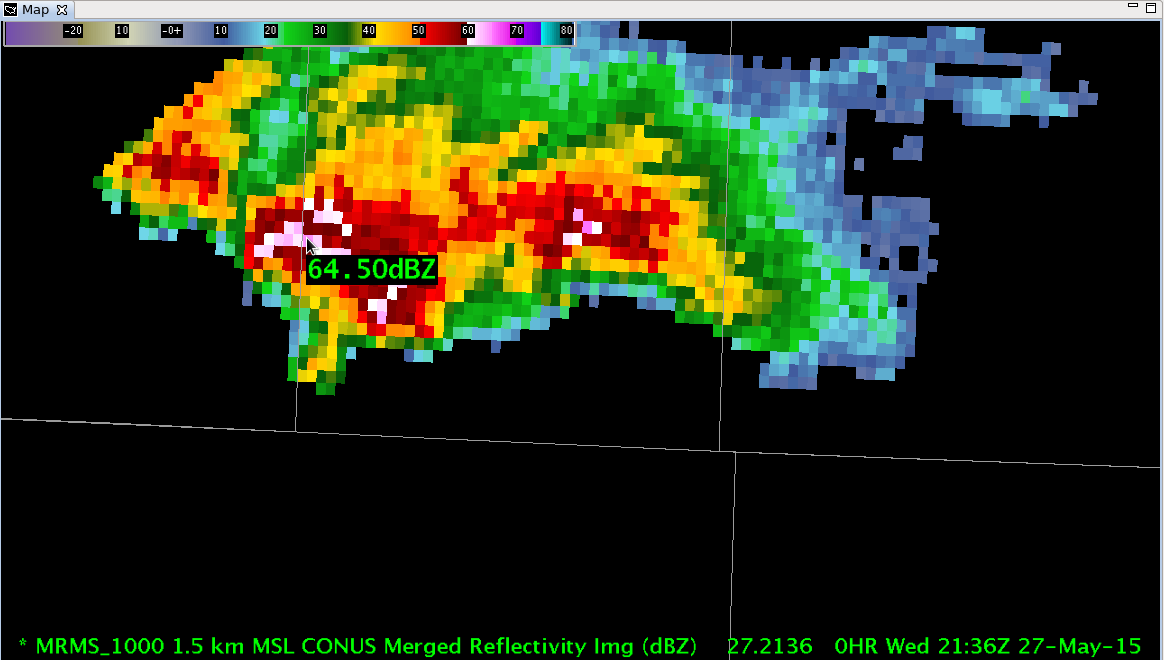
- Right click on the CAVE editor and select sample to turn on sampling. Use the up-arrow key to step vertically through the reflectivity cube at the current time until you reach the highest tilt at 3km above mean sea level (Fig. 8).
- Use the left and right-arrow keys to step through the 2-minute time steps. If your AWIPS is ingesting all of the 11 layers in this all tilts every 2 minutes, you should see around 12 time steps covering a period of about 22 min (Fig. 9).
- Navigate to an earlier time in the data using the left-arrow key, and then use the Ctrl key with the arrow keys to:
- Ctrl + right arrow – highest height on most recent frame (Fig. 10)
- Ctrl + left arrow – lowest height on oldest frame (Fig. 11)
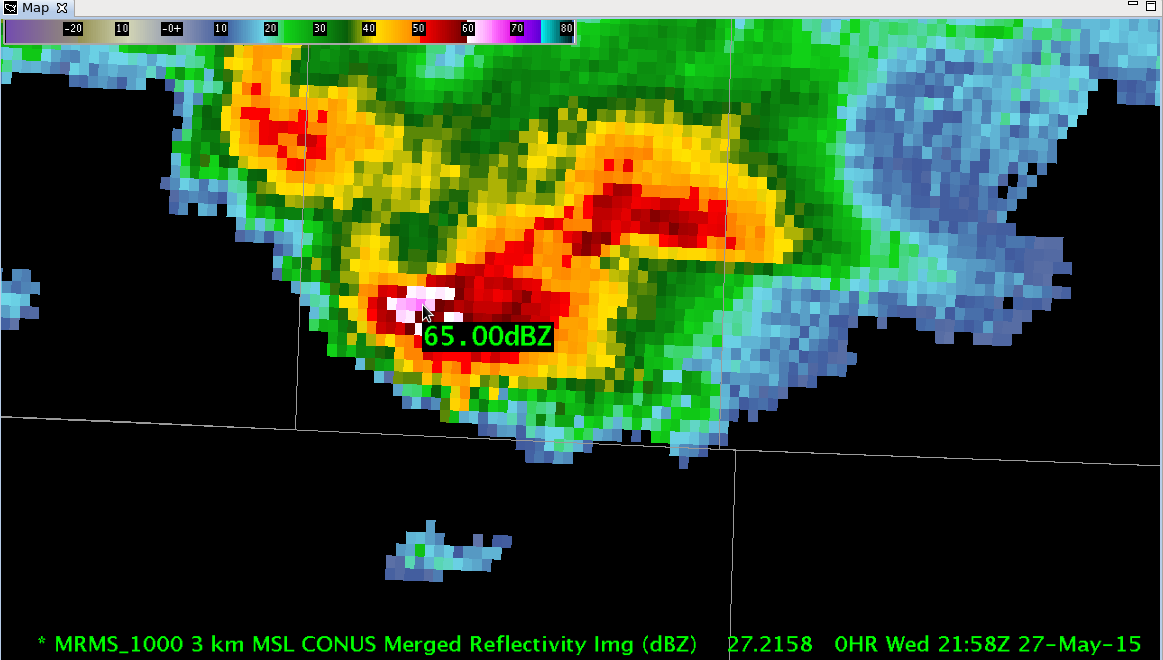
- Ctrl + up arrow – highest height at time of data displayed (Fig 12 started at 1.5km at 2140z)
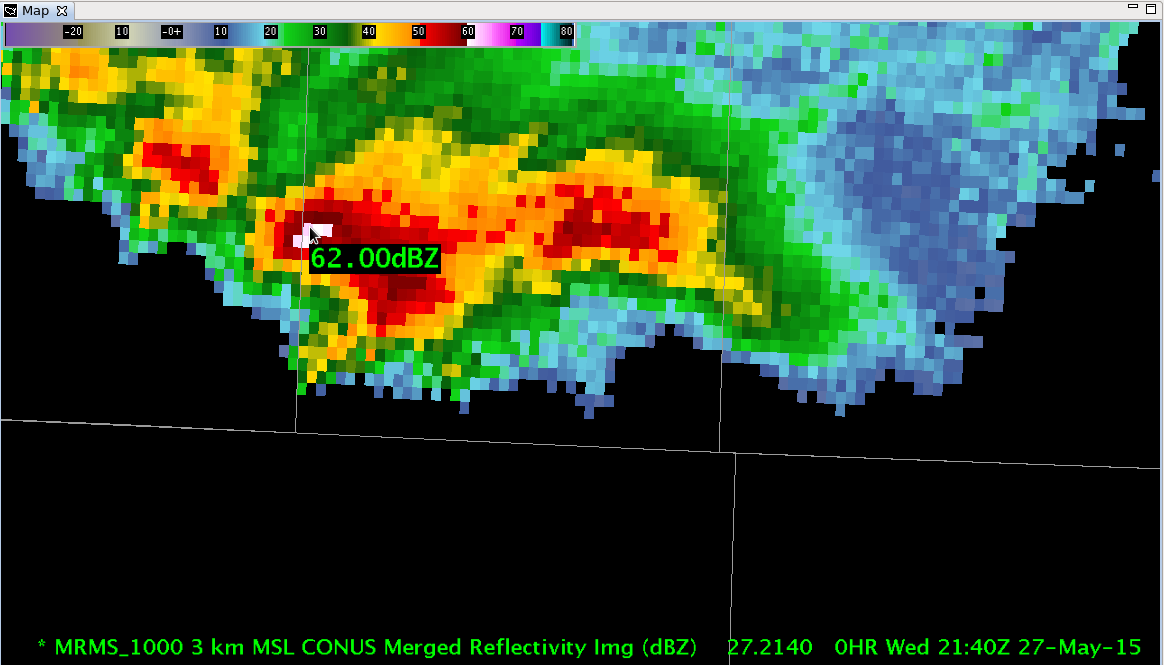
- Ctrl + down arrow – lowest height at time of data displayed (Fig 13 started at 3km at 2140z)