Purpose:
This jobsheet will review using the local radar sources in the Volume Browser to generate vertical and horizontal cross sections (15-25min).
Tasks:
- The Volume Browser (VB) can load radar data in a number of different ways. Once the VB is configured, it will load a contour product, and you will need to right click and load as image and select your appropriate color table.
- Important Tip - Before you load a product in the Volume Browser it is worth selecting a low frame count as it takes a lot of CPU to extract out the base radar data and contour every volume scan. You can always increase frame counts after you have the latest data visualized.
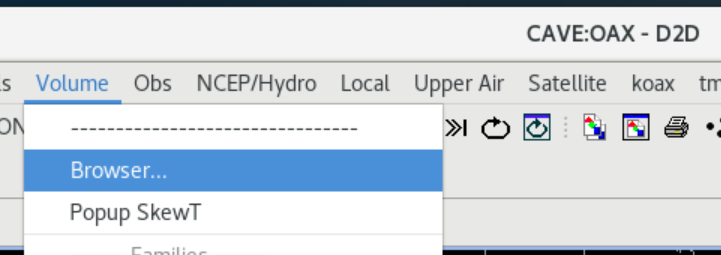
- Under the Volume menu load the Browser (image).
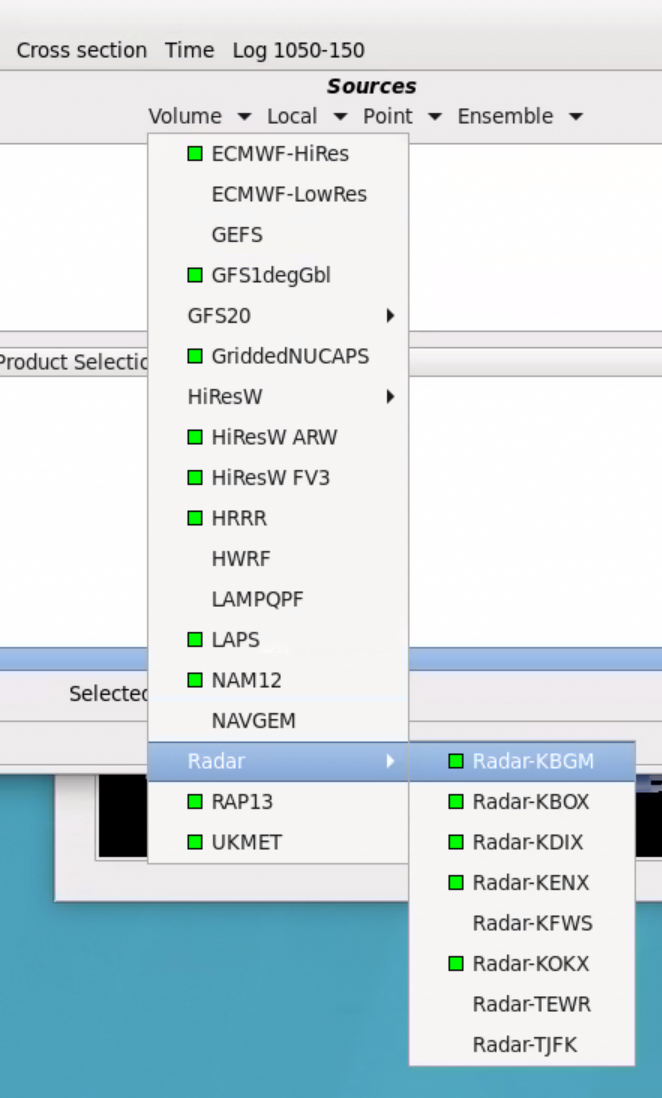
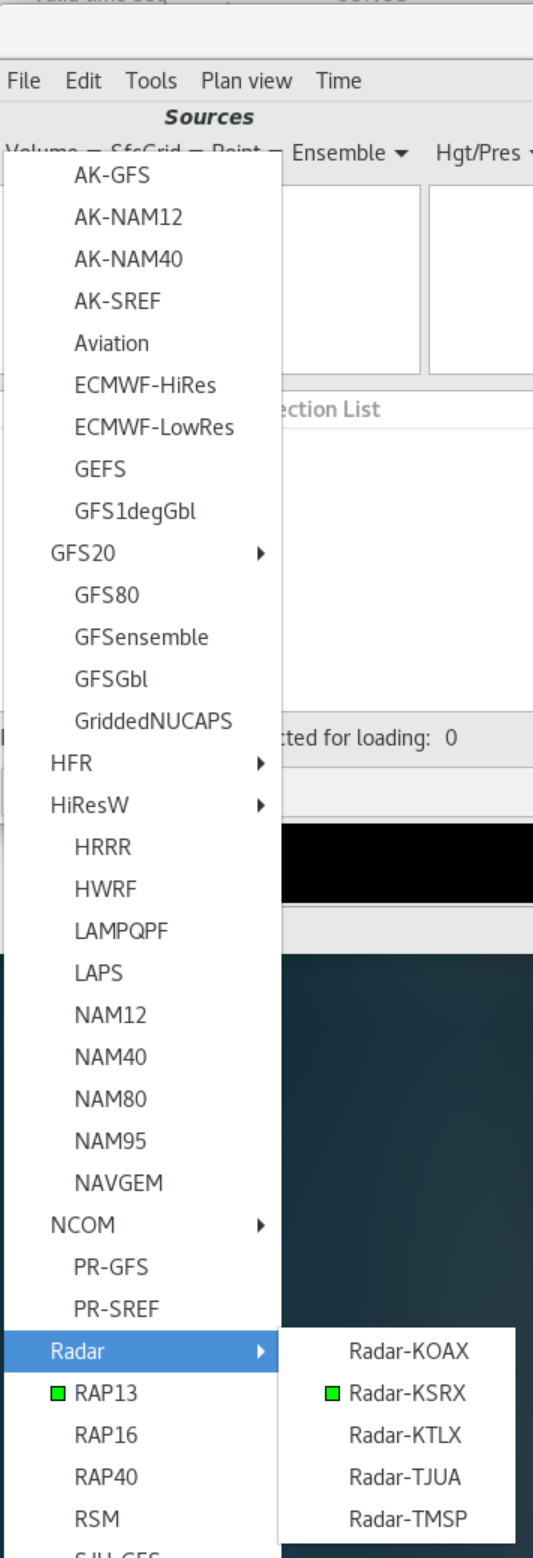
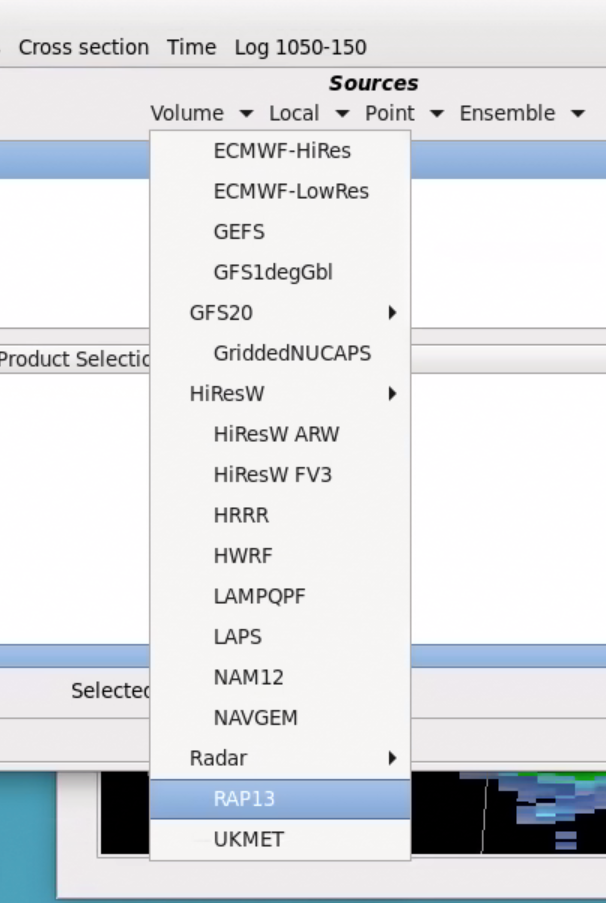
- The default setting should be Plan view in the fourth column at the top. For the first example we will create a constant altitude cross section. Under the Under the Sources section of the "Plan view", select one of your local radars, Radar-XXXX from the Volume menu and Radar submenu (image).
- Valid data will have a green box next to it.
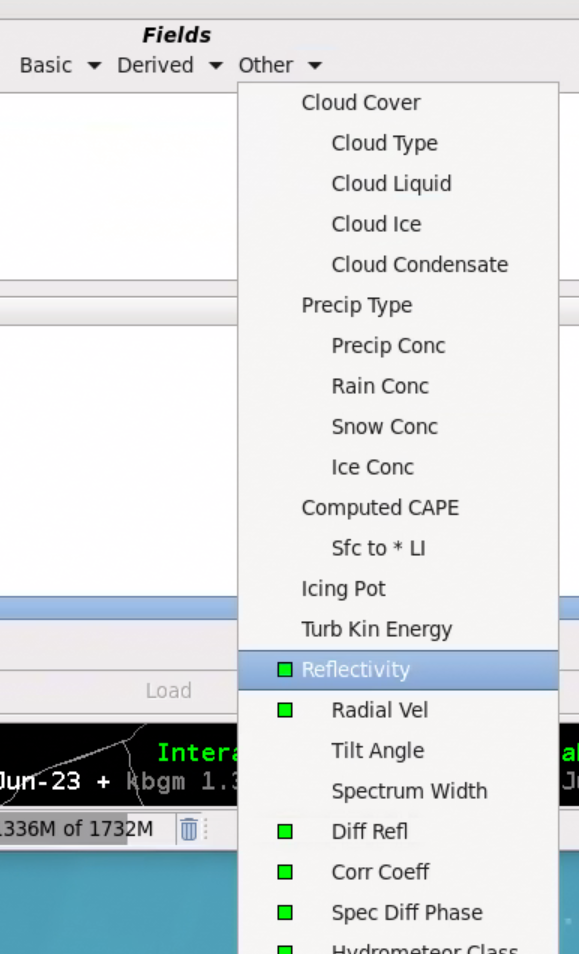
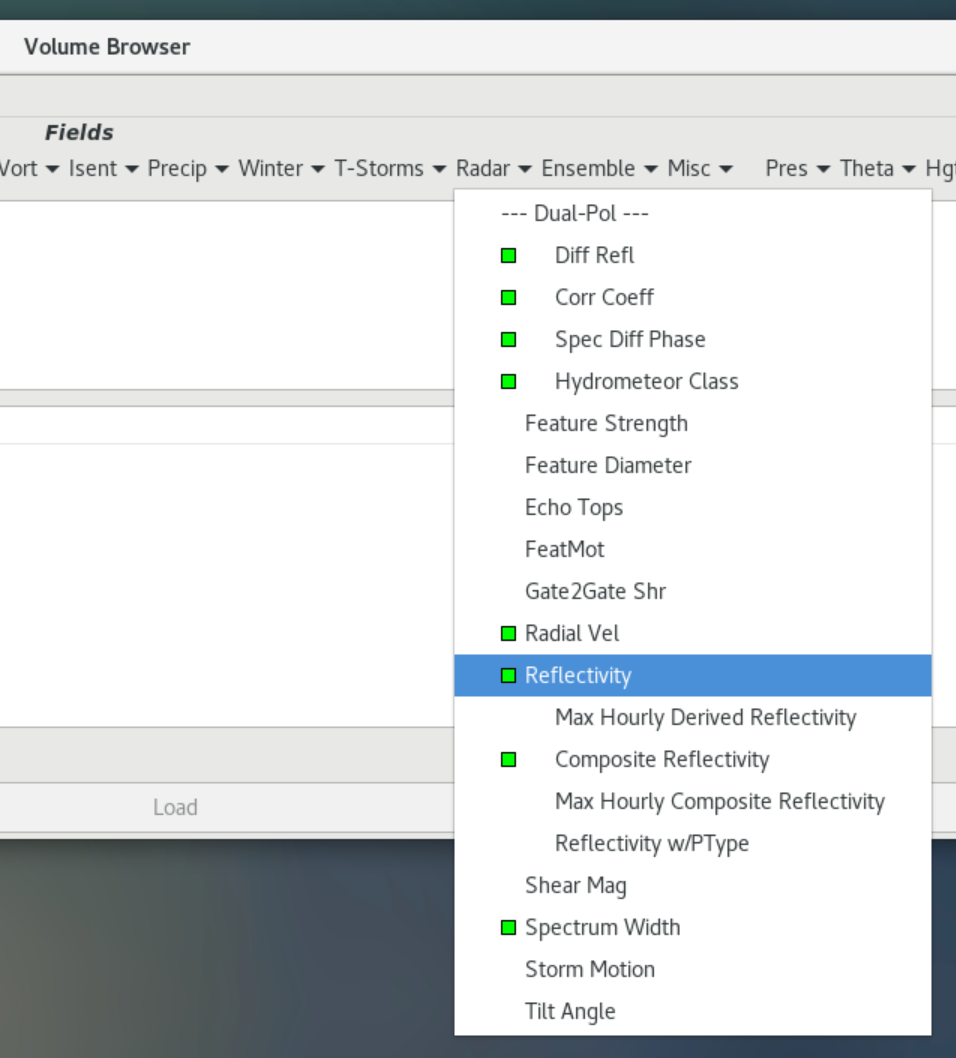
- Under the Fields section select the Radar menu and the Reflectivity submenu (image). Note all the other base radar products and Dual Pol variables except storm-relative velocity are available. SRM requires a storm motion, and the VB doesn't have a way to compute the storm-relative velocity product.
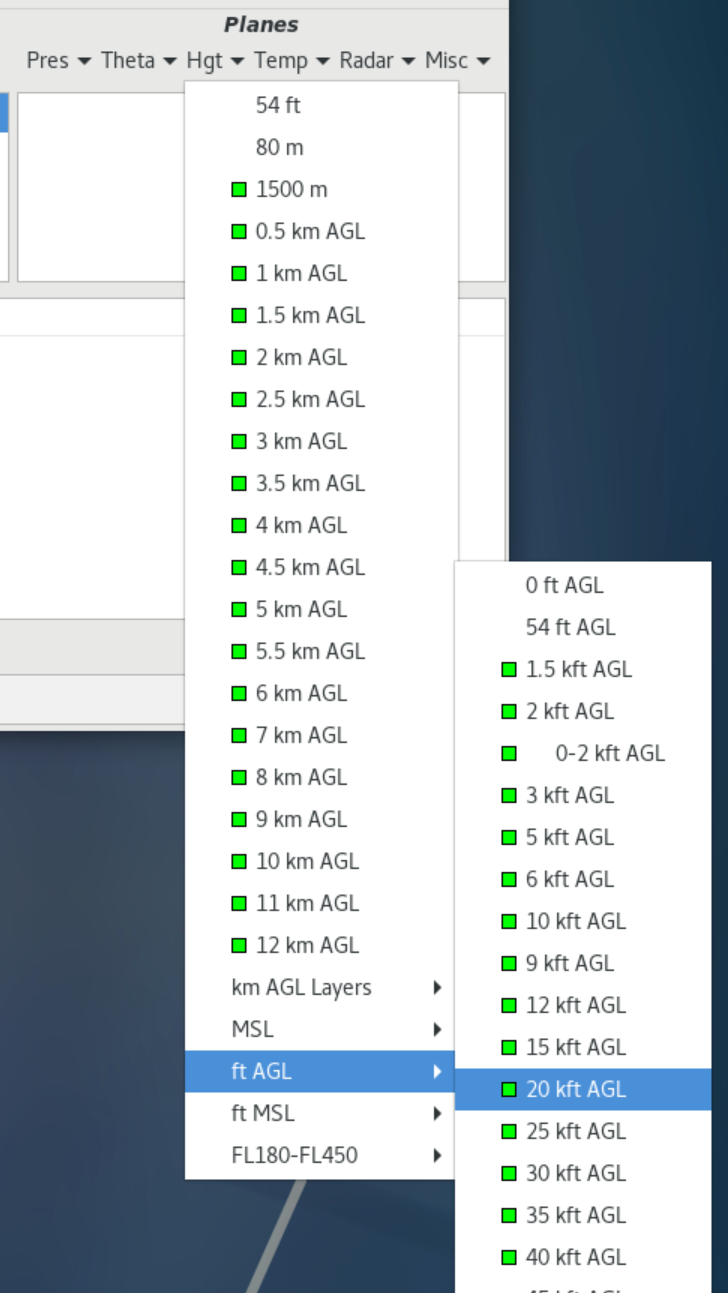
- Under the Planes menu select Hgt and your desired height (image). In this example I am going to load a constant altitude cross section at 20 Kft which is in the hail growth zone. This can be a way to monitor the development of elevated hail cores between multiple storms. One benefit of the VB over MRMS multi-radar is the VB will not smooth out small peaks. The down side is that it is just a single radar perspective, though if one radar is providing the best coverage for the storm, this can be what is more desired.
Note: when requesting multiple products, sometimes some of the menus will not present a product in the Times when you know it is there. Usually clearing out the entries under the Edit menu (e.g. Clear All) will reset it and allow it to function properly.
- When you have a valid Source/Field/Plane selected the VB will identify the times and product in the bottom of the VB and automatically select the row. Click Load.
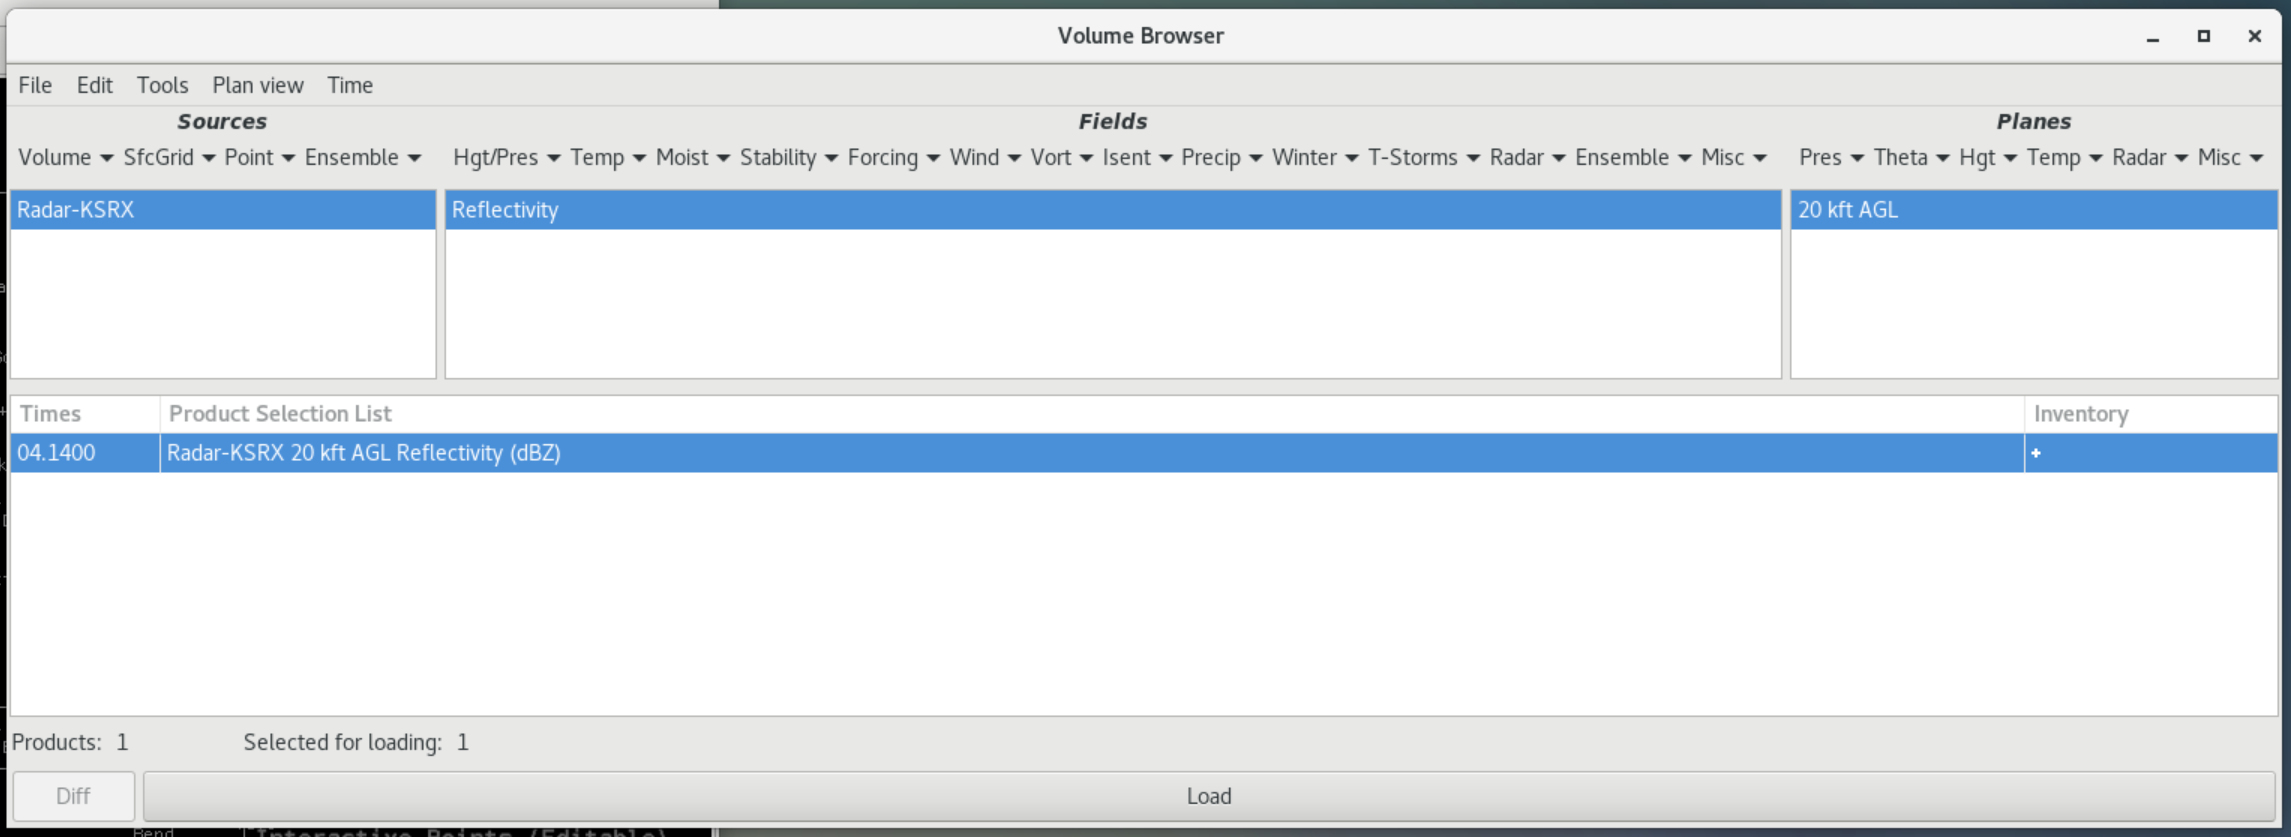
Note that if you load multiple products at once you can manually toggle which rows are selected to load on that product.
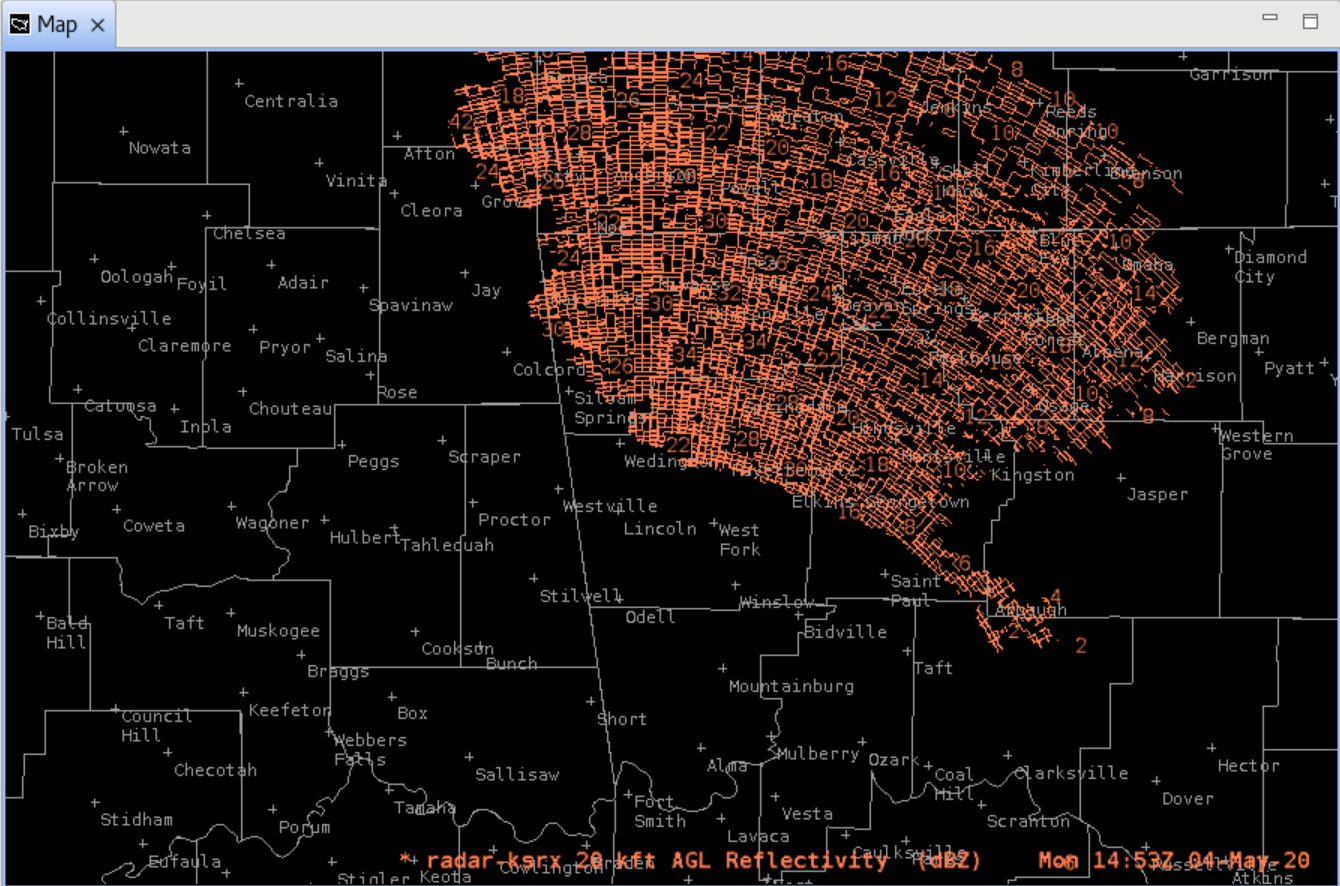
- The VB should render a contour product initially:
- Right click on the Reflectivity text legend and select Load as Image.
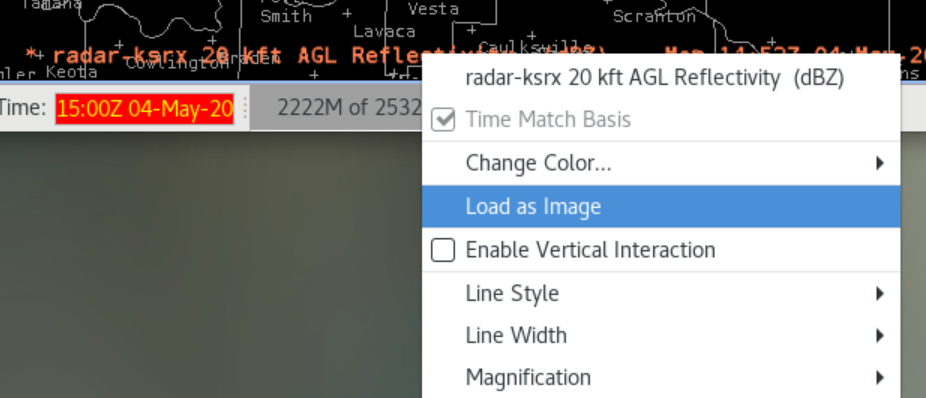
- Important: Do not use the Enable Vertical Interaction capability. This is a preliminary version of new radar capability under development that was pushed to the next AWIPS build because it was not ready for operations.
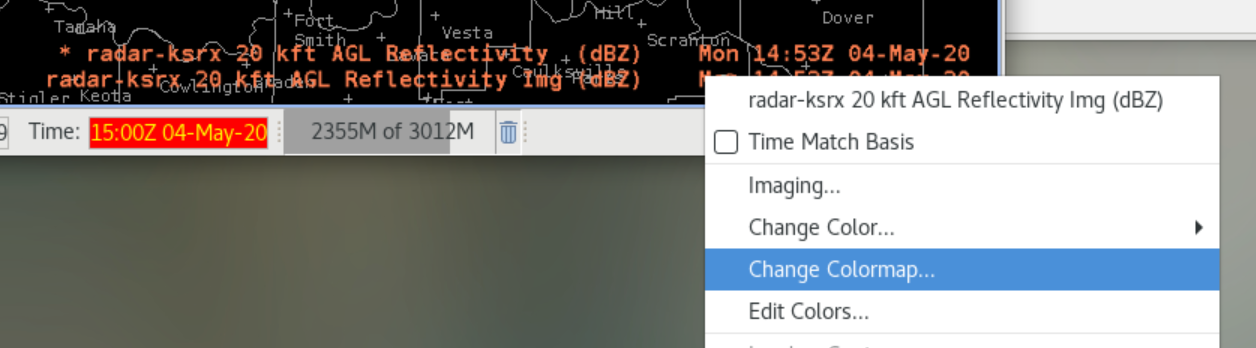
- Note: your color table can be different as the one shown above. To change the color table, right click on the radar Img text legend and select Change Colormap.
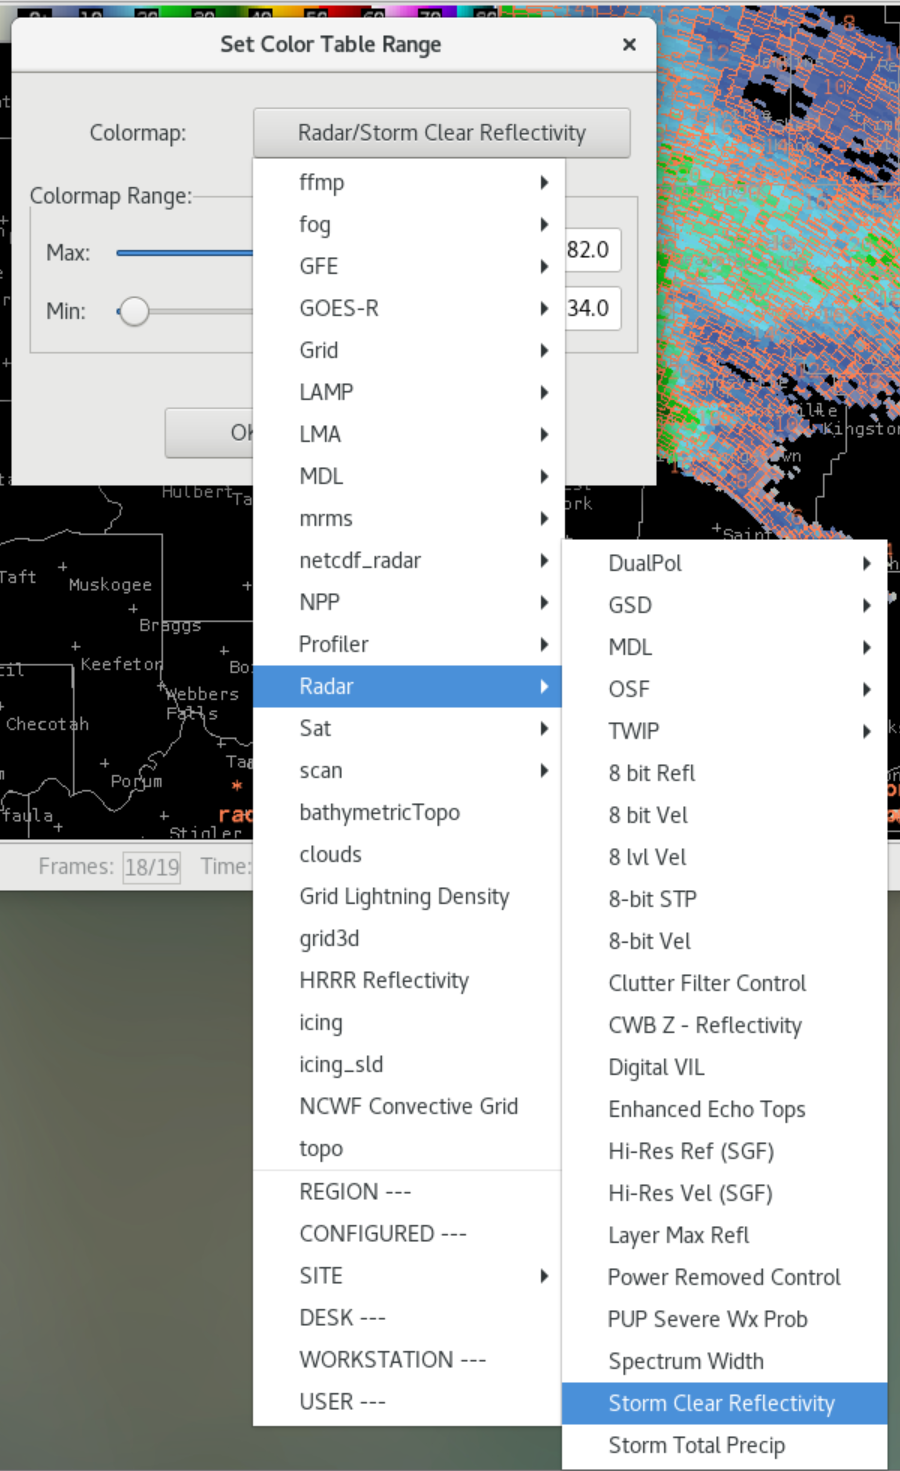
- Click on the Colormap: button and navigate to your favorite reflectivity colormap under the Radar menu.
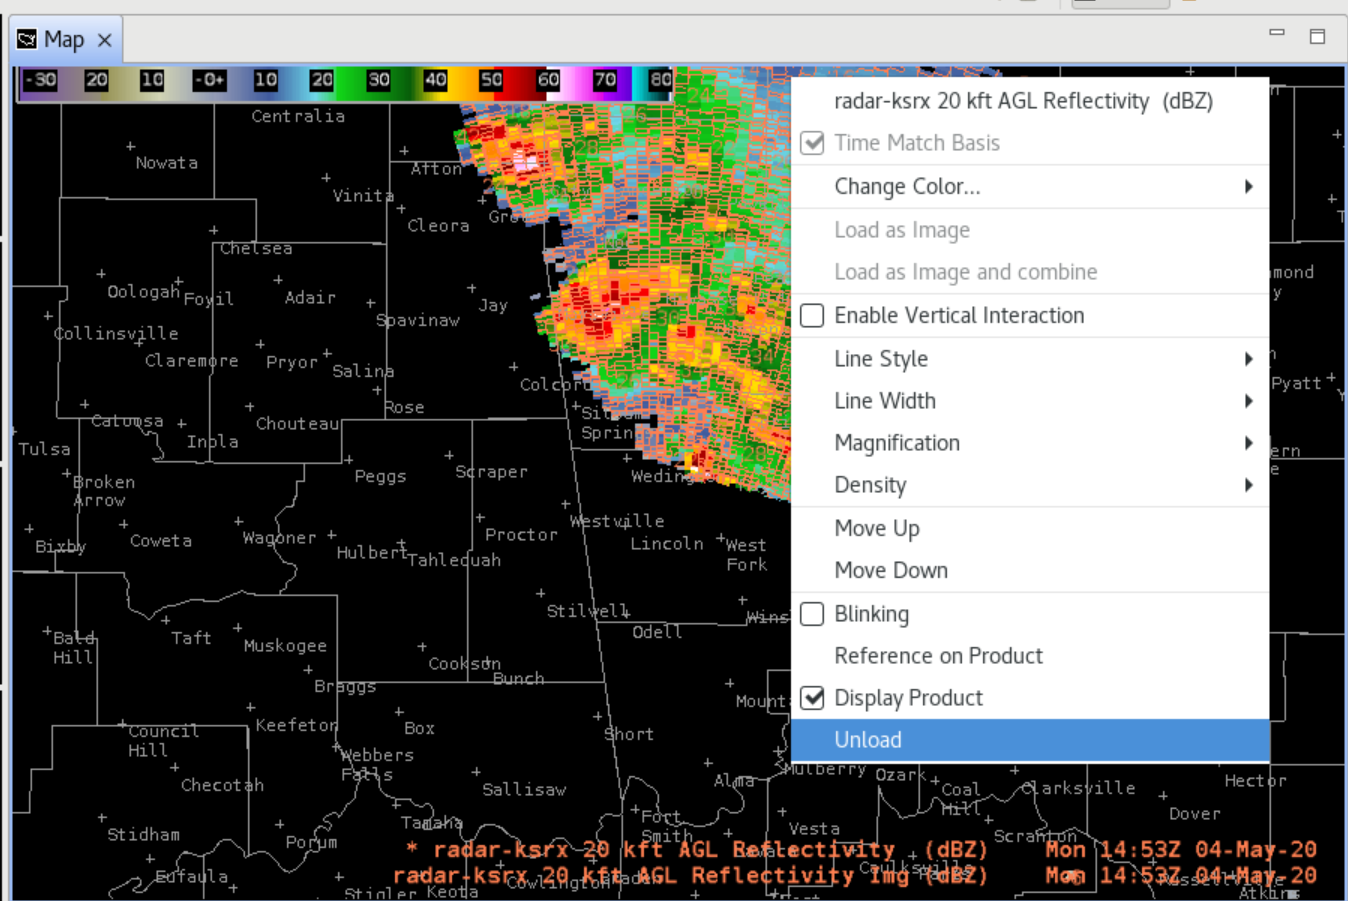
- Remove the contour version of the text legend by right clicking on the text legend that does not contain Img and select Unload.
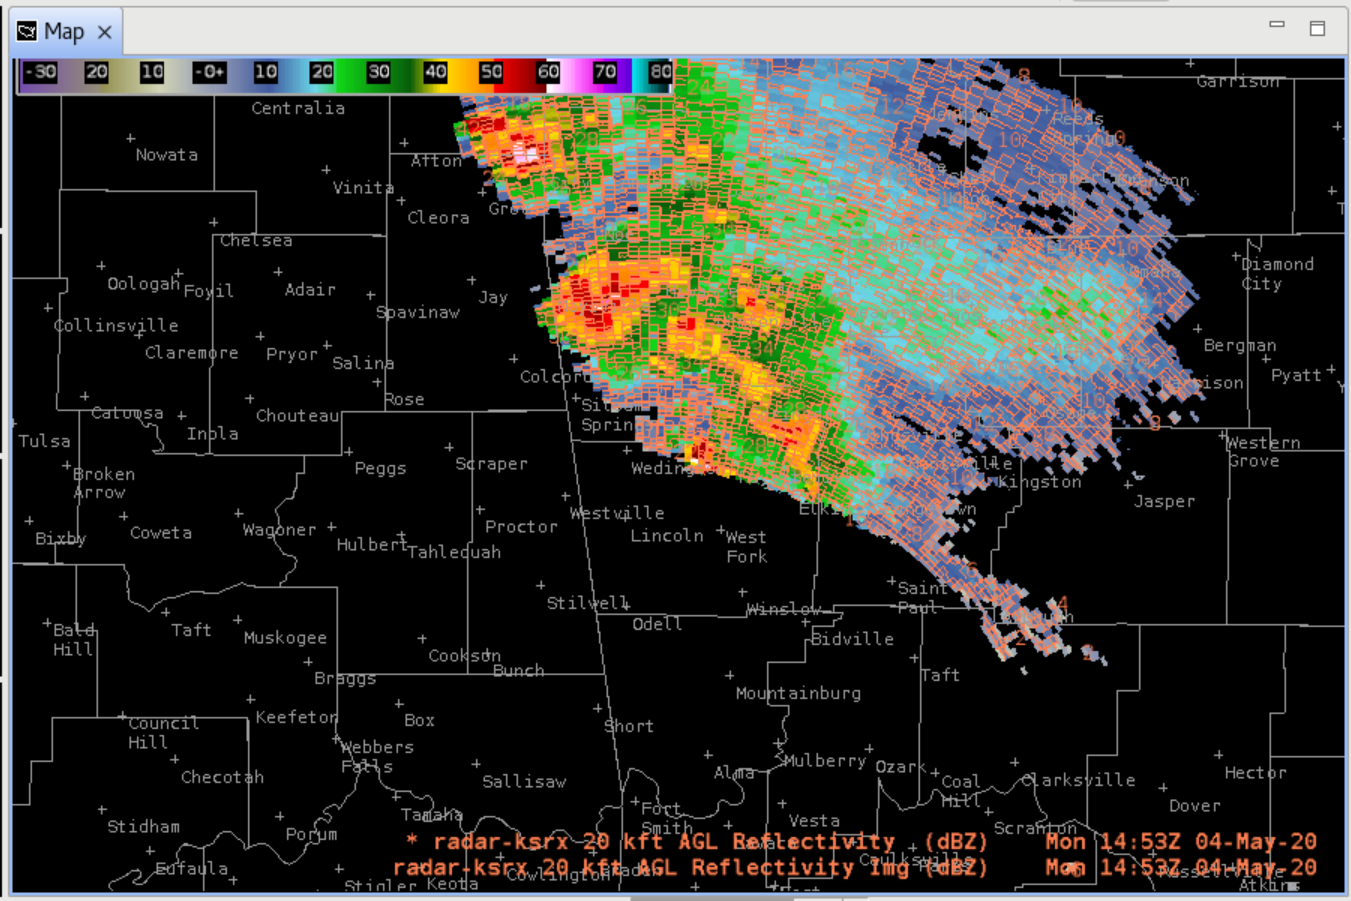
- Only the Img product should be visible, and it should retain a lot of the detail in the base data.
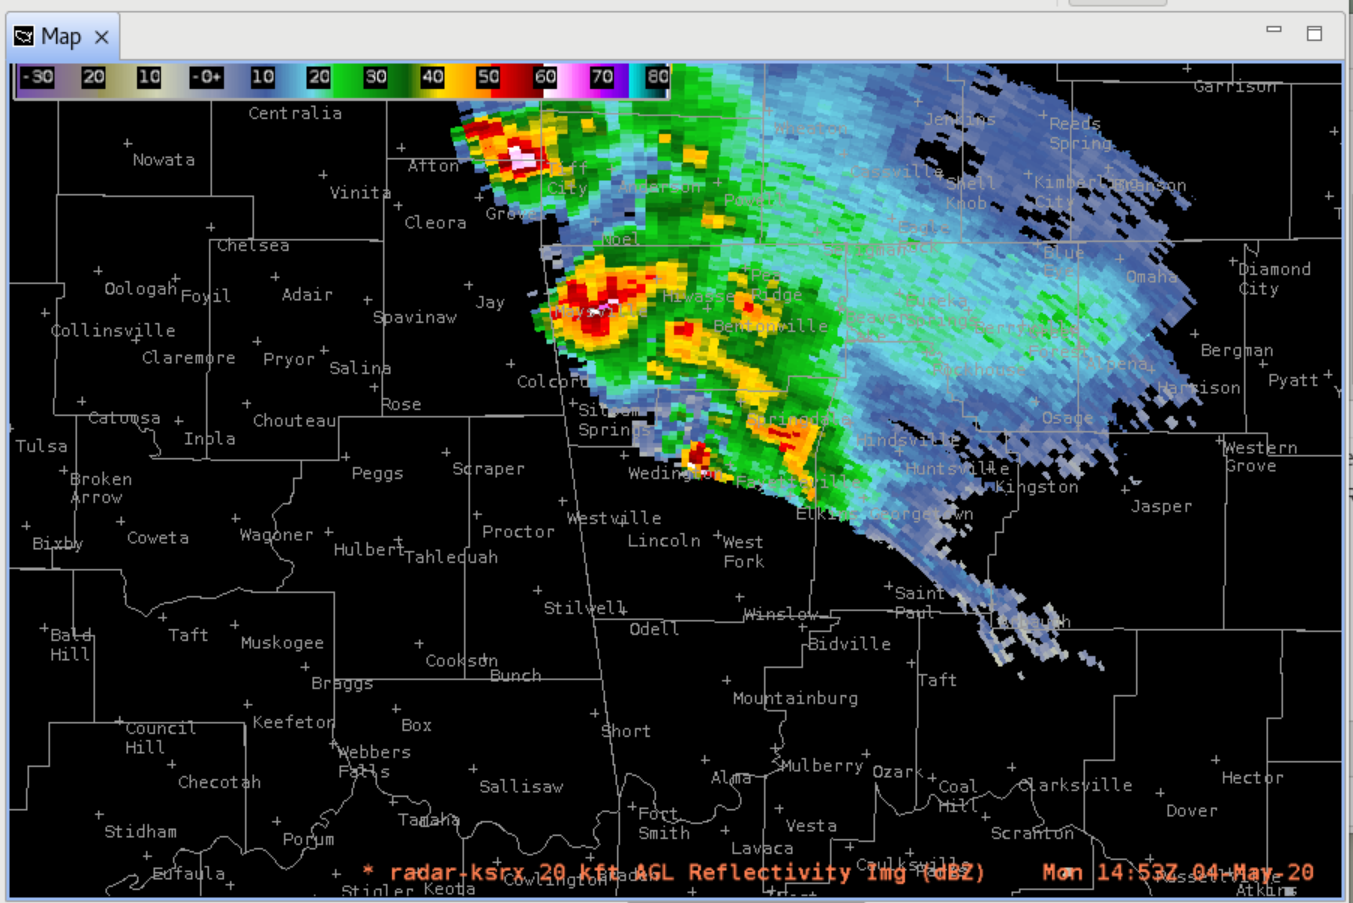
- Zoom in to the radar reflectivity product and notice how the radial nature of the data is still evident though it is not as sharp as data loaded from the radar menus.
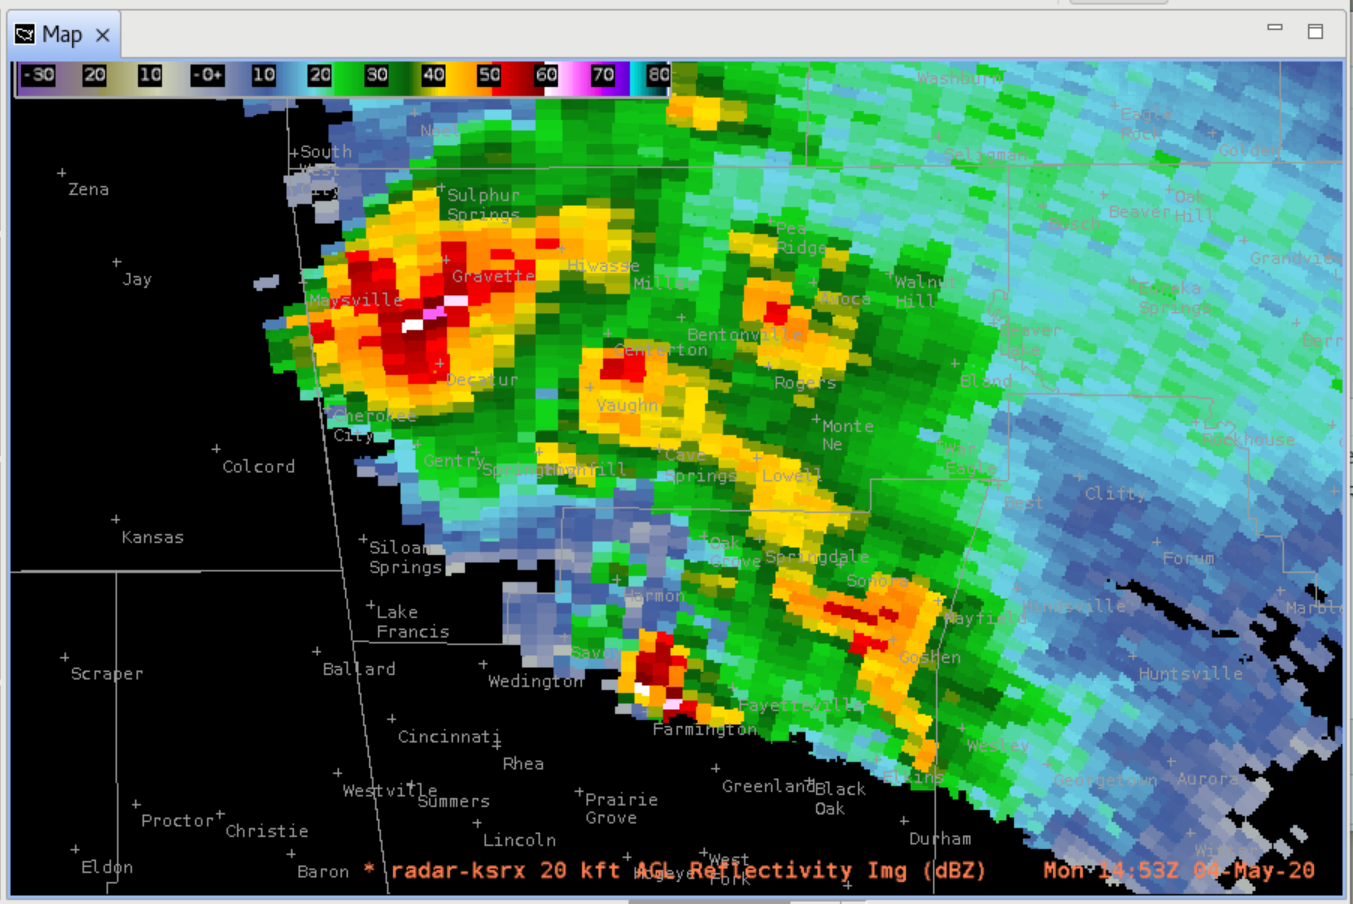
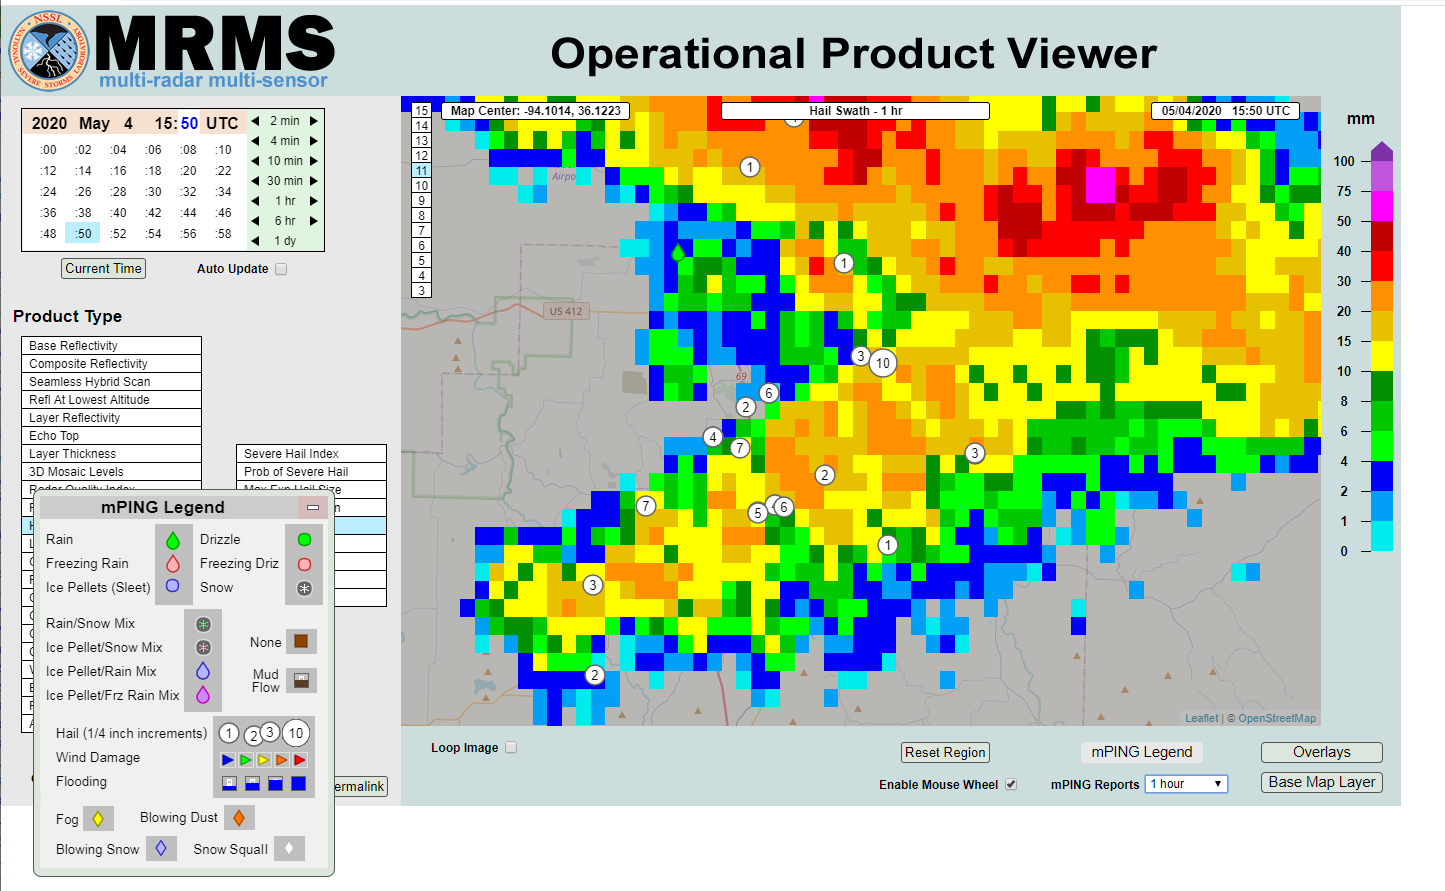
- This was a great example of a relatively less organized elevated storm (bottom central storm) producing numerous reports of giant hail (meatured 4"+ with time stamps) in Fayetteville, AR which was the largest hail of the day (larger than the well organized supercells to the north that "only" produced baseballs). MRMS was only suggesting 1" hail but there were a few gates of high reflectivity aloft in this marginal supercell storm to suggest some larger hail threat. It is not uncommon for MRMS to smooth out small peaks like this which can cause it to underestimate hail size. Unfortunately the operational product viewer archive does not go back far enough to resolve why MRMS was so low.
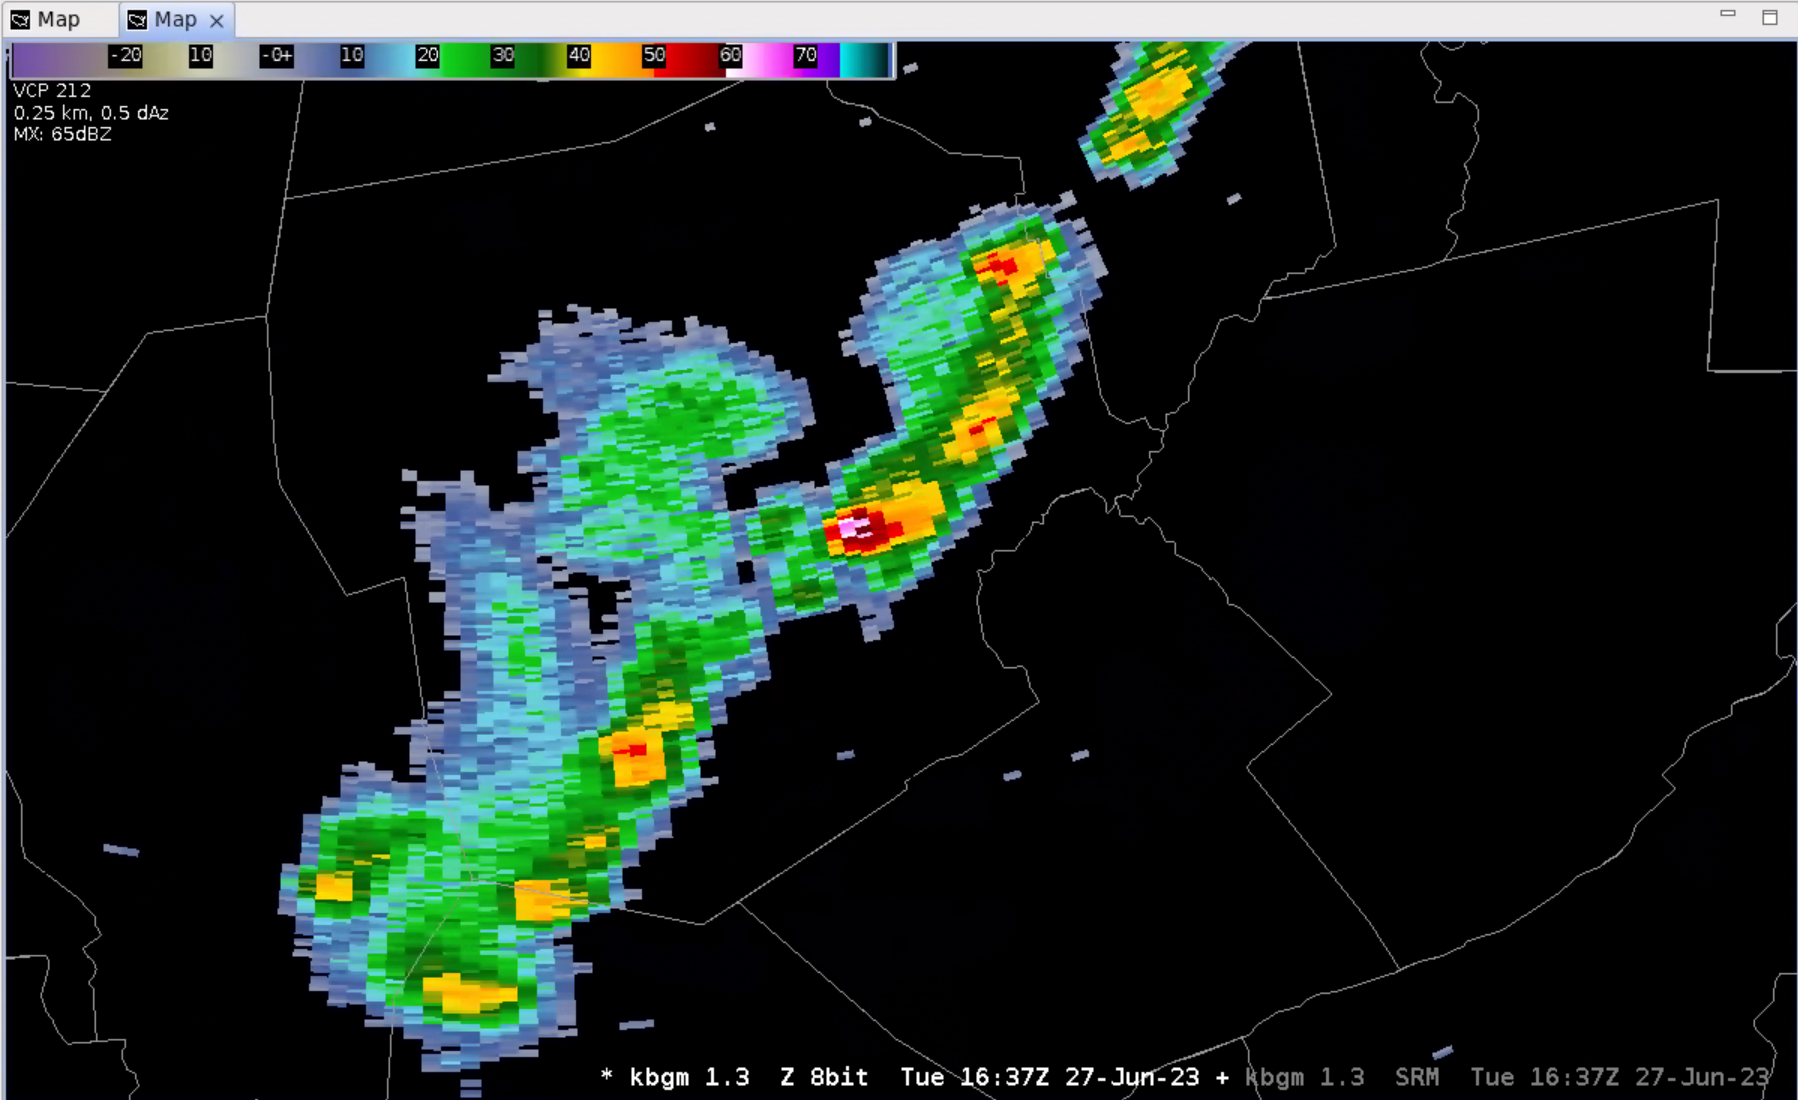
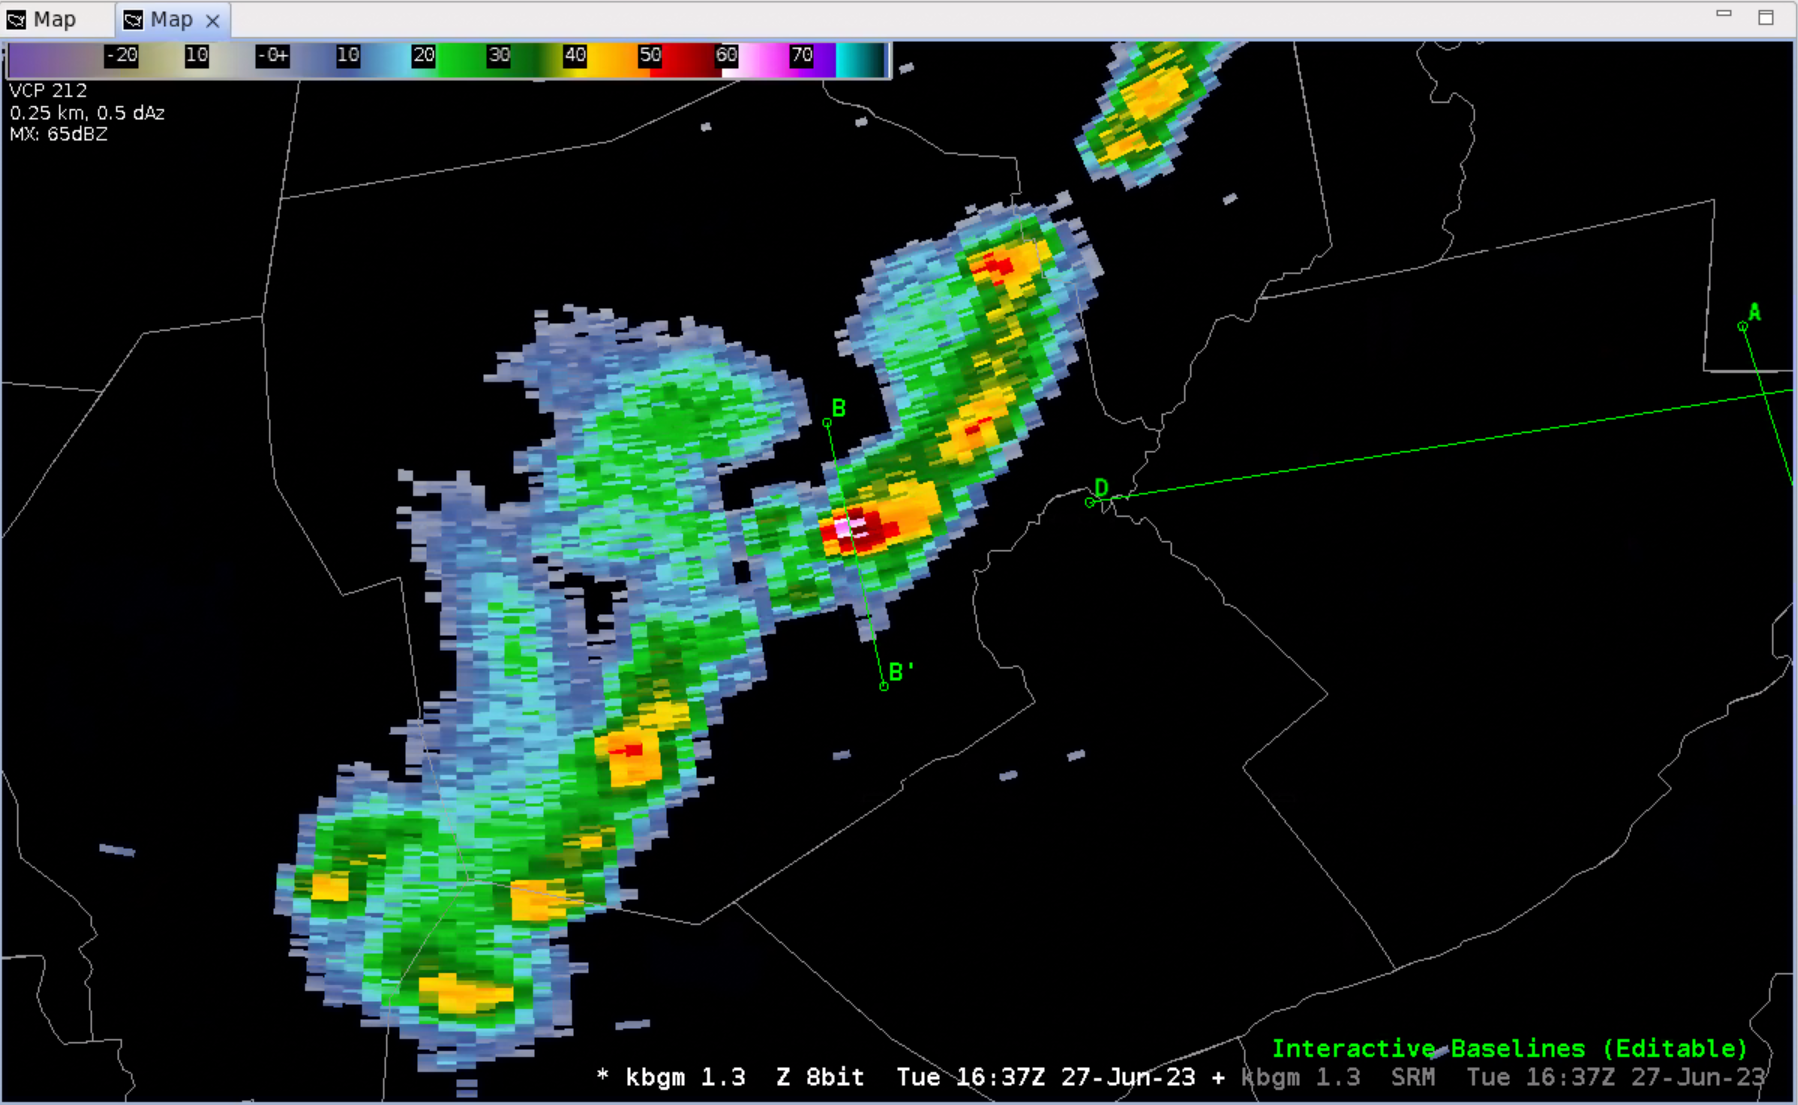
- Next we will load a cross section in the Volume Browser. In the D2D perspective load an all-tilts reflectivity image from the radar menu and find something to take a cross section on.
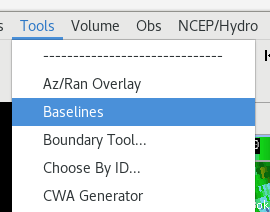
- Click on the Tools menu and load Baselines.
- To better see the baselines you might want to turn down the brightness in the radar image by doing a Ctrl + i to launch the image properties and dialing down the brightness to 70%. Next, right click on two points to define a cross section, and the baseline will grab one of the baselines and assign it to the last two mouse clicks.
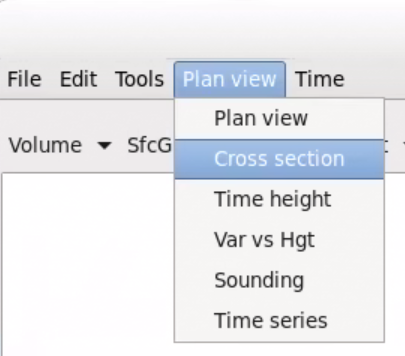
- In the VB, click on the Plan view menu and select Cross section.
- Under the Sources Volume menu select your desired local radar from the Radar submenu.
- In the Fields section select Other. Then select Reflectivity.
Note: if you have any problems crop up accessing certain products you can always click on the Edit menu in the VB and clear the appropriate fields.
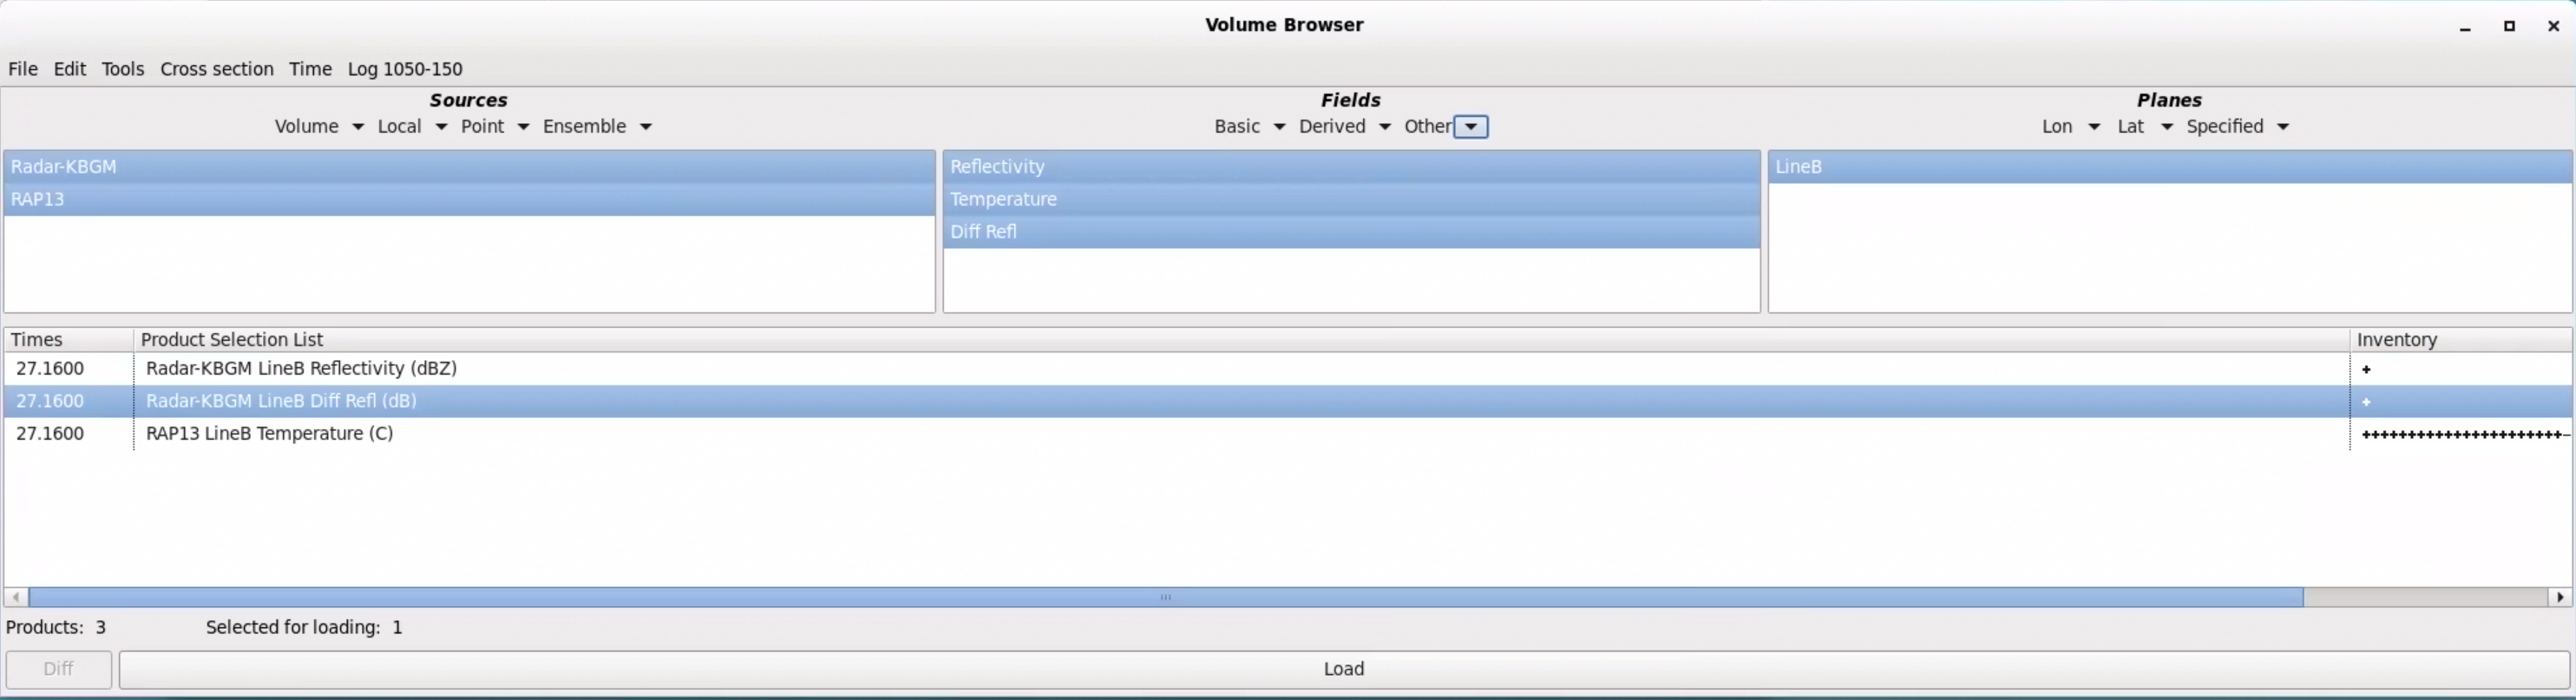
- Under the Sources menu and Volume menu select RAP13, so we can overlay temperature (image).
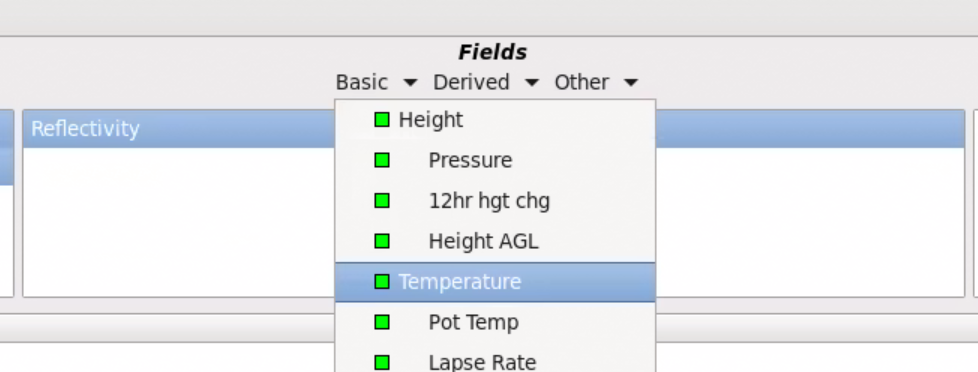
- In the Fields section under the Basic menu select Temperature (image).
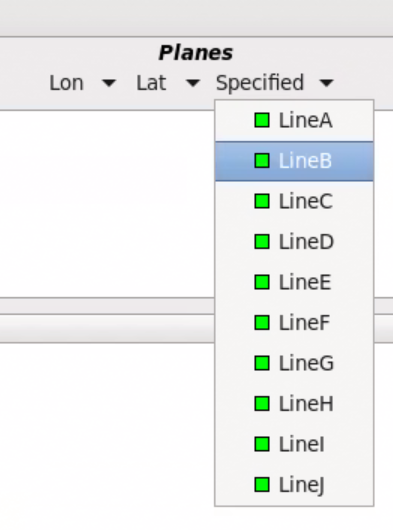
- In the Planes section click the Specified menu and select your baseline (image).
- Click on the Load button.
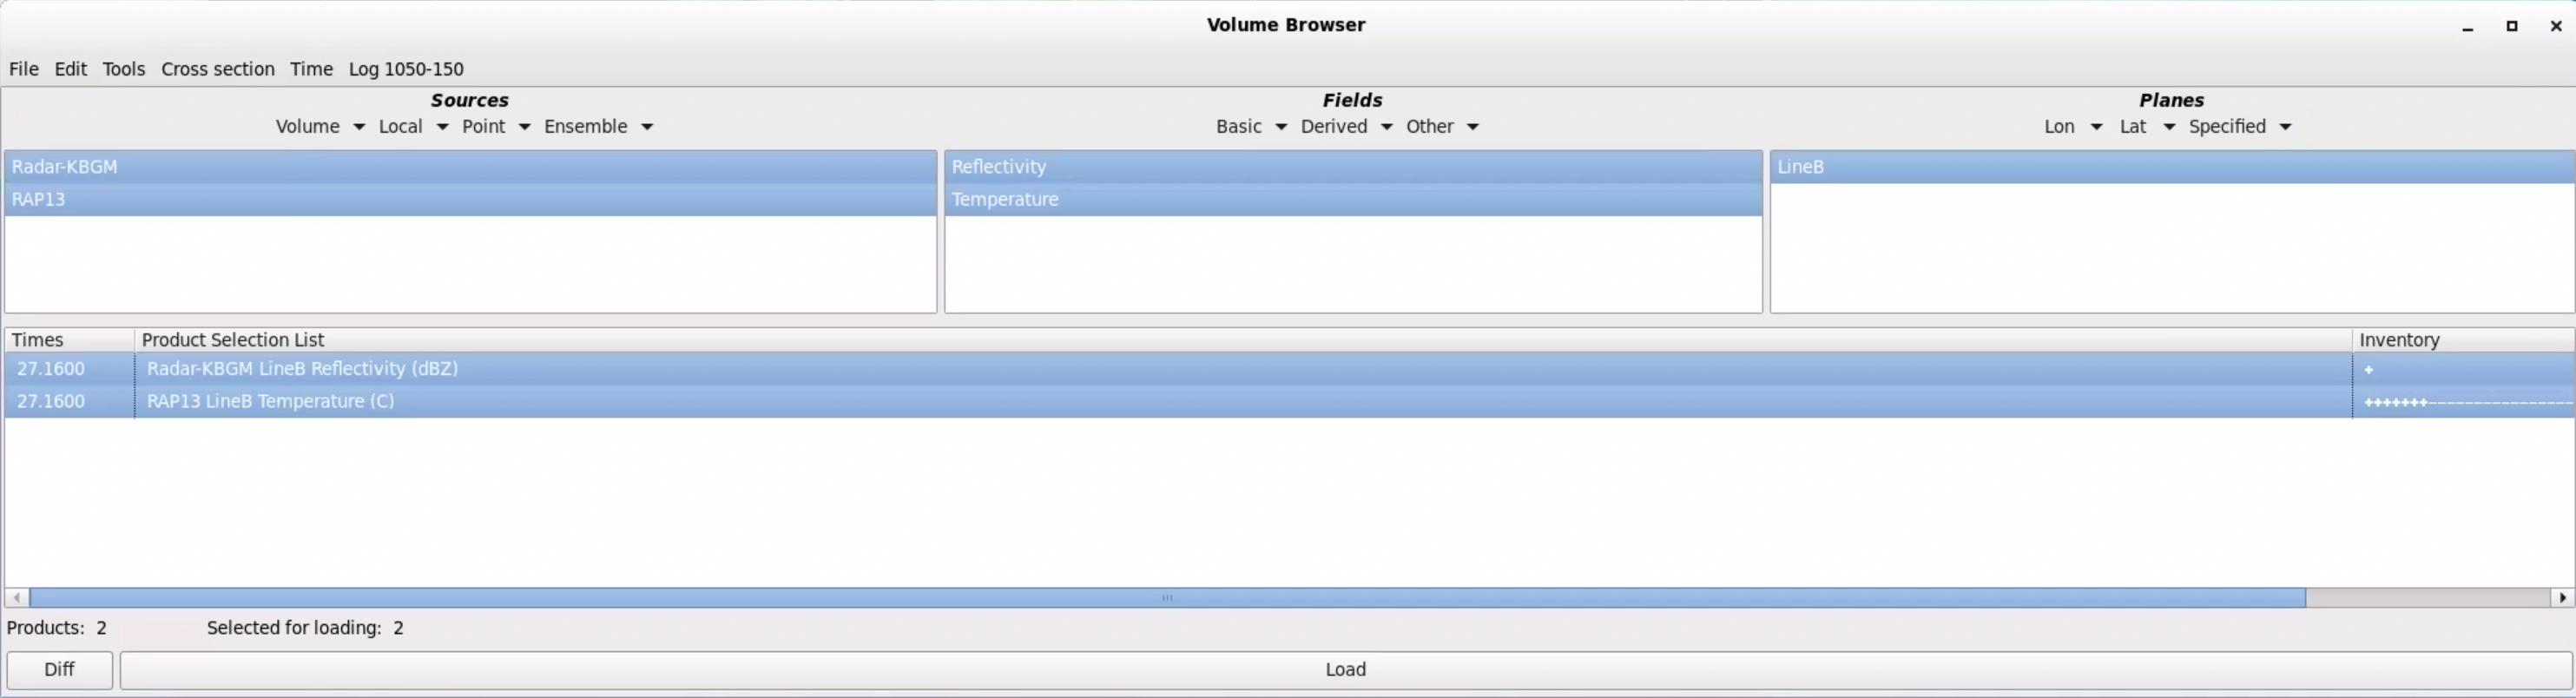
- You should receive a contour product.
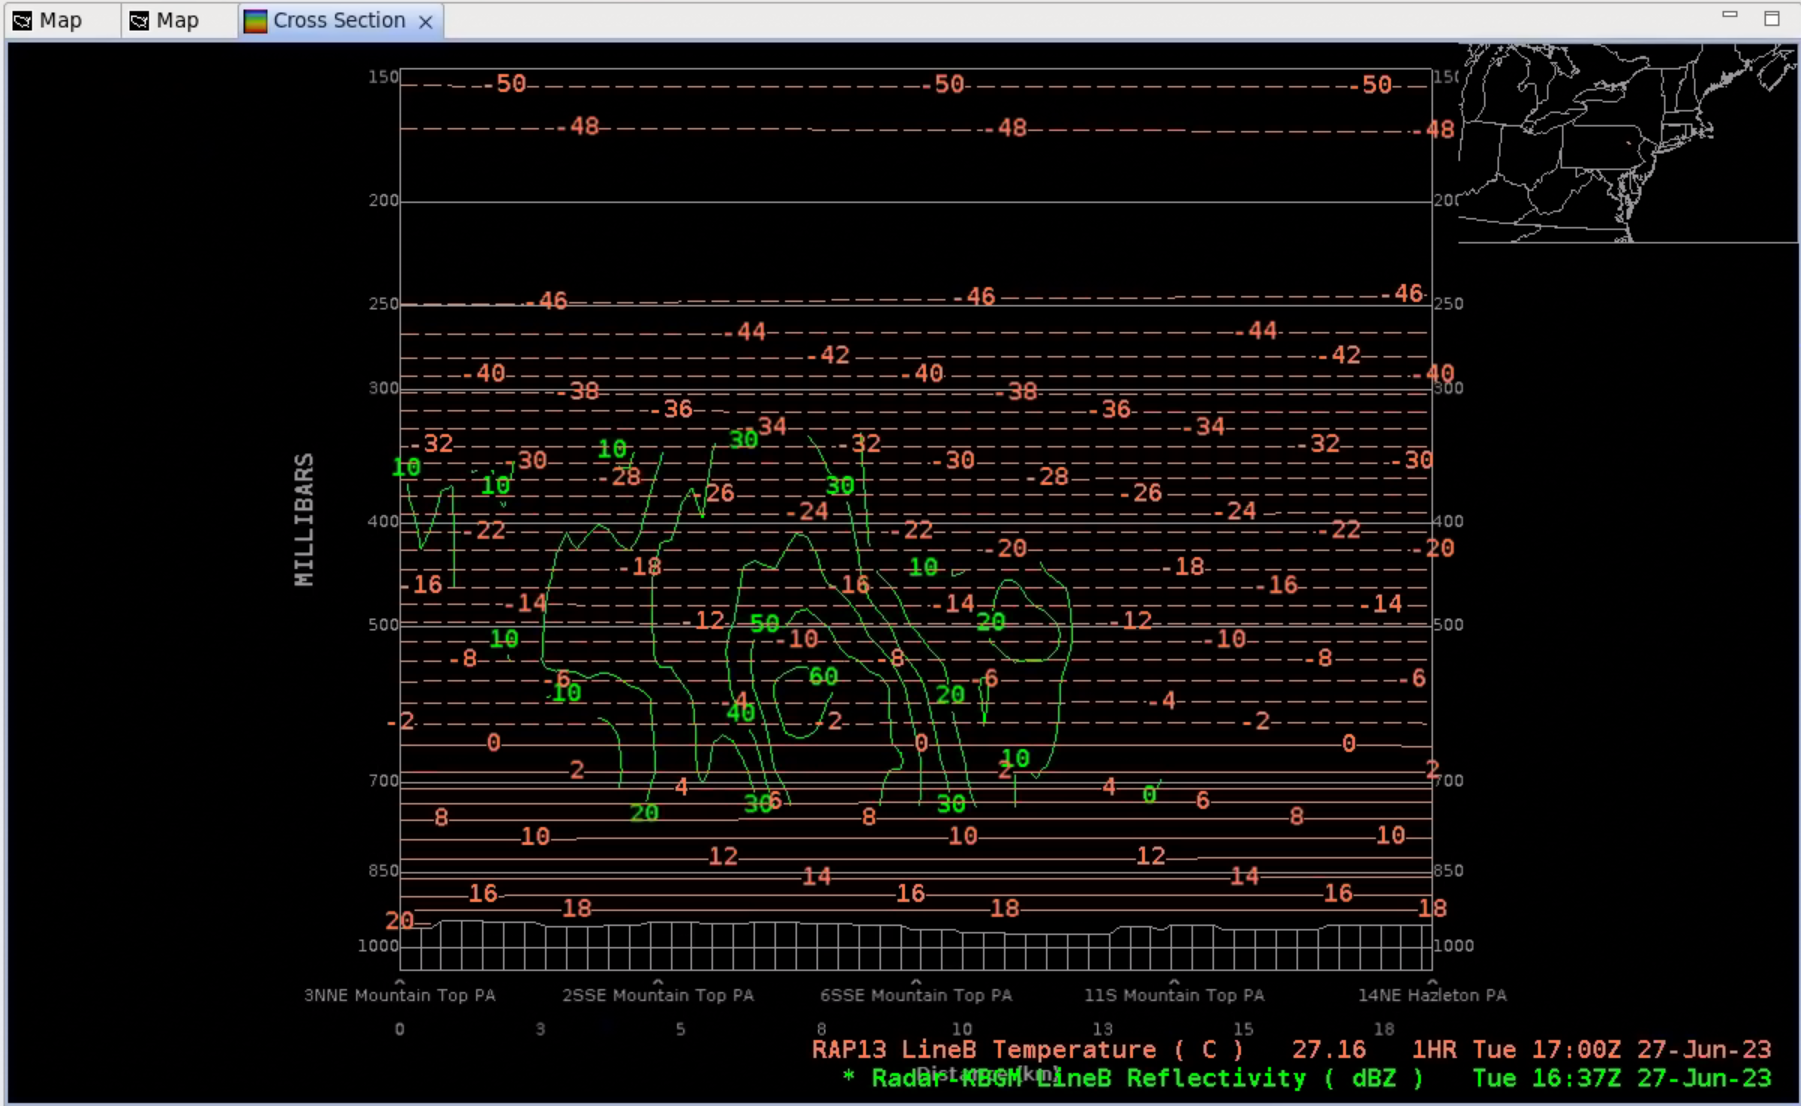
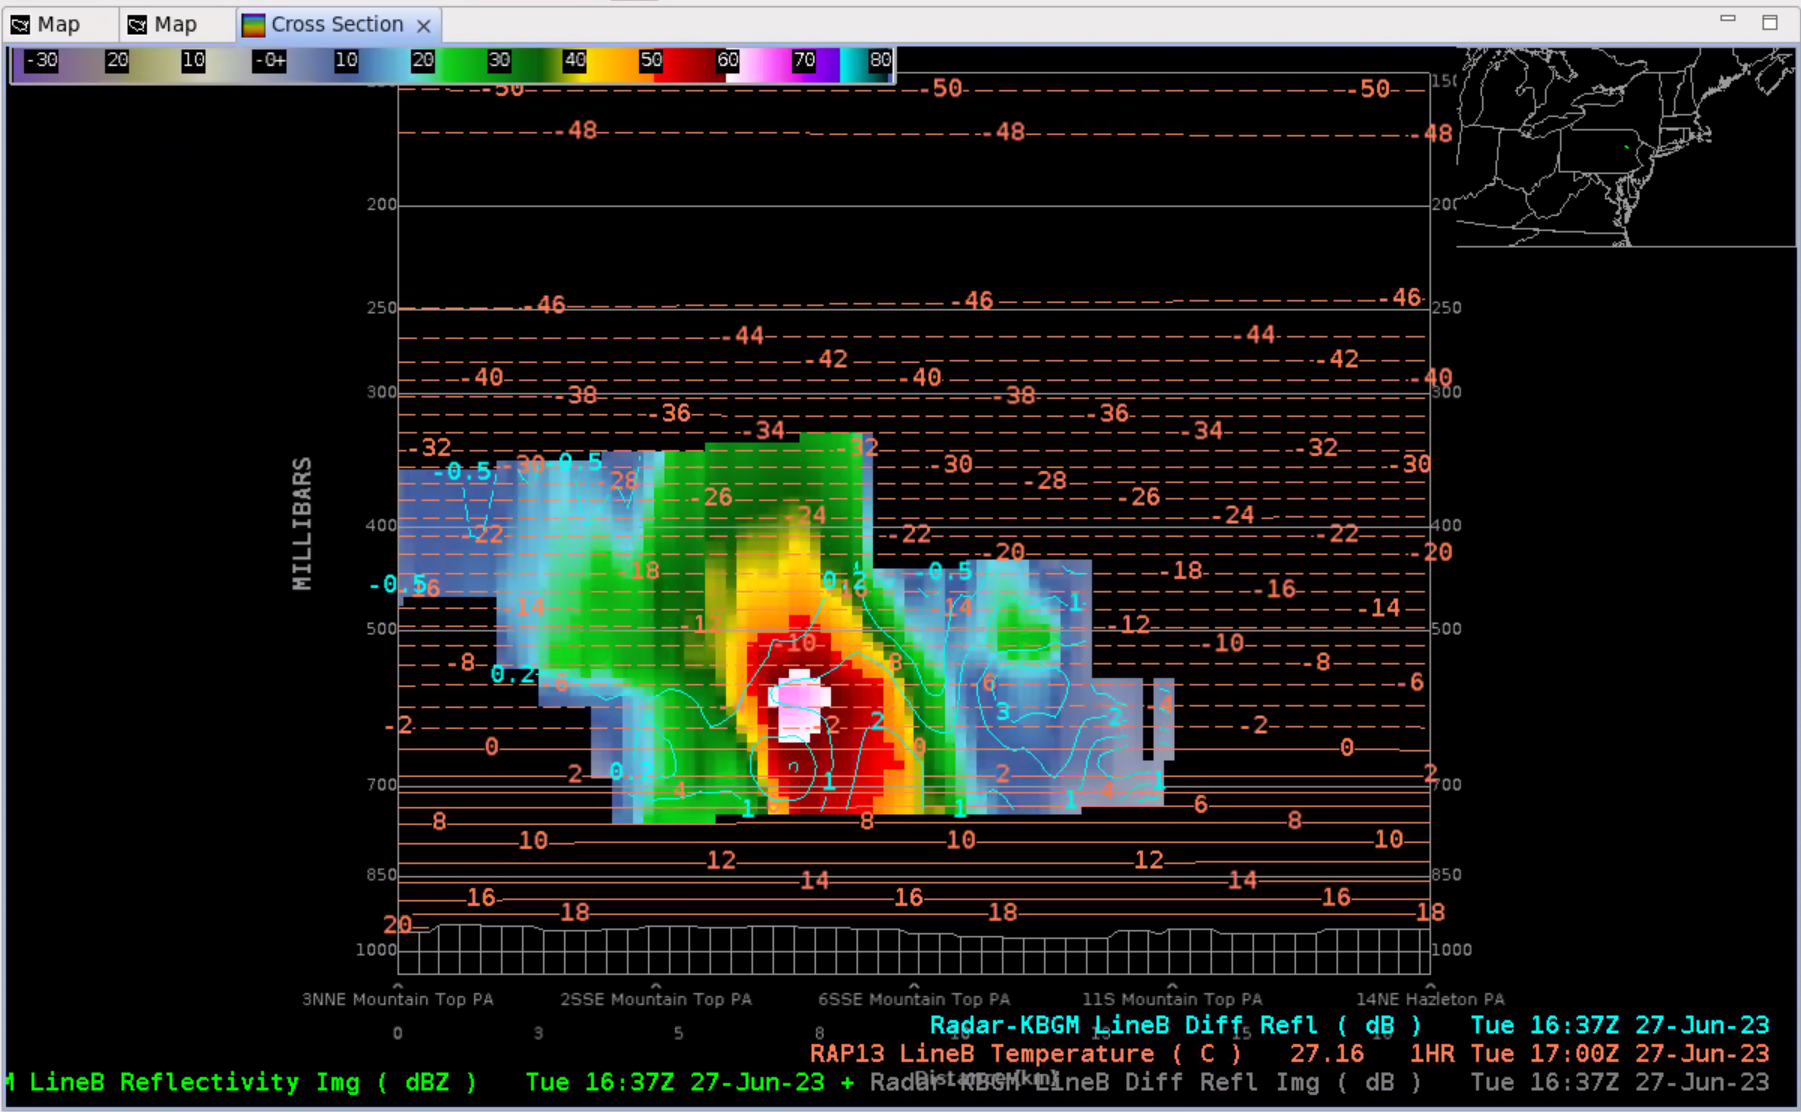
- Right click on the reflectivity product legend and select Load as Image.
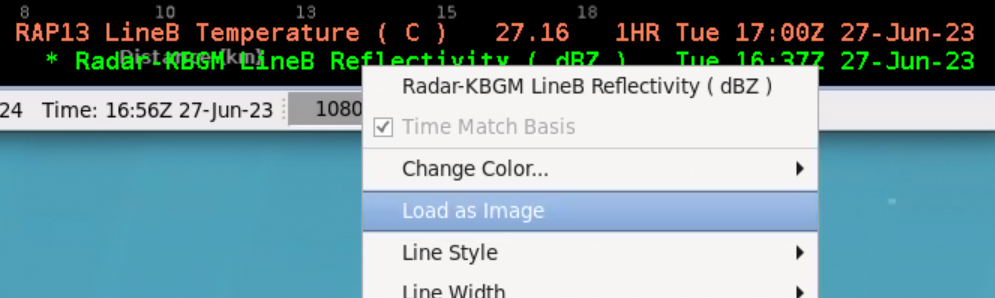
- You should see a reflectivity image.
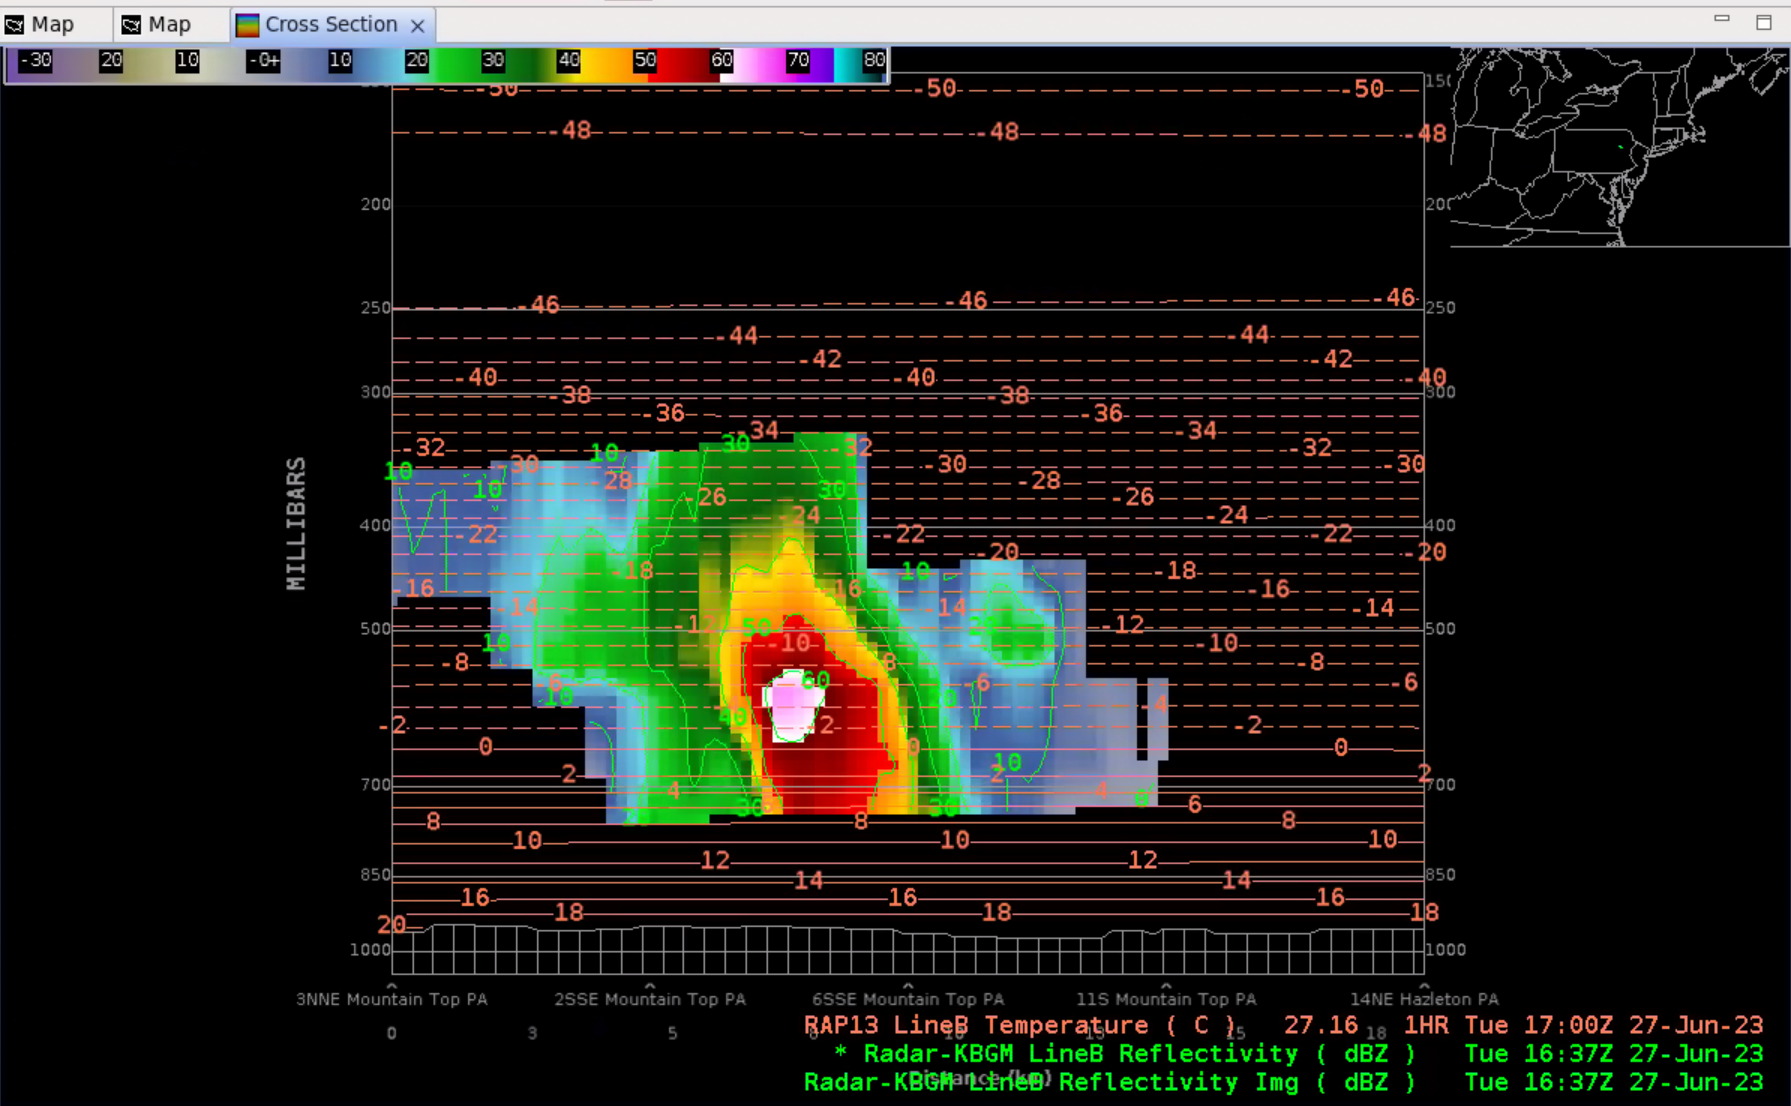
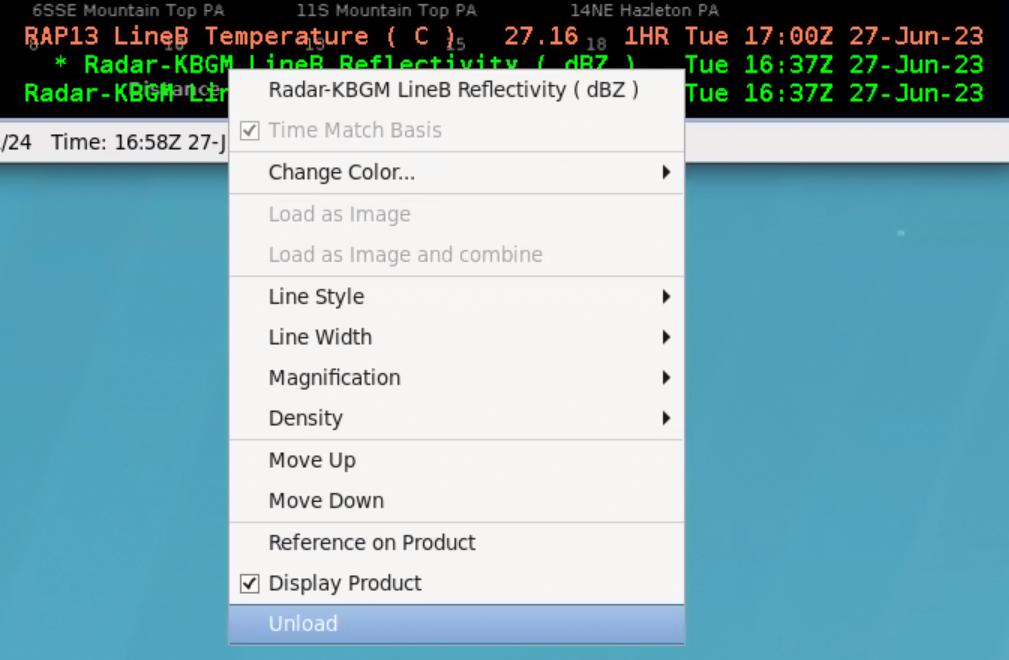
- Unload the reflectivity contour by right clicking on the contour product text legend and select Unload (image).
- You should be left with two product legends.
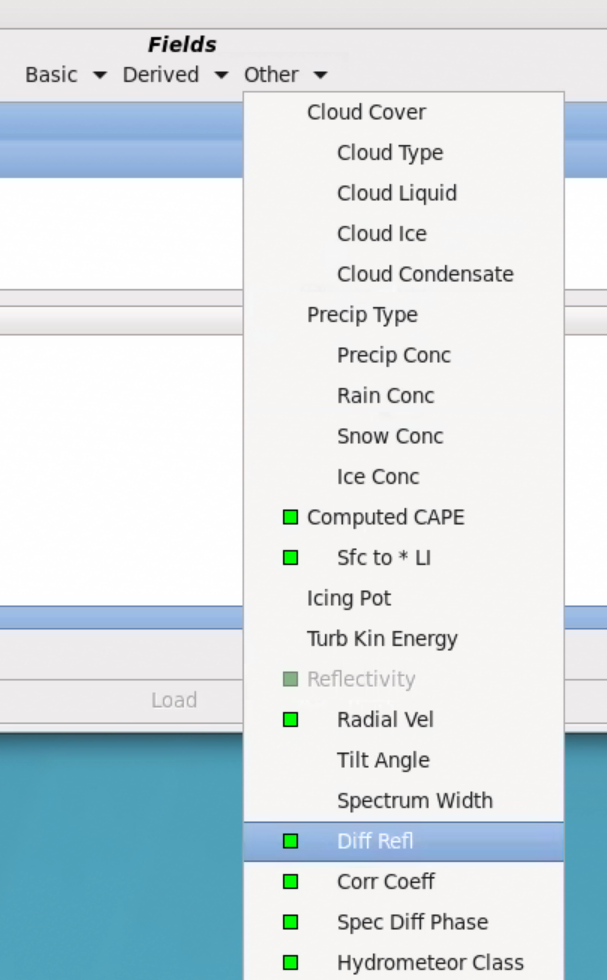
- To add Zdr you can go back to the VB and under the Fields section and Other menu select Diff Refl.
- Select Load.
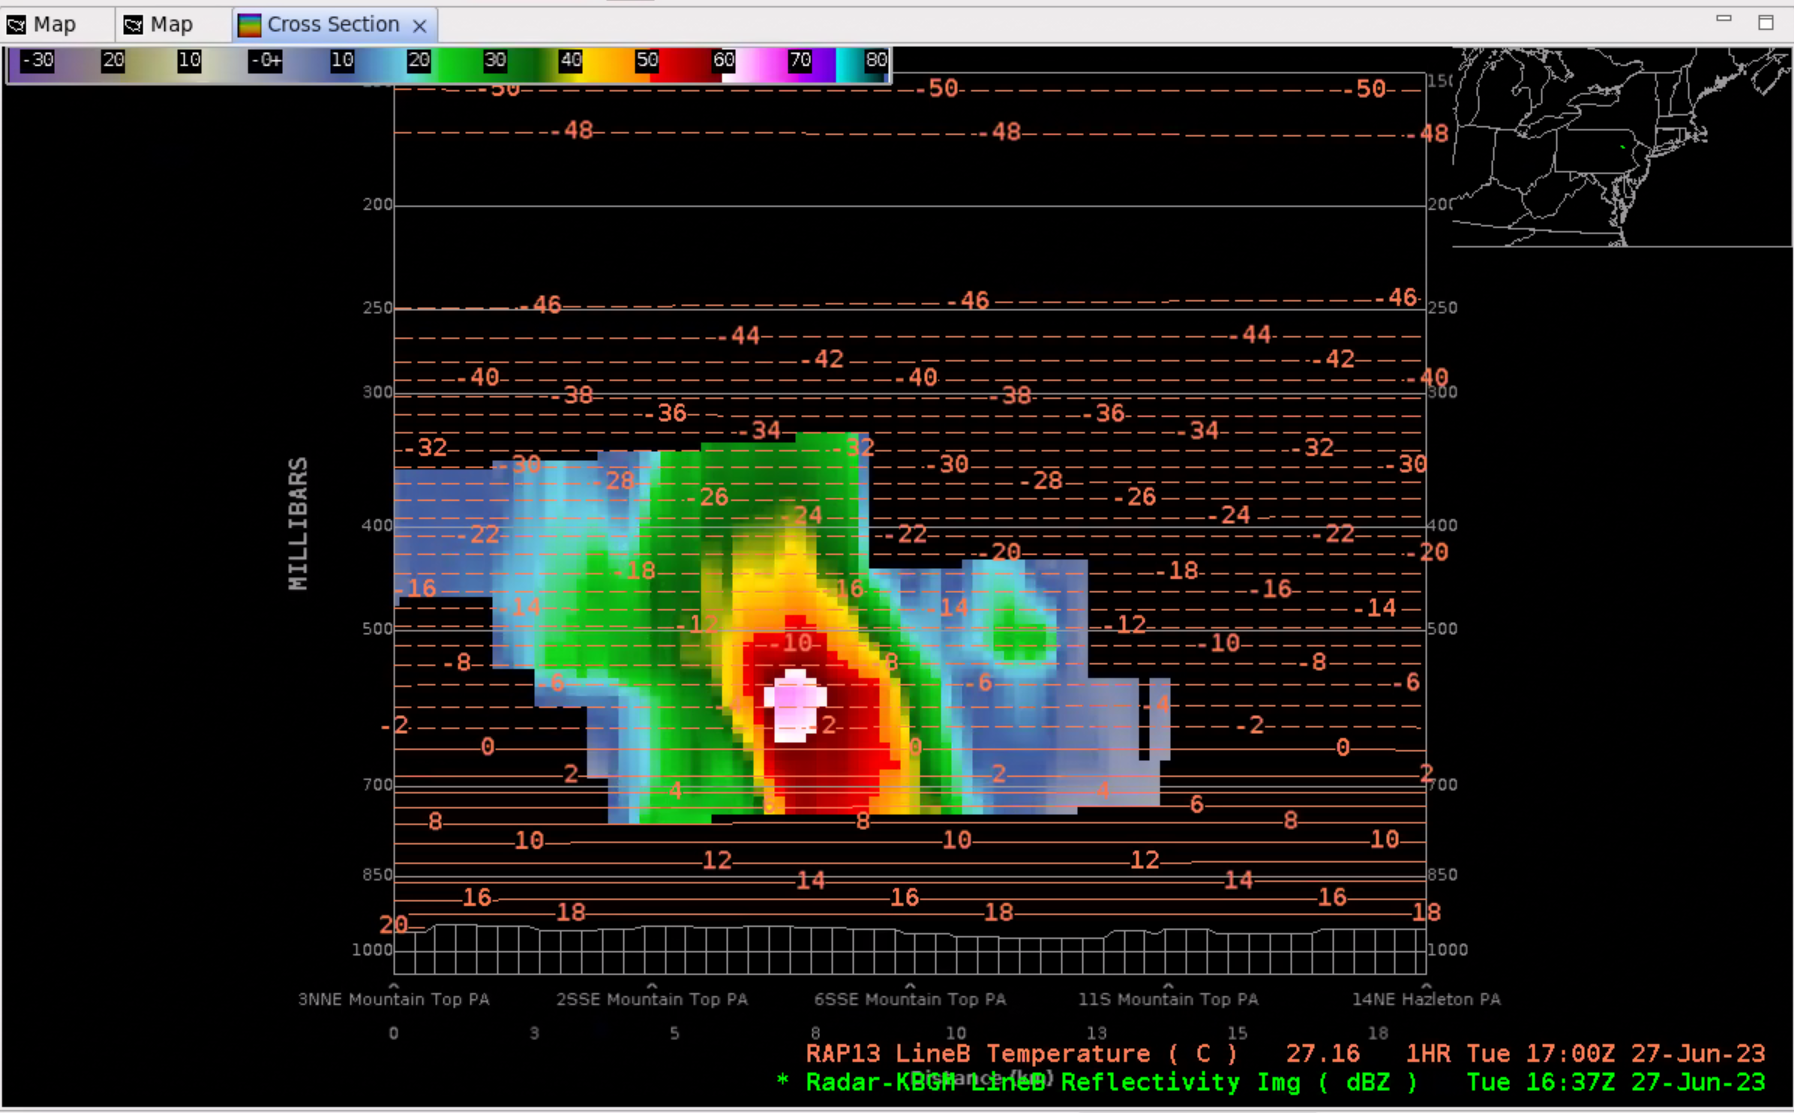
- The Zdr contour should overlay the cross section. This is a novel way of overlaying Dual-Pol variables on base data to identify things like updraft locations from Zdr columns (e.g. where Zdr>1 and T<0).

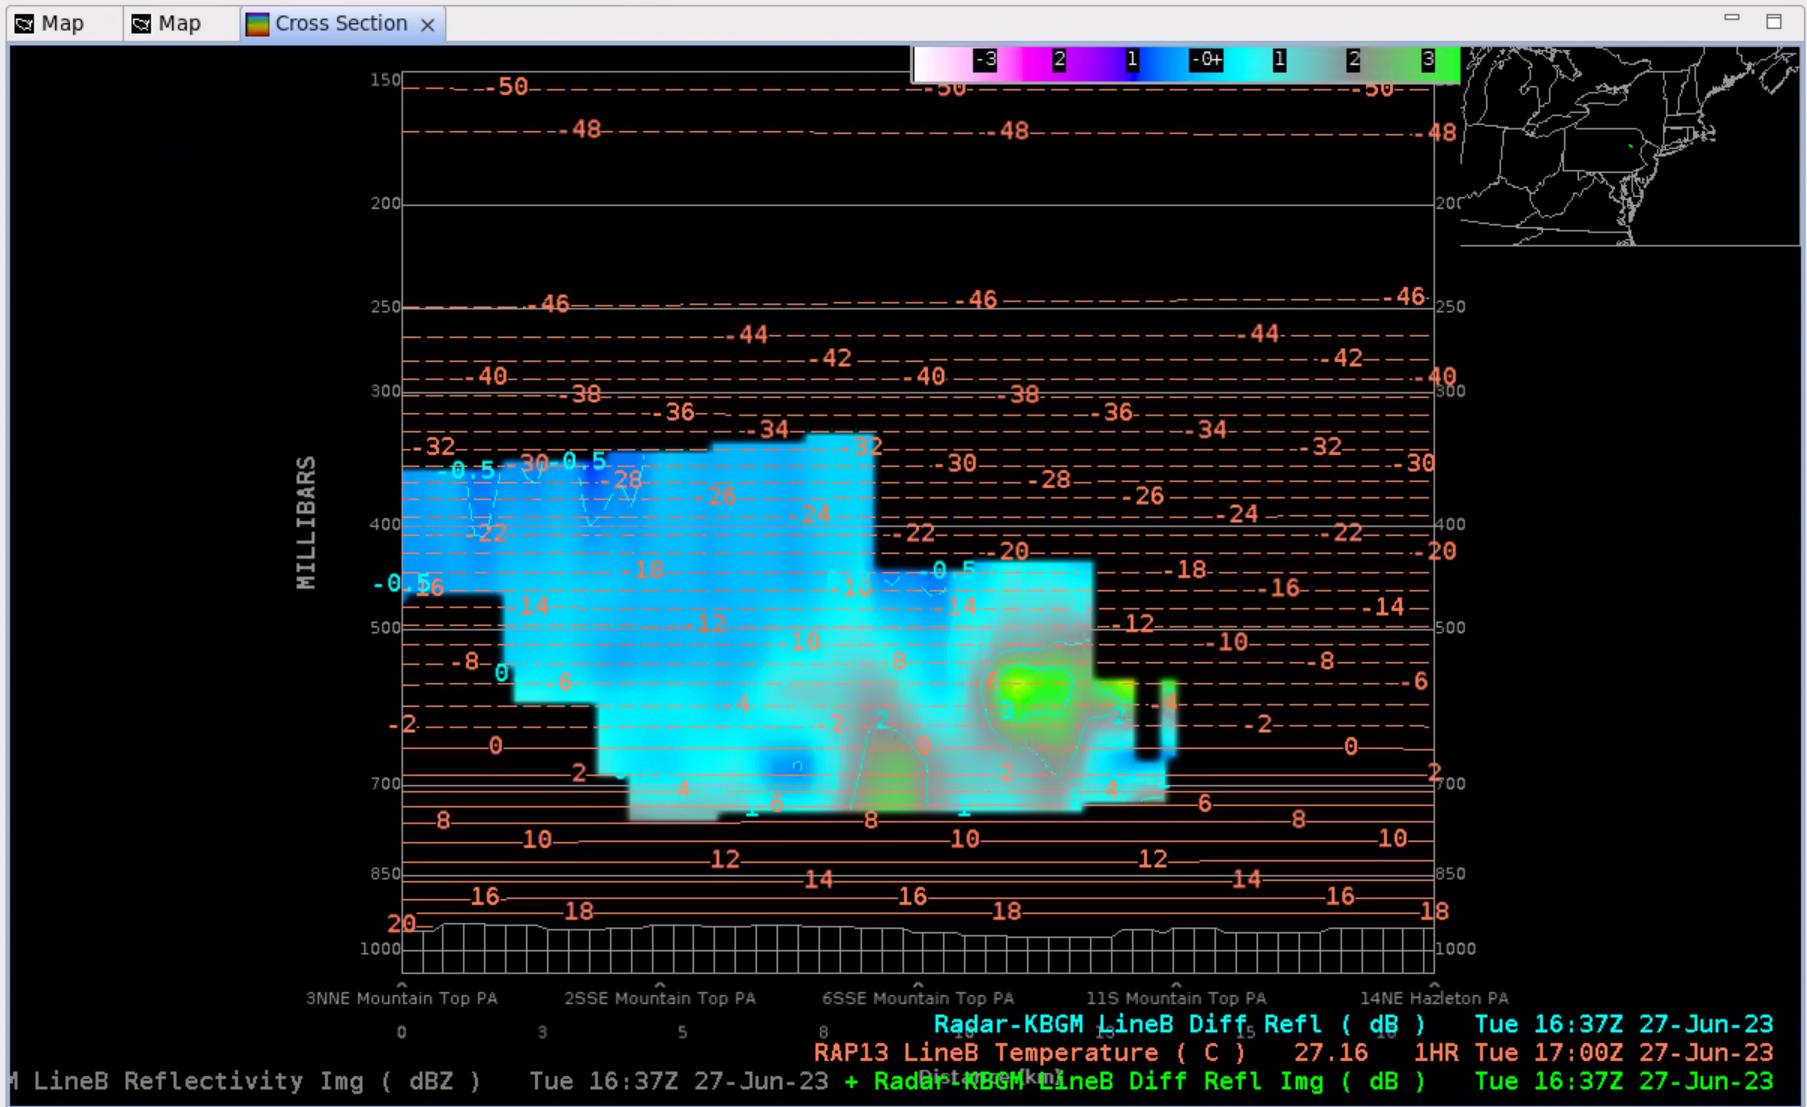
- To make a paired product, you can right click on the Diff Refl text legend and select Load as Image and combine.
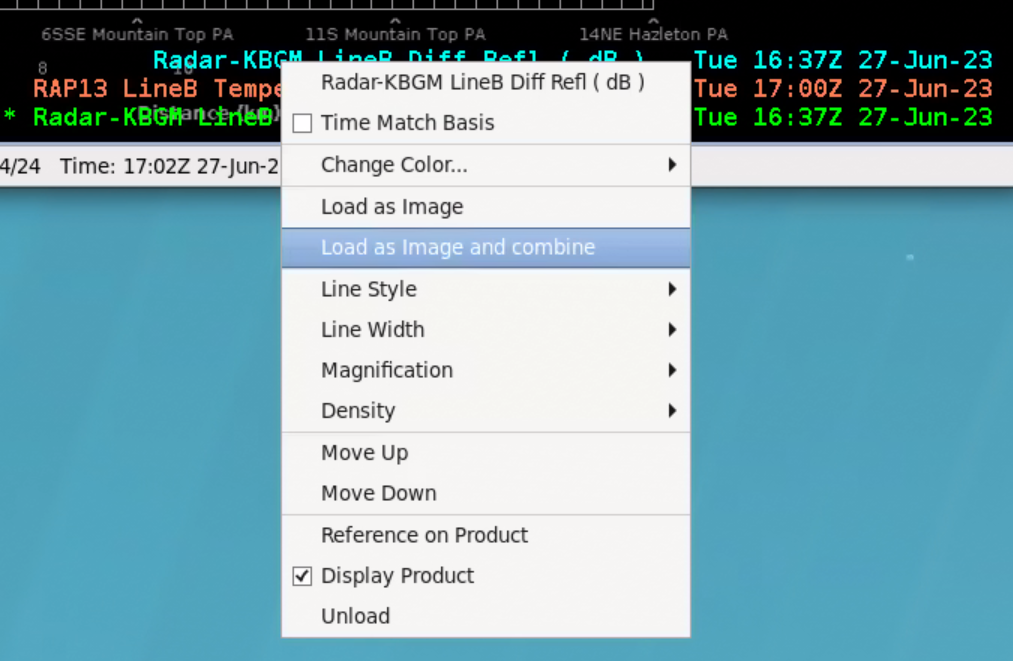
- Use the . key on the keypad to toggle side A and B of the image combination. You could also load more Dual-Pol products and stack them after using Load as Image without using Load as Image and combine, so you could use the keypad to toggle between them.
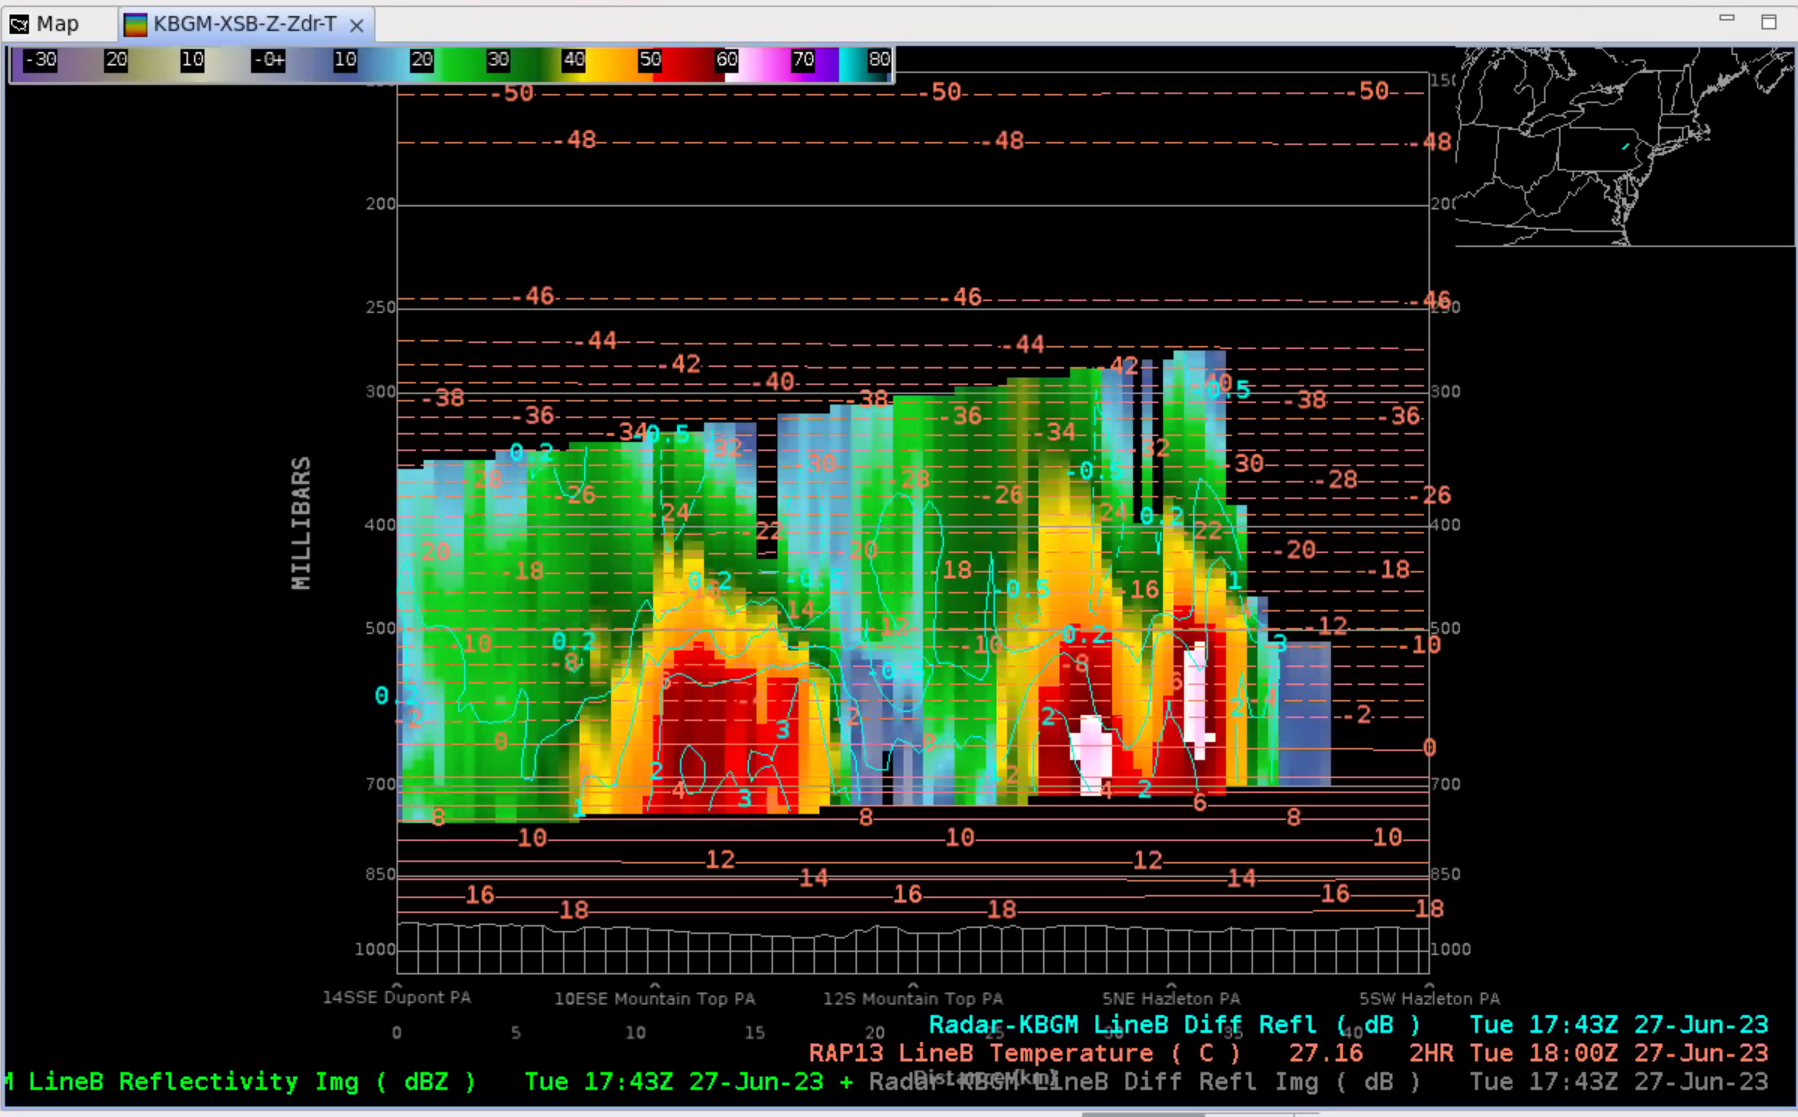
- Once you make a cross section that you like for a particular baseline you can save it to a procedure. It is best to give it a short name to keep the tab label small and useful (e.g. KBGM-XSB-Z-Zdr-T). Then you can move it to a new location to launch and not have to worry about converting the contour to an image, etc.
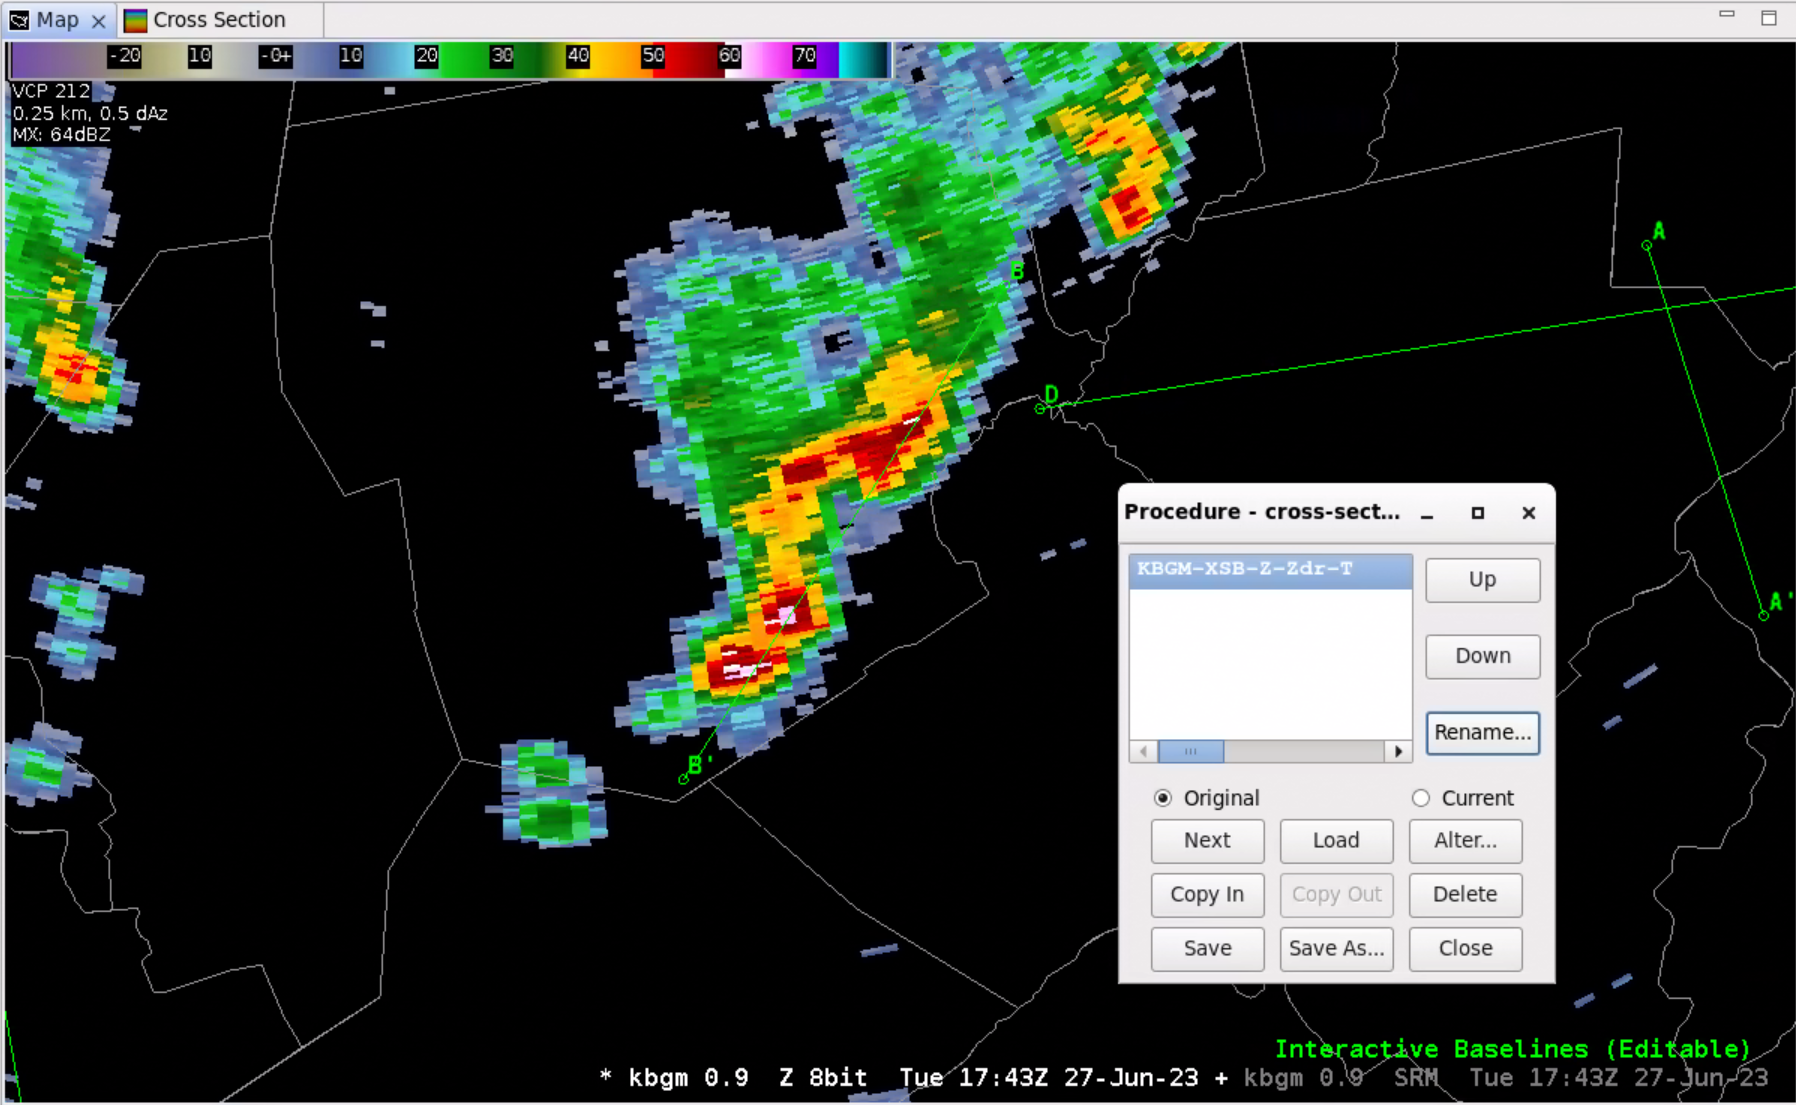
- On the procedures window, the Alter button can be used to select a different baseline or radar if you want to generate baselines on the fly with two successive mouse clicks and then apply the procedure to that baseline. The alternative is to move the original baseline.


