


Color Maps - OCLO
Default Jobsheet Viewer
Purpose:
This task demonstrates how to create Color Maps and shows where to put them.Tasks:
Assumptions:
- A Scalar or Vector Weather Element grid is displayed in GFE.
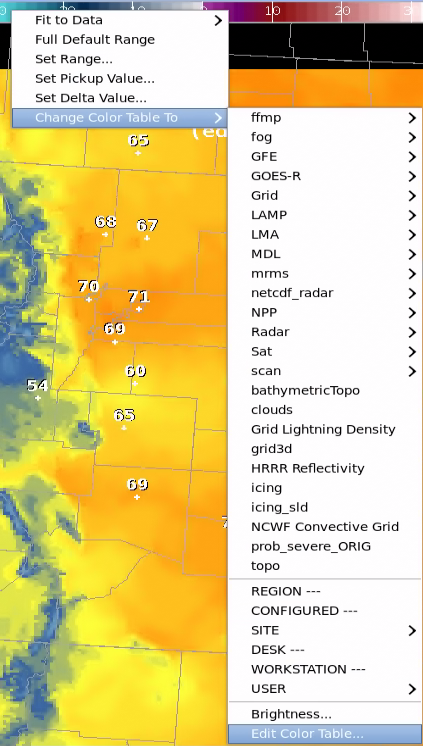
- Right-click on the Color Bar, then scroll down to or left-click Change Color Table To, then left-click Edit Color Table... .
- Use the half arrows (located at opposite ends of the Color Bar and circled in white) to modify the Color Bar.
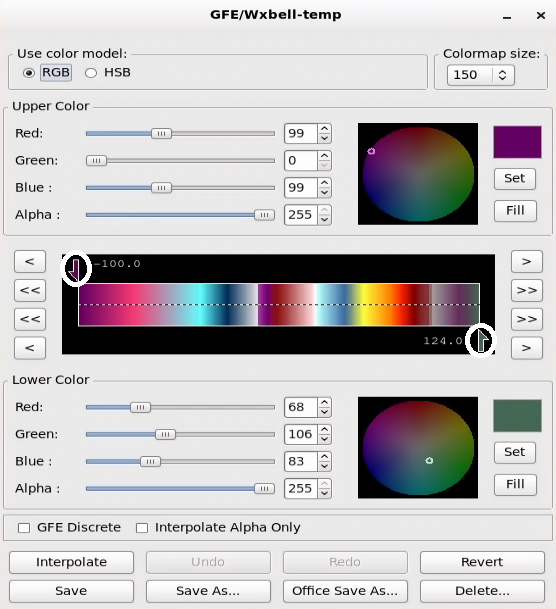
- Move the arrows to somewhere in the middle.
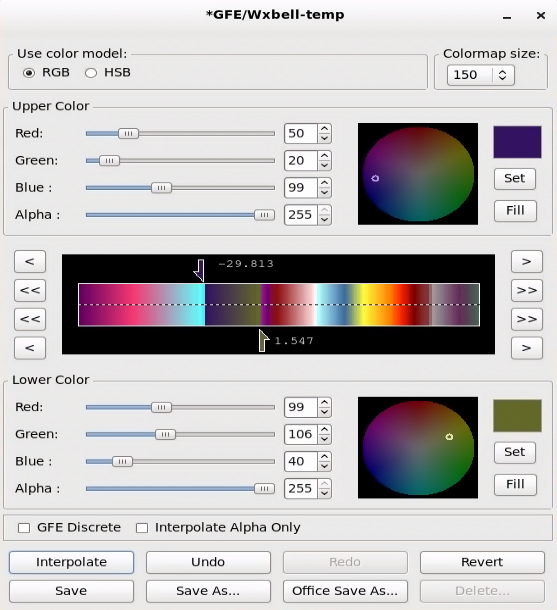
- For the Upper Color change Red to be 50 and Green to be 20 by either typing the number in the box, using the scroll bar, or using the arrows to the left of the scroll bar and left-click Set.
- For the Lower Color change Red to be 99 and Blue to be 40 by either typing the number in the box, using the scroll bar, or using the arrows to the left of the scroll bar and left-click Set.
- Left-click Interpolate.
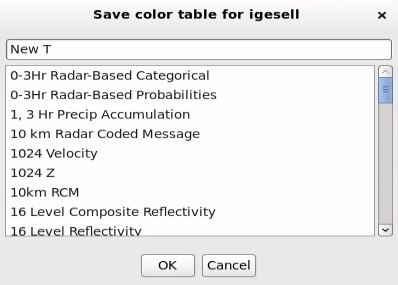
- Left-click Save As... .
- Type a name (e.g., New T) in the dialog box that popups and left-click Ok.
- Make sure that the Color Map you just created is located in the /awips2/edex/data/utility/common_static/user/username/colormaps/ directory where username is your username.
- Task Complete!