


ARI Comparison - OCLO
ARI Comparison
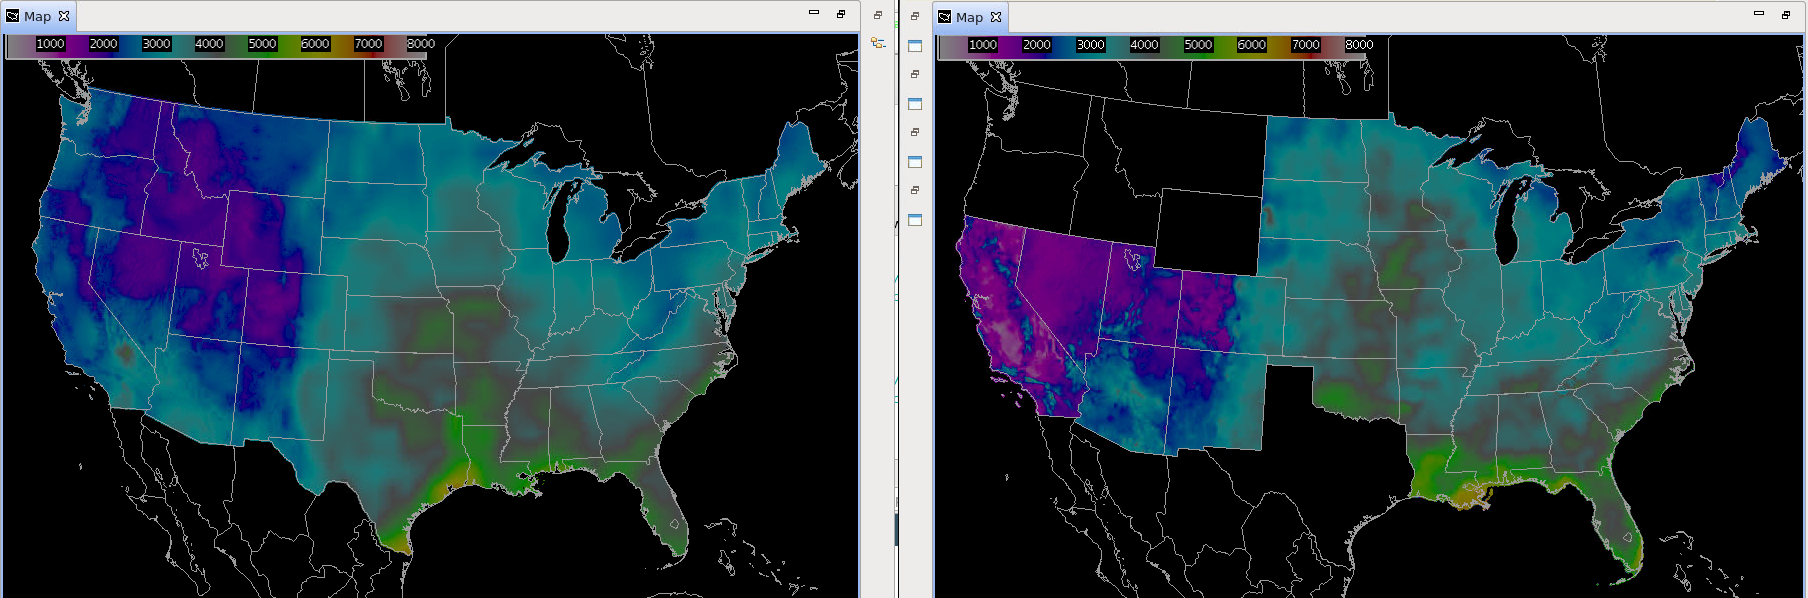
The original ARI dataset that was fielded with 16.1.1 did not have coverage for TX and the northwest US, and NSSL created a new ARI by blending the old NOAA Atlas 14 data with temperature climatological data. NSSL's new ARI is used in FLASH, and the old ARIs are likely being used in AWIPS and FFMP.
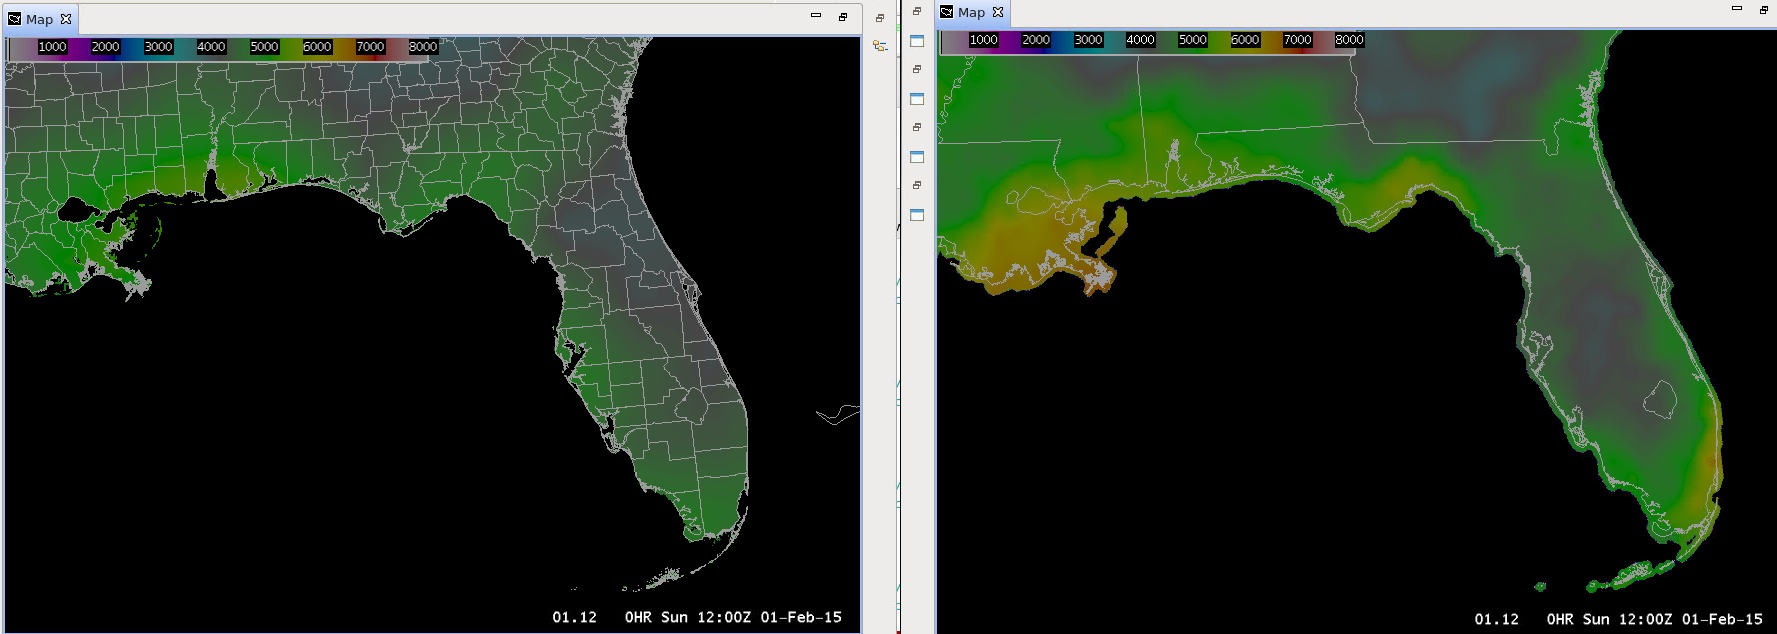
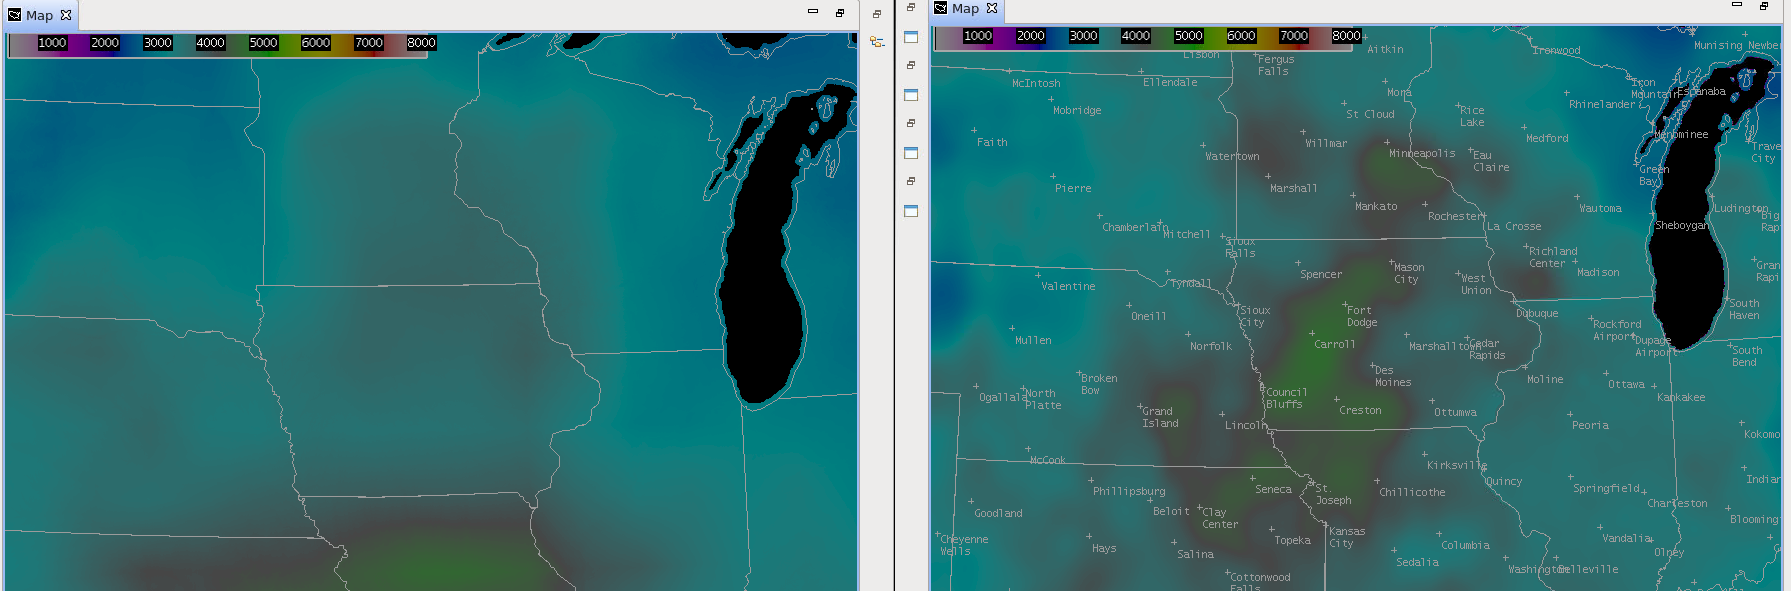
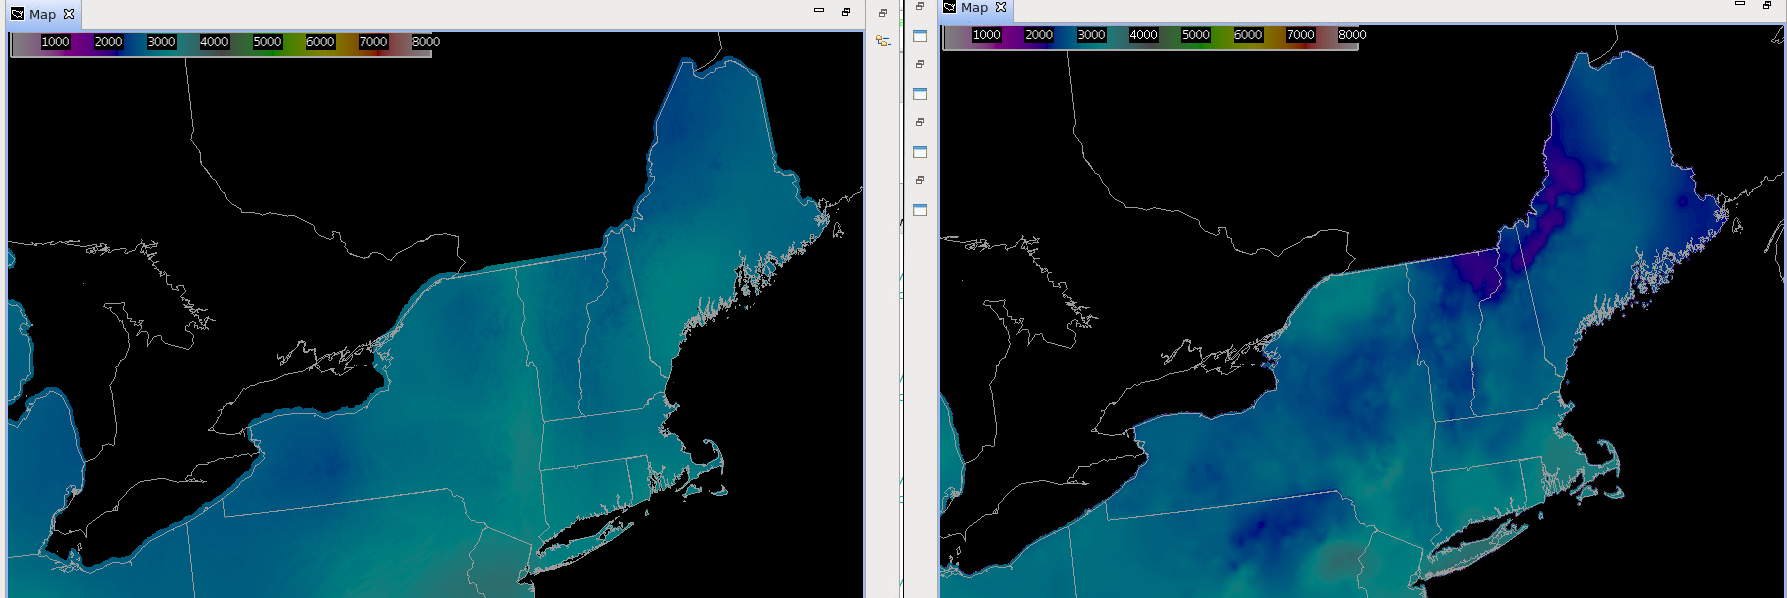
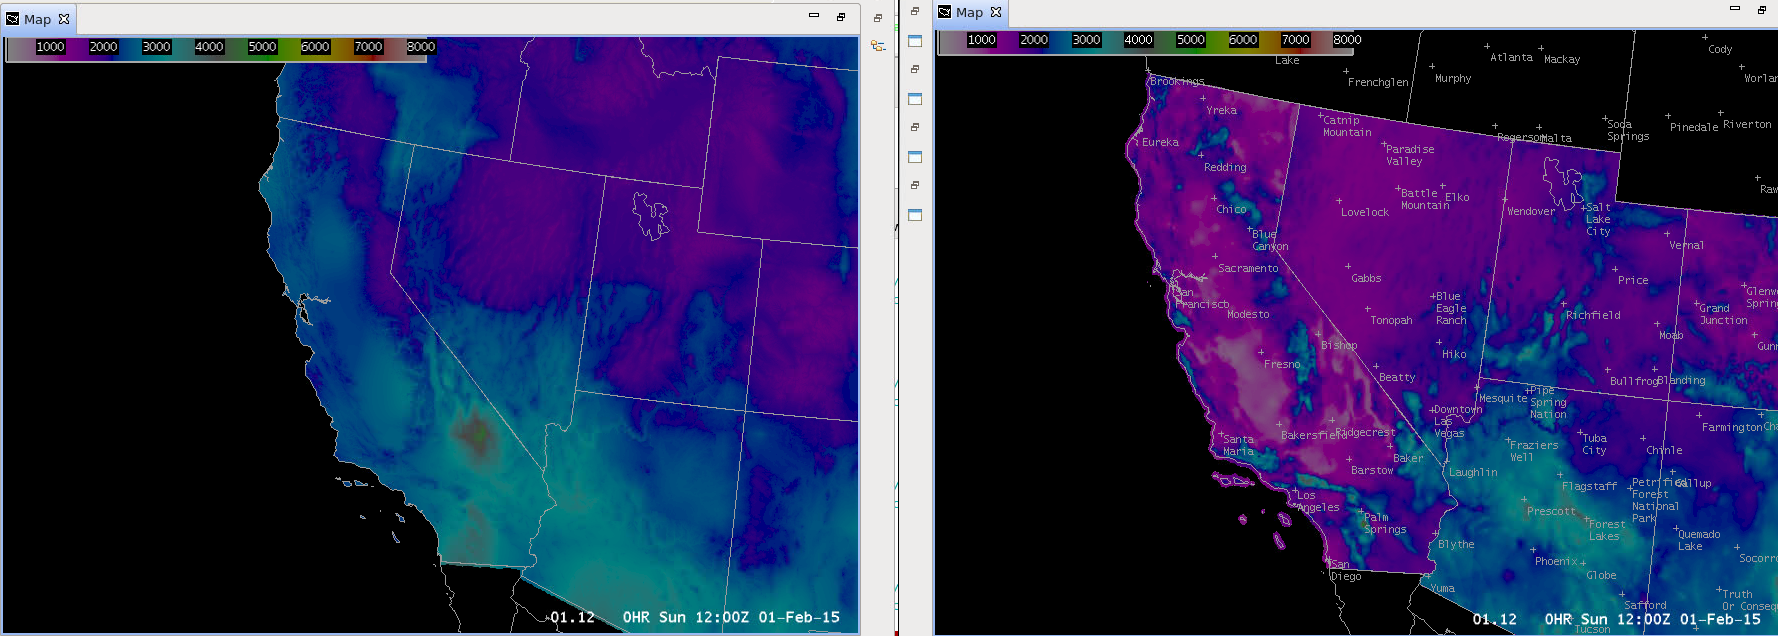
Here is an example of some of the differences in ARIs for a 1hr duration and 200 year recurrence interval:
Some notable differences include:
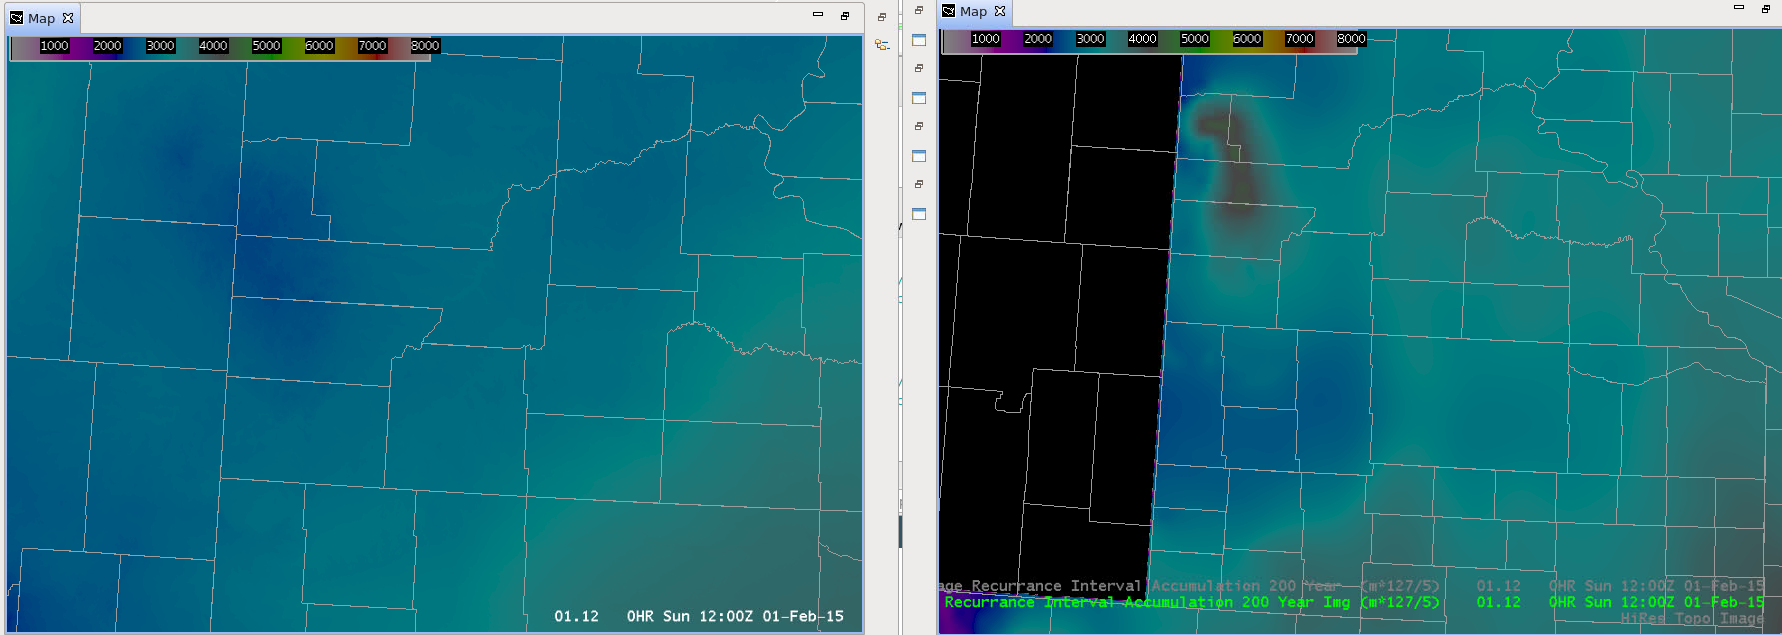
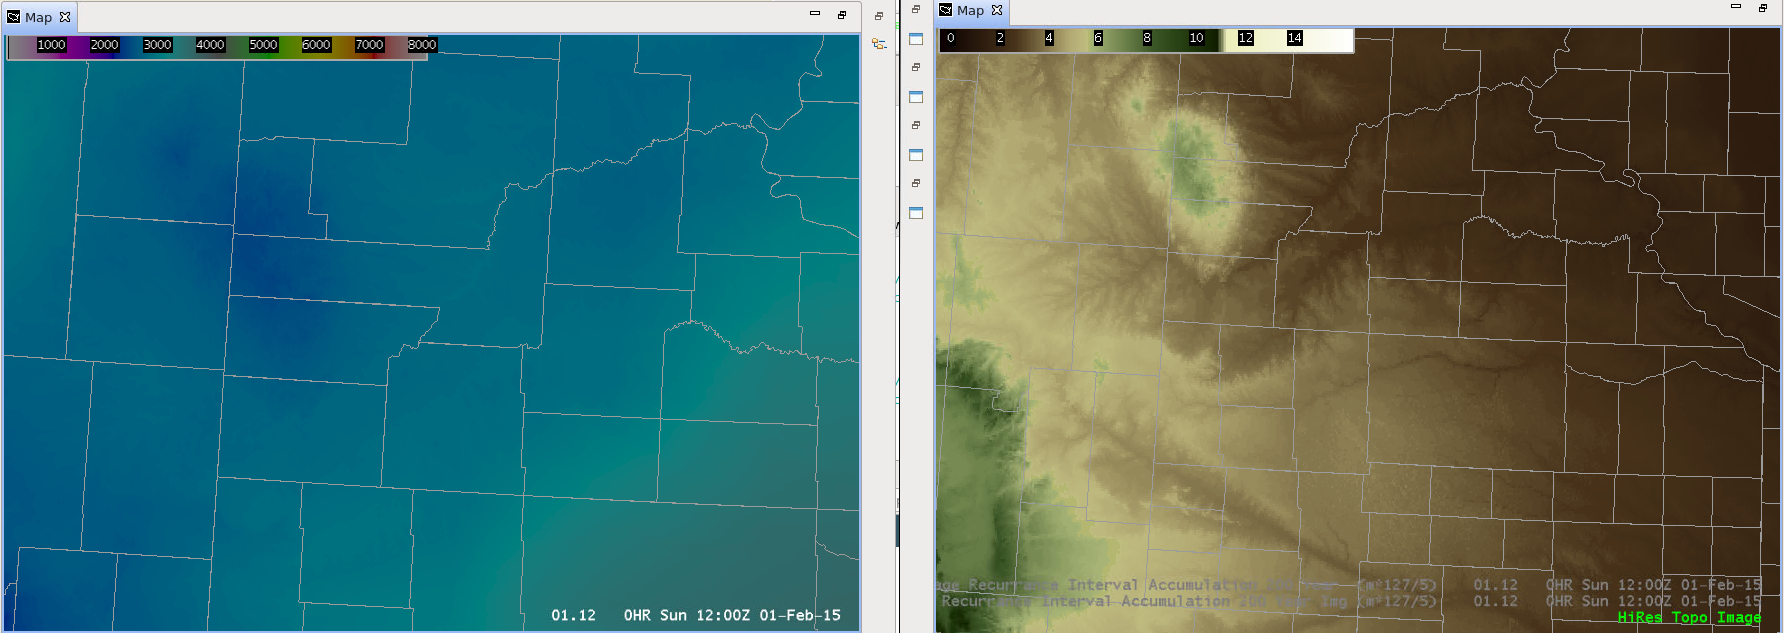
- Rapid City, SD
- The original dataset had a maximum of 4.2" associated with a 200yr recurrence interval for a 1hr duration, and the new dataset averages this feature out to 2.6". Downtown Rapid City's ARI was 3.7" compared to the new 2.7". This higher precip threshold required to meet a 200yr recurrence interval is on the eastern slopes of the Black Hills where terrain increases from 3Kft to 7Kft from east to west. The higher value makes more sense because this is where more heavy rainfall typically occurs due to upslope forcing (Matt Bunkers personal communications).
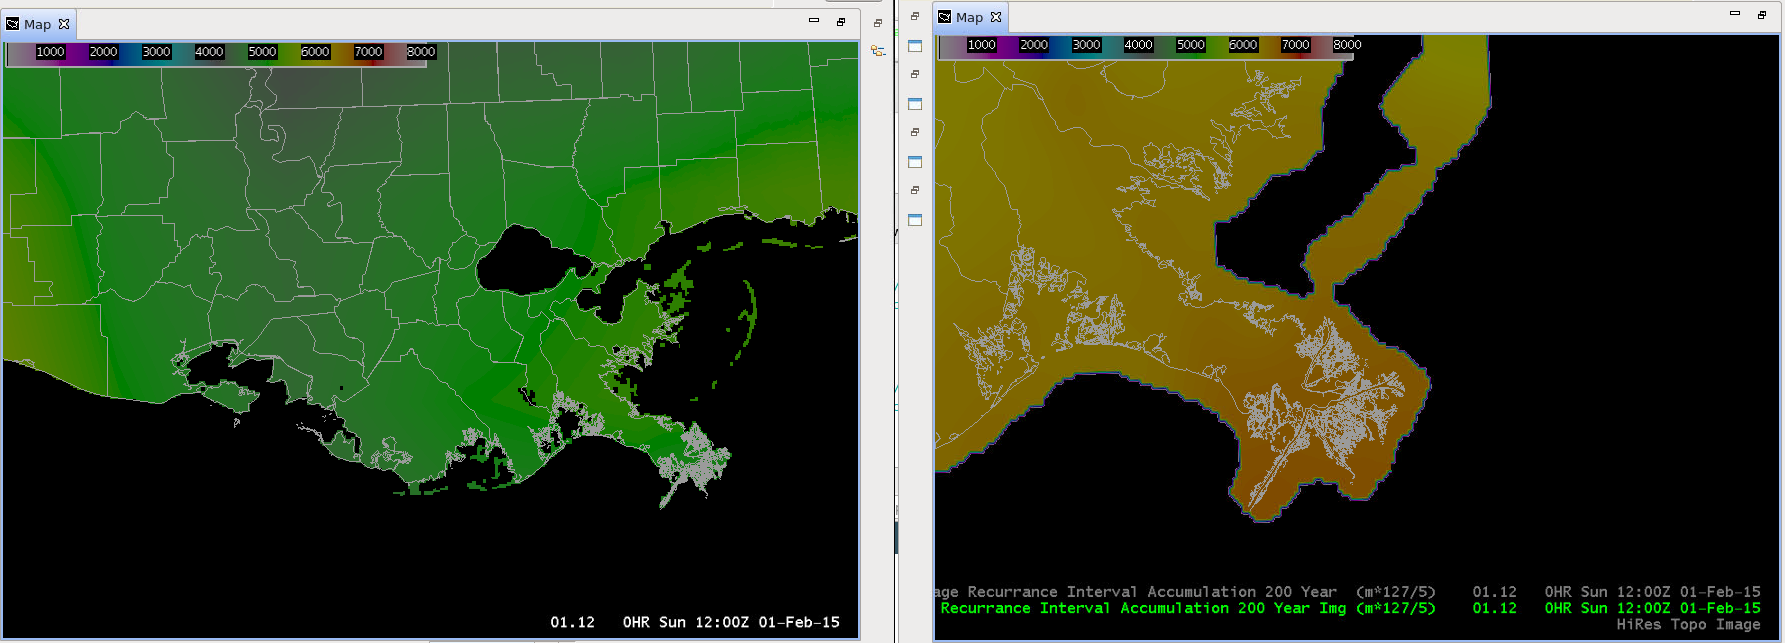
- New Orleans, LA
- The original ARIs are 6.7" for a 200yr recurrence interval and a 1hr duration, and the new dataset's values are lower, around 5.2".
- Fort Lauderdale, FL
- The original ARIs are 6.4" for a 200yr recurrence interval and a 1hr duration, and the new dataset's values are lower, around 4.5".
- Carrol, IA
- The original ARIs are 4.6" for a 200yr recurrence interval and a 1hr duration, and the new dataset's values are lower, around 3.6".
- Eustis, Maine
- The original ARIs are 1.9" for a 200yr recurrence interval and a 1hr duration, and the new dataset's values are higher, around 2.7".
- Ridgecrest, CA
- The original ARIs are 1.0" for a 200yr recurrence interval and a 1hr duration, and the new dataset's values are higher, around 4.6".