


Display Multiple Active Soundings - OCLO
Purpose:
This task covers how to overlay multiple soundings in the NSHARP display, including comparing two RAOBs from the same station, comparing RAOBs from different stations, and comparing all RAOB times from one station.Tasks:
Assumptions:
- Two RAOB soundings are loaded in NSHARP.
- The frame count should be set to four (Frames = 4).
- Left-click on the Ovrlay2 button in the Control Buttons area.
- When it is set to “Ovrlay2(on),” the buttons for “CompStn” and “CompTm” are disabled, since they would conflict with “Ovrlay2.”
- The button name will switch from “Ovrlay2(off)” to “Ovrlay2(on).”
- Move forward or back one frame in time and by station by pressing the right-arrow and left-arrow buttons and the up-arrow and down-arrow buttons on the keyboard.
- The currently selected sounding is listed in the box at the upper left of the Skew-T Display, as well as being marked with green text in the Sounding Inventory table
- In both the Skew-T and hodograph plots, the previously displayed sounding will be plotted in different colors.
- Toggle off the overlay by left-clicking the Ovrlay2 button in the Control Buttons area.
- Compare RAOBs from two different stations.
- Left-click on the CompStn button in the Control Buttons area.
- When it is set to “CompStn(on),” the buttons for “Ovrlay2” and “CompTm” are disabled, since they would conflict with “CompStn.”
- The button name will switch from “CompStn(off)” to “CompStn(on).”
- Observe the changes in the NSHARP display.
- The wind barbs and other overlays (e.g., clouds and effective inflow) disappear.
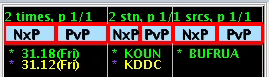
- Overlays in the Skew-T and hodograph plots will have a different color for each station. The colors are referenced in the Sounding Inventory tables (see image on right).
- Move forward or back one frame in time by pressing the right arrow or left arrow on the keyboard.
- Press the up and down arrows on the keyboard to toggle between the data analysis for each station.
- Data analysis will change with the following tables/displays: Analysis within the Skew-T display (LCL, LFC, freezing level, etc.), Table Output Display, Windspeed vs. Height display (if using SPC Wide Screen Configuration), Temperature Advection vs. Height display, and Display Insets.
- To toggle off the station comparison, left-click the CompStn button in the Control Buttons area.
- Left-click the CompTm button in the Control Buttons area.
- When it is set to “CompTm(on),” the buttons for “Ovrlay2” and “CompStn” are disabled, since they would conflict with “CompTm.”
- The button name will switch from “CompTm(off)” to “CompTm(on).”
- Observe the changes in the NSHARP display.
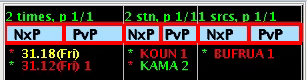
- The current table content’s time is indicated by the green star in the time column of the inventory table in the upper right.
- Overlays in the Skew-T and hodograph plots will have a different color for each time. The colors are referenced in the Sounding Inventory tables.
- Move forward or back one frame in time by pressing the right arrow or left arrow on the keyboard.
- Press the up-arrow and down-arrow buttons on the keyboard to toggle between the data analysis for each station.
- To toggle off the time comparison, left-click on the CompTm button in the Control Buttons area.
- Task Complete!