Color Vision Deficiency Evaluation - Operations Proving Ground
Impact of Color Vision Deficiency on Interpretation of RGB Composites
The successful launch of GOES-R in November 2016 initiated a new era for satellite meteorology. The availability of sixteen spectral bands, rendered at four times the resolution of current GOES imagery, and accessible by forecasters in near real-time, makes satellite imagery and products valuable for operational decision making in ways for which it was irrelevant in the past.
In addition to identifying ways individual spectral bands can be used, considerable research has been devoted to creating composite imagery, comprised of combining multiple bands and/or band differences in the Red-Green-Blue (RGB) color space of AWIPS. These RGB composites are created to accentuate particular atmospheric features, thus assisting forecasters in the task of phenomena-based analysis. Early results in the U.S. reinforce successes documented by several years of operational RGB recipe use by meteorologists in western Europe.
However, the advantages offered by such composites are dependent on users having normal color vision. Since approximately 8% of the population experiences some degree of color vision deficiency (CVD), it is important to take into consideration its effect on interpretation of these products, as well as potential methods for mitigating those impacts.
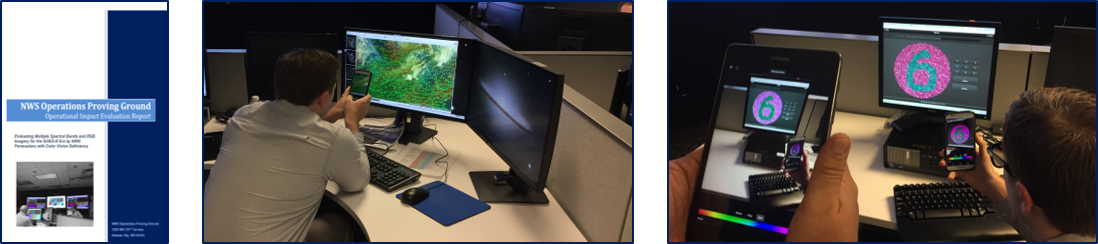
In April 2017, the OPG conducted experiments with three forecasters who tested as having moderate to severe [NAME OF CVD] Using archived cases of various meteorological phenomena, participating forecasters provided feedback on their capability to identify particular features in both single band imagery and RGB composites. Phenomena assessed included the formation and decay of fog and stratus, both daytime and nighttime; capability to differentiate between snow/ice fields and cloud cover; initiation and evolution of wildfires; development of a synoptic scale dust storm; initiation and evolution of two types of convective environments; and analysis of three different layers of water vapor.
During two cases, eye tracker technology was employed to evaluate where participants’ were focusing as they attempted to discern specific features. Thought processes were then documented by using the Recent Case Walkthrough interview technique.
Three potential mitigating approaches were assessed as well. The first was the use of Enchroma glasses, which utilize a special polarized lens that enables some individuals with CVD to detect colors more vividly. A second technology was an iPad app [NAME] which translates a targeted area in the iPad viewfinder as into an image as it appears for those with normal color vision (and vice cersa). Finally, forecasters were introduced to methods available to them in AWIPS that permit adjustments in the min-max ranges, and in the alpha function of any colorized image. This tool facilitates easy manipulation of an image to enhance its contrast and interpretability for each individual. Click on the pictures below for full report document.