Satellite IR Color Curve - Snow Squalls and Snow Squall Warnings
GOES-R Snow Squall IR Color Curve
Overview
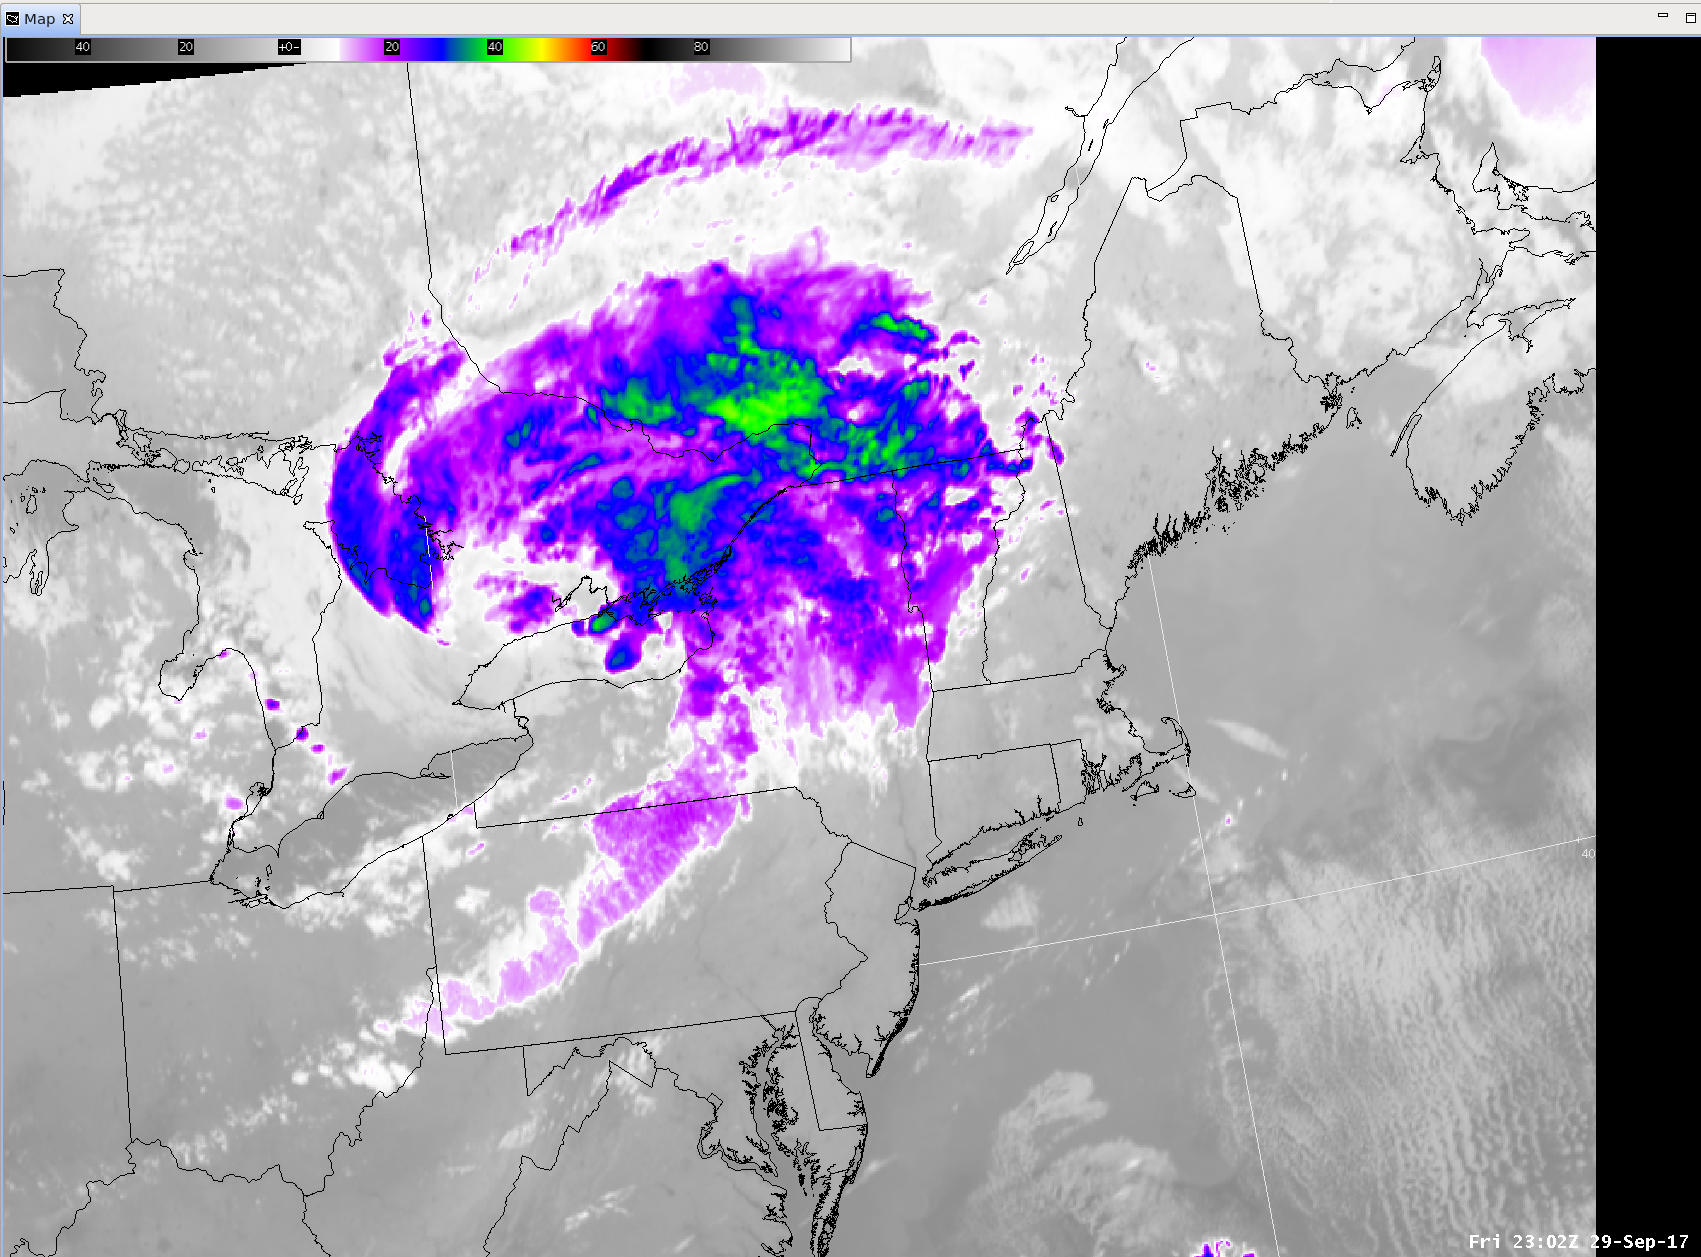
Snow squalls are shallow convective features (echo tops typically ~ 10-15 kft), so we wanted an IR curve (we used CH-13 10.35um) that (1) enhances the typical cloud temperatures associated with winter convection (shallower relative to deeper warmer season convection), and (2) highlights typical cloud ice/cloud glaciation temperature ranges. So, for typical continental clouds, we wanted to mute cloud top temperatures warmer than about -10C using shades of gray, where the probability of cloud ice drops to 50% or less. You'll see the pink and purple shades start at -10C and range down to around -30C. Between -30C to -45C, you'll see green shades increasingly stand out. Anecdotally, this is the cloud top temperature range where you typically see the highest winter convective cloud tops highlighting the stronger winter convective elements (isolated cells or within a convective cloud band). Obviously, there can be some variability of these cloud temperatures based on the overall environment. But often, these green shades at -30C to -45C are typically good for tracking strong winter convective cloud elements, including snow squalls.
There may be tweaks to the curve as we gain more experience with it and the GOES-R series in general. Contact peter.banacos@noaa.gov and dan.bikos@colostate.edu with any feedback on the color curve.
Download
To download the IR color curve (xml file), visit: https://vlab.noaa.gov/group/stor/color-curves.
Sample Image