Welcome to the Meso-IDSS Blog!

This blog is meant to provide examples of how the role of the mesoanalyst can enhance IDSS, primarily during severe convective operations. Our hope is that this blog will be an avenue for NWS forecasters to share how mesoanalysis played a role in enhancing communication internally to the warning team and/or externally to NWS partners during an event.

Latest Posts

Late Summer Severe Storms in the Northeast & Mid-Atlantic States: 8/27/2020

.

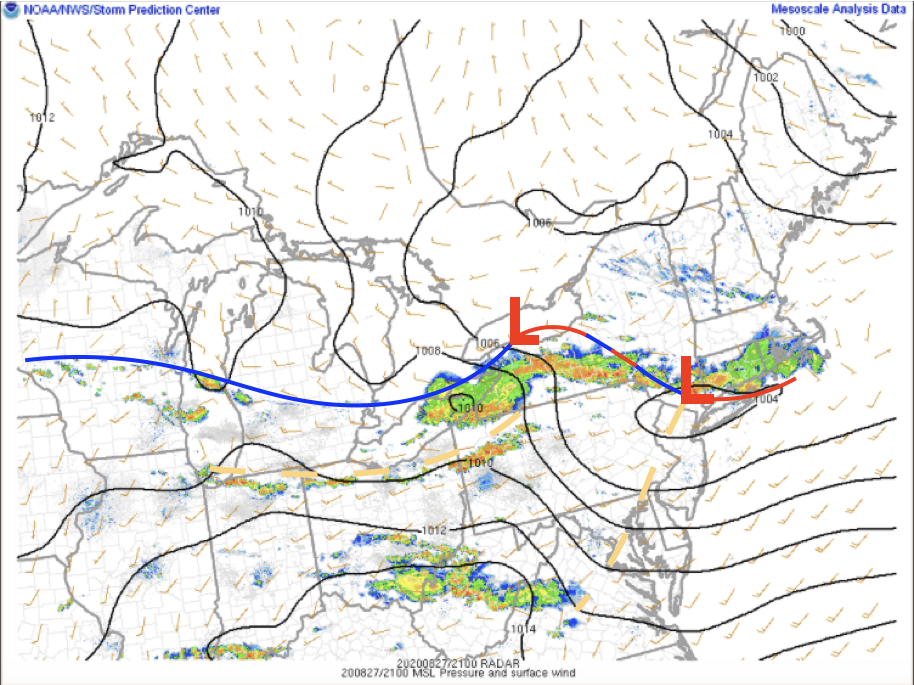
On August 27th, 2020, a potent closed low in the Canadian Maritimes with 500mb heights ranging 2 to 4 standard deviations below normal (Figure 1), and a ~1020mb high pressure over the Southeast U.S., resulted in a tight pressure gradient across the Northeastern states. Unseasonably cool temperatures (50s/60s) were ushered into northern New England as a result of northerly flow in Ontario/western Quebec around a nearby area of high pressure. Meanwhile further south in the Mid-Atlantic region, the air mass was much warmer and more moist compared to the air mass to the north. This set up a well-defined warm front with a sharp temperature gradient straddled along the I-90 corridor in New York (Figure 2); an attendant weak surface low was located near Lake Ontario. A series of shortwaves were expected to propagate along the pressure and thermal gradients on the 27th and serve as a lifting mechanism and the impetus for severe weather later in the day.


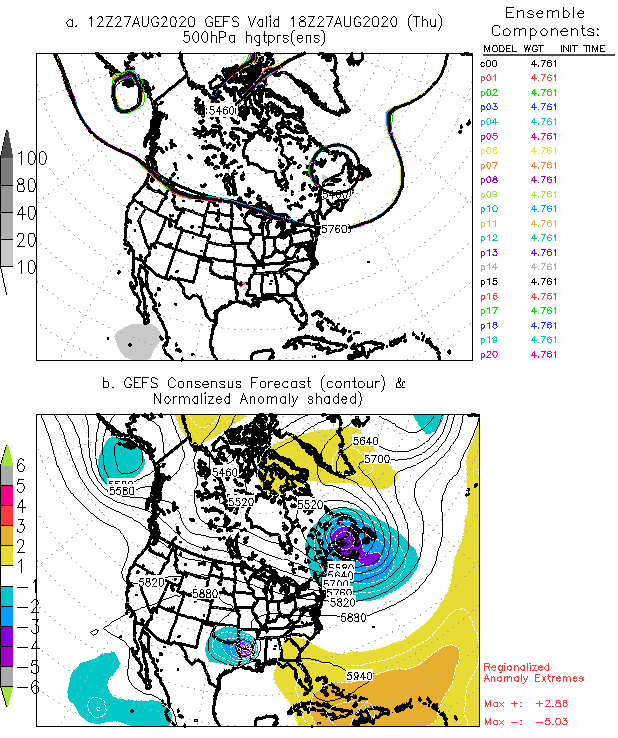
Figure 1: 6 hour forecast GEFS 500mb heights (top) and anomalies (bottom) valid at 18Z 8/27/20.

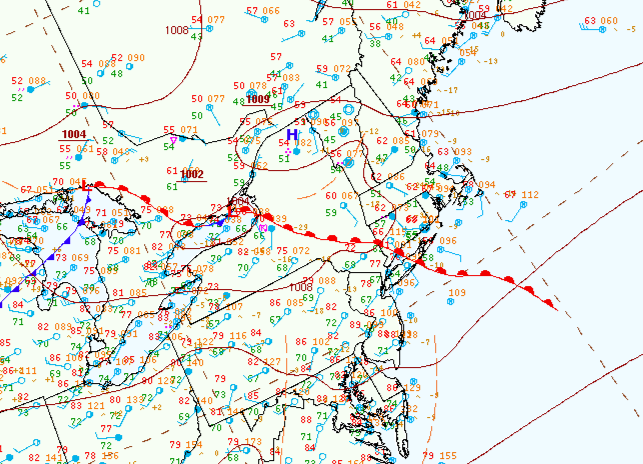
Figure 2: WPC high-resolution surface analysis valid at 15Z 8/27/20.

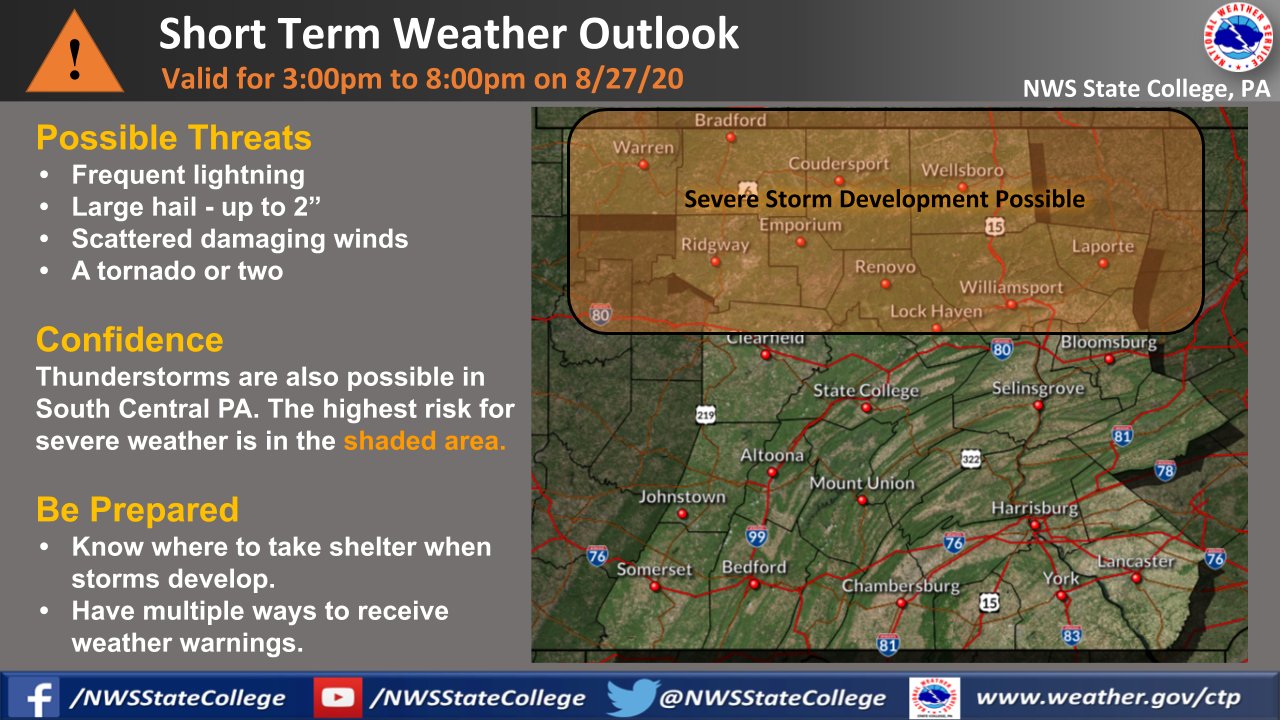
The Storm Prediction Center outlined the area along and just south of the warm front in New York and Connecticut, extending down into northern Pennsylvania, and New Jersey, in an Enhanced Risk (Figure 3). Locations just to the south, including most of the remaining portions of Pennsylvania, were located in a Slight Risk. The tight pressure gradient between the exiting closed low to the north and high pressure to the south resulted in a belt of very fast zonal/westerly flow across the I-90 corridor. This was characterized by 700mb winds of 55-65 kts and 850mb winds of 30-45 kts. The strong wind fields created ample shear, sufficient for storms to become supercellular, and an environment very supportive of strong damaging winds (reflected by SPC’s damaging wind probabilities). NWS Albany sent out an update on social media by 5am on August 27th highlighting that areas south of the warm front would be the most likely to experience severe thunderstorms later that afternoon (Figure 4).


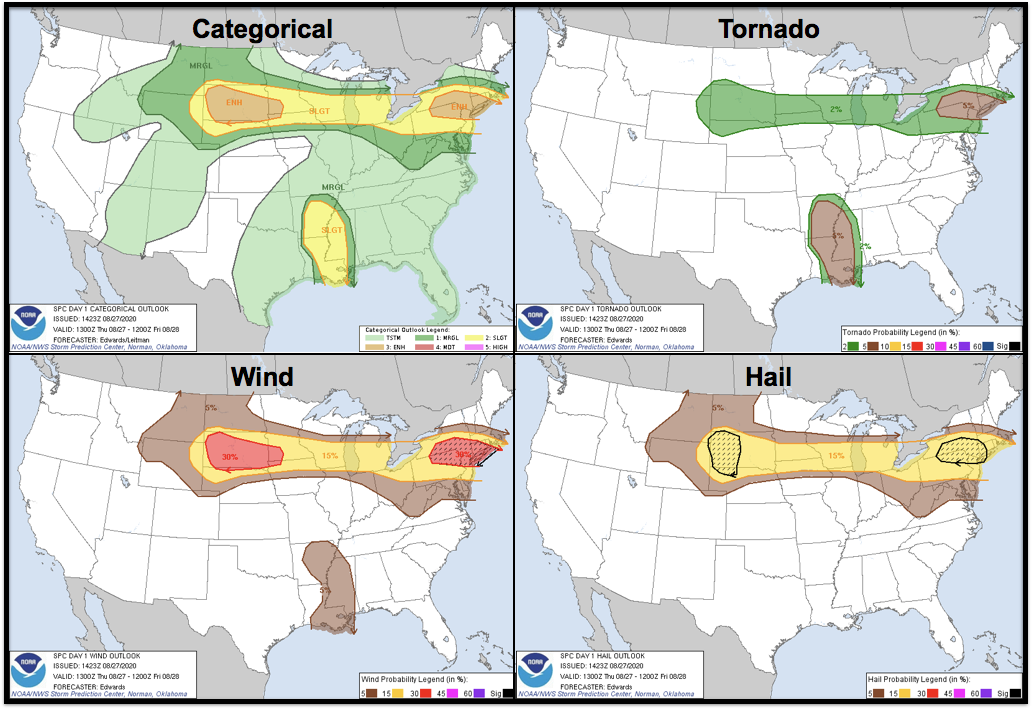
Figure 3: SPC 1300Z Day 1 Convective Outlook: Categorical Outlook (top left), Tornado Outlook (top right), Wind Outlook (bottom left), Hail Outlook (bottom right).

By late-morning, the focus was on one of the shortwaves which exited Ontario and provided forcing for ascent for rain and embedded thunderstorms as it traveled into western New York. NWS Albany issued an Area Forecast Discussion (AFD) at 14:54Z which highlighted the expected convective evolution and the related potential hazards with this area of activity:

“Strong to potentially severe convection will be developing on the southern edge of the initial activity late this morning for the lunchtime to early afternoon hours. ... These storms may initially form within the elevated instability but will become more surface-based parcels, as they move south and southeastward from the roughly the I-90 corridor.

These storms will likely take on supercell characteristics for the afternoon hours as they move toward the eastern Catskills, Mid Hudson Valley, Taconics and into the Berkshires and NW [Connecticut]. Eventually, these cells will form a QLCS/squall line, as they drop south of the area for this evening.

The main threat with the initial supercells will be both damaging winds and large hail /possibly up to 2” in diameter/. … Near/just south of the boundary, long curved hodographs favored the development of a tornado or two as well.”


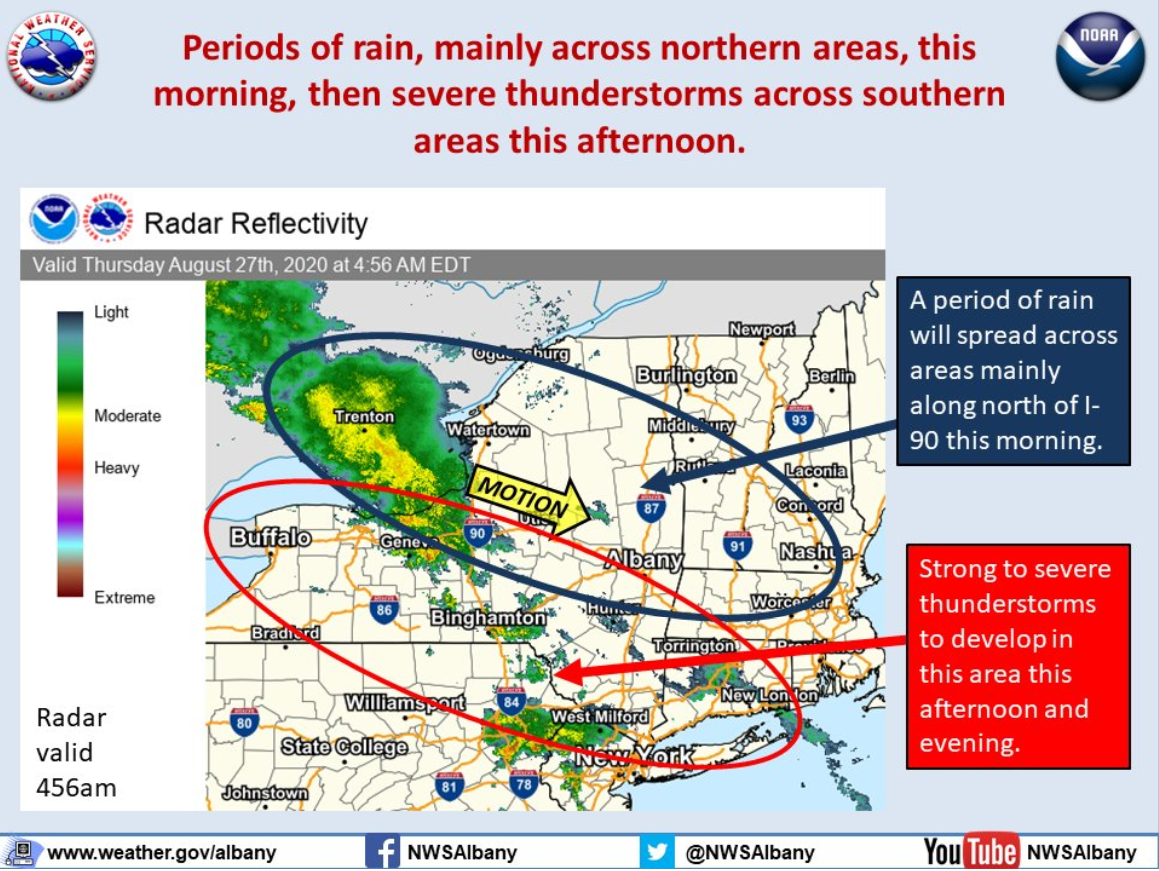
Figure 4: IDSS graphic published by NWS Albany on the morning of 8/27/20.


Figure 5: New York mesonet observations with radar data underlay valid from 12Z-20Z 8/27/20.

.

By 17Z, the area of sub-severe thunderstorms, primarily elevated, propagated southeastward along the theta-e/instability gradient between the rain cooled air north of I-90 and the very moist/warm air mass to the south (Figure 5). The clouds and rain kept locations such as Albany in the 50s to low 60s. By contrast, areas south of the front were relatively clear after 15Z (Figure 6) which allowed the region to destabilize for a period of 3 to 5 hours. Temperatures warmed into the mid to upper 80s and dew points climbed into the upper 60s to low 70s. Given that the environment in the warm sector became increasingly unstable, the NWS Albany forecasters expected the threat for severe hazards from these thunderstorms to increase as outlined earlier in the AFD.


Figure 6: GOES-16 CONUS sector infrared/visible sandwich imagery valid 15-18Z 8/27/20.

Per 18Z SPC mesoanalysis fields, MLCAPE ahead of this area of convection was 1000 to nearly 1500 J/kg and effective shear was 50-65 kts (Figure 7a). Thunderstorms were strengthening as they began to encounter this environment, as evidenced by the cooling cloud tops in IR imagery by 18Z (Figure 6). Additionally, effective helicity values became enhanced near and east of the Hudson River, with a maximum of 300-400 m2/s2 (Figure 7b). A special sounding at 18Z by the New York City WFO sampled this air mass and showed surface CAPE values over 1200 J/kg and effective shear of 54 kts (arguably a high shear/moderate CAPE environment) (Figure 8). Kinematics within the column were very impressive, ranging from 35 kts to 60 kts just in the 850 - 700mb layer alone. The very strong and primarily uniform westerly flow through the column supported a dominant linear storm mode which would be conducive for damaging wind gusts. However, veering between the surface and 850mb meant that rotating updrafts, and thus a threat for tornadoes, remained a concern. In fact, in a loop of observations from the New York mesonet (Figure 5), you can see the backed surface winds and the warm-moist air mass in the mid-Hudson Valley as thunderstorms move into the area. By 1730Z a tornado watch was issued from the Southern Tier of New York to northwest Connecticut.


Figure 7: a) (top) MLCAPE, MLCIN (shaded), and effective bulk shear; b) (bottom) effective storm-relative helicity, effective inflow base (fill), and storm motion. Analysis from SPC mesoanalysis (based on the RAP); valid at 18Z 8/27/20 with radar.

Figure 8: 18Z OKX (New York City) sounding.

.

Meanwhile, to the southwest, a west-east oriented boundary was dropping slowly southward from southwest New York into northern Pennsylvania from 15-18Z, as evidenced by the Day Cloud Phase RGB satellite loop (Figure 9). Although it is unclear whether the aforementioned boundary was convective outflow, a modified lake breeze feature, or some combination thereof, it appeared the environment just north of this feature had become stabilized, as judged from the character of the cumulus field in this area.


Figure 9: GOES-16 CONUS sector Day Cloud Phase RGB valid 15-18Z 8/27/20.

The boundary did bear watching as the environment was characterized by around 1500 J/kg of MLCAPE and effective shear of 30-35 kts at 18Z (Figure 7a). Although these values were not as impressive as farther to the northeast over New York State, instability and shear were still sufficient to support at least isolated severe storms. By 18Z, glaciation was evident in this line per Day Cloud Phase satellite imagery, and thus indicated convection initiation (CI) attempts were underway (Figure 9). However, warm temperatures aloft resulted in poor mid-level lapse rates of roughly 6°C/km (Figure 10), so given weak forcing for ascent, only weak convective development was anticipated in the near-term. At 14:51Z, an AFD update from the State College NWS office stated “warm temperatures aloft should hold back storms till at least later this after[noon].” Indeed, initial attempts at CI along this boundary largely failed, as shown by orphaned anvils over northern Pennsylvania in satellite imagery (Figure 11).


Figure 10: 18Z 700-500mb lapse rates with radar. Analysis from SPC mesoanalysis (based on the RAP).

.


Figure 11: GOES-16 mesosector Day Cloud Phase RGB valid 18-21Z 8/27/20.

However, by late afternoon the severe potential was expected to increase, especially over north-central Pennsylvania where storms were more likely to move south out of New York. An 18:17Z AFD noted that the “main threat is strong to severe winds, given wind fields aloft and deep mixing. A bit too far west to have much potential for rotating storms.” Having a keen understanding of the mesoscale environmental conditions allowed meteorologists to bring focus to the expected hazards. A Severe Thunderstorm Watch was issued for southern New York and northern Pennsylvania at 18:45Z, and at 19:17Z the State College office highlighted the areas in their CWA most at risk on social media (Figure 12).


Figure 12: IDSS graphic published by NWS State College on the afternoon of 8/27/20.

More robust convection did occur over northern Pennsylvania by 21Z as the southwestern edge of a large convective complex over New York State pushed southeastward. Also, new convection rapidly evolved from eastern Ohio into northwestern Pennsylvania along the original, slowly southward advancing mesoscale boundary referenced earlier (Figure 11). 22Z MLCAPE and DCAPE mesoanalysis fields (Figures 13a & 13b) indicated a more favorable regime for convective mixing in place to the south and downstream of this mesoscale boundary. These trends favored a greater potential for damaging winds ahead of this boundary instead of in north-central Pennsylvania where the threat had previously been expected to be greater.


Figure 13: a) MLCAPE and MLCIN (shaded) b) DCAPE. Analysis from SPC mesoanalysis (based on the RAP); valid at 21Z 8/27/20 with radar.

As mentioned in a 21:48Z AFD from State College, there was still uncertainty regarding how far east the storms would progress. Downstream in the Philadelphia/Mt. Holly office, there were questions with respect to how much the capping inversion would be able to weaken and how far the convection would be able to advance. Understanding the remaining threats, but also that storms were expected to weaken as the evening progressed, the Philadelphia/Mt. Holly WFO communicated their expectations to partners via an AFD. They stated, “we are still expecting isolated to scattered storms through the evening, some of which could be severe. The primary hazards at this point look to be damaging winds and possibly some large hail.” But then added that “convection tapers off fairly quickly between 9pm-10pm.”


Figure 14: MSLP, surface wind, and radar valid from 23Z 8/27/20. Imagery from the SPC mesoanalysis webpage; MSLP and surface wind analysis based on the RAP.

Interestingly, two distinct convective modes evolved as two different boundaries propagated southward into the mid-Atlantic between approximately 21Z and 00Z (Figure 14). While more discrete cells near New York City and the offshore waters south of Long Island, linear type complexes originating well upstream over western/central Pennsylvania traveled into eastern Pennsylvania. The deep-layer (850-300mb) shear vector (Figure 15a) was parallel to the warm front in New York/Connecticut (which favors a linear storm mode), but was slightly more oblique to the mesoscale boundary in Ohio/Pennsylvania (Figure 16). However, the storm-relative anvil level flow was parallel to the mesoscale boundary (which favors a linear storm mode) and more oblique to the warm front near New York City (Figure 15b). Potentially the most telling factor in favor of a more discrete storm mode over Long Island was the ability for storms to move off the warm front and into the warm sector, whereas storms in Pennsylvania seemed to have remained on the boundary (which effectively became the storms’ outflow boundary). Although it can be complex at times, analyzing these angles in real-time can provide insight to convective mode and evolution.


Figure 15: a) 850-300mb mean wind b) 9-11 km storm-relative winds. Analysis from the SPC mesoanalysis webpage (based on the RAP); valid at 18Z 8/27/20.

Figure 16: Surface frontal analysis overlaid onto 21Z MSLP, surface winds, and radar (same as Figure 14).

The greatest concentration of severe weather affected a narrow corridor from western and central New York, southeastward into the Lower Hudson Valley of New York and Connecticut (Figure 17). Four tornadoes (all EF-0s or EF-1s) occurred where helicity was maximized along the warm front in the mid-Hudson Valley of New York and into western Connecticut. Although scattered reports of wind damage were noted over northwestern and north-central Pennsylvania, most of the subsequent wind damage reports occurred downstream of the southward moving boundary in Pennsylvania (generally near and south of Interstate 80). This included an 81 mph wind gust report over southeastern Pennsylvania at approximately 8:25pm (0025Z).


Figure 17: SPC preliminary "filtered" storm reports valid 12Z 8/27/20 - 12Z 8/28/20.

Authored by Christina Speciale (WFO Albany), Micheal Jurewicz (WFO State College), Brian Haines (WFO Philadelphia/Mt. Holly) and Ryan Difani (OU CIMMS/OPG). Special thanks the OPG team for their contributions, reviews, and support. 

Did the role of the mesoanalyst play a key role in getting the message out to partners during a recent event in your area? Great! We want to feature your office's experience in a blog post. Reach out to the OPG with some of the details. You don't have to put the whole post together (but you can). The OPG will assist in putting together the finished product. We look forward to hearing from you!

Email us: nws.opg@noaa.gov