Class of 2023 - The William M. Lapenta - NOAA Student Internship Program
Class of 2023
-

Camila Rodriguez Tolentino
School: Polytechnical University Puerto Rico
Major: Environmental Engineering
NOAA Affiliation: OAR Climate Program Office
Research Title
An Analysis of Climate Services and Their Recipients: A Look at Federal Climate ProgramsAbstract
Climate change is a global challenge that necessitates coordinated and data-informed efforts to mitigate its impacts. To address this complex issue effectively, we provide an in-depth assessment of the Federal Climate Program inventory in the United States, focusing on the significance of interagency collaboration and data-driven approaches in advancing climate service, resilience and nature-based solutions. The inventory builds upon inventories completed in 2021 and 2022 and draws data from federal departments and agencies and other key stakeholders involved in climate-related activities that facilitate the generation, dissemination, and utilization of climate information for interagency collaboration and public access. The 2023 inventory's data consists of an analysis of 20 Federal agencies and 2 offices of the White House, resulting in 572 climate-related programs. The 194 new programs inventoried this year showcase the government’s commitment to advancing climate action and fostering sustainability under the Justice40 initiative, ; Inflation Reduction Act, and the Bipartisan Infrastructure Law. The US federal government programs resulted in 278 Climate Services, where 173 tackle climate crises directly and 105 indirectly, developing and delivering initiatives to educate, train, and engage citizens to tackle the climate crisis and to make informed decisions in the face of a changing climate.
-
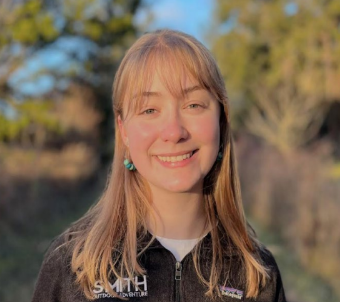
Kaila Frazer
School: Smith College
Major: Environmental Science and Policy
NOAA Affiliation: NMFS Southwest Fisheries Center
Research Title
Quantifying Impacts of Marine Cold-Spell Events in the California Current on Blue Whale Habitat Using Species Distribution ModelsAbstract
Since climate change has been making extreme weather events more frequent, many studies have analyzed the effects of marine heatwaves on species habitat. However, there has been less focus on the impacts of marine cold-spells (prolonged but discrete periods of anomalously cold sea surface temperatures), which are decreasing worldwide but may be increasing in specific areas like the California Current System (CCS). This project aims to understand the trend in marine cold-spells (MCS) in the CCS. We quantify blue whale habitat change and displacement during MCSs as a case study of potential ecosystem effects of these events. We use weighted ensemble species distribution models to predict the effect of MCSs on blue whale habitat. Preliminary results show that blue whale habitat shrinks and shifts south during these events. Future work will investigate how MCSs effect blue whale habitat in California's National Marine Sanctuaries.
-

Helena Tsigos
School: Cornell University
Major: Atmospheric Science
NOAA Affiliation: NWS Pacific Region Honolulu Weather Forecast Office
Research Title
Pacific Tropical Cyclone Verification Trends Related to Evolution of Most Impactful Meteorological ToolsAbstract
A forecast verification is an evaluation of what was predicted versus what phenomena occurred, based on a set of parameters. After each hurricane season, the Annual Tropical Cyclone Verification Report is produced by the National Hurricane Center (NHC) which details the prediction errors, forecast skill, and model statistics for all storms in the Central/Northeastern Pacific and Atlantic regions. A tropical cyclone’s predicted strength and intensity is verified using the cyclone's one minute surface wind speed and central position from their "best track“ database. The temporal forecast windows that are evaluated in this study are the 120 hour (5 day) and 48 hour (2 day) outlooks. Error and skill data from 2001 to 2022, for both intensity and track, were taken from the NHC’s Forecast Verification Archive and NHC Official Forecast error database. Statistical tests were performed on data in time series utilizing Excel and Python. Graphing this data shows there is an increase in forecast skill and decrease in error over time, incentivizing research to identify which meteorological tools are most impactful on these trends in the Pacific region. A list of potential tools was aggregated by investigating standardized instrumentation utilized by the National Weather Service. Forecasters at the Central Pacific Hurricane Center were also interviewed about the functionality and application of some tools, which went into their evaluation. To identify the most impactful tool, all were evaluated based on 3 factors: spatial scale accessibility, type of observations recorded, and accuracy. After concluding that satellites were the most impactful, the verification trends and satellite history were compared to determine if a relationship exists. Additionally, the following research will explore the potential causes for some anomalies in the error and skill data. By identifying a piece of instrumentation that is most useful for this region, more funds and research may be allocated toward this instrumentation, resulting in higher quality observations to create more accurate forecasts.
-

Nayana Venukanthan
School: Cornell University
Major: Earth and Atmospheric Sciences
NOAA Affiliation: OAR Pacific Marine Environmental Lab
Research Title
Analysis Correlation between Gridded Precipitation and Saildrone Salinity Data during HurricanesAbstract
NOAA’s Saildrone Hurricane Observation mission in 2021 provided real-time, in-situ data of a variety of atmospheric and oceanic parameters, including sea surface salinity. This study explores possible connections between saildrone observations of surface salinity from this mission and rainfall measurement by satellites. For this investigation, gridded satellite precipitation data from CMORPH was interpolated on to saildrone locations using the Haversian distance formula and weighted averaging to generate paired salinity and precipitation data that are collocated at a given time. Comparisons were made using daily, hourly, and 30-minute data. In some cases, particularly during intervals in which saildrones were in close proximity to hurricanes, evidence was found that large rainfall led to a quick reduction in surface salinity, as expected. But in general, there is no clear relationship between the two. This suggests that there are other factors that influence surface salinity variability. Such factors include advection by currents and vertical mixing.
-

Hope Hunter
School: University of Illinois Urbana-Champaign
Major: Environmental Engineering
NOAA Affiliation: OAR Pacific Marine Environmental Lab
Research Title
Validating GFS Forecast of Arctic Surface Fluxes against Saildrone ObservationsAbstract
Uncrewed surface vehicles called Saildrones have been utilized to collect in-situ observations in the Arctic, a rapidly changing region where obtaining ground truth data is challenging. This research compares Saildrone data from Arctic deployments with forecasts generated by the Global Forecast System (GFS). Analysis of latent and sensible heat flux, along with their related physical parameters, reveals temporal changes and assesses the accuracy of these relationships in the GFS product. Statistical comparison between Saildrone observations and GFS forecasts identifies patterns in the discrepancies between the two data sources. The study identifies biases in the GFS model and highlights potential areas for forecast improvement, informing better predictions of the Arctic environment.
-
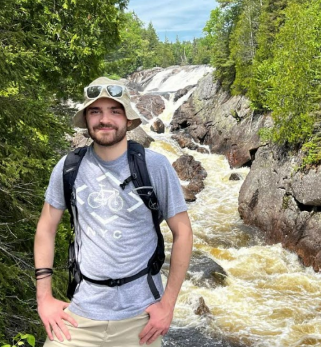
Grant Talkington
School: University of Oklahoma
Major: Meteorology
NOAA Affiliation: NWS NCEP Storm Prediction Center
Research Title
Verification of NOAA/NWS/SPC 4-hourly Probabilistic Severe Timing GuidanceAbstract
Recently, the NWS Storm Prediction Center has developed probabilistic severe timing guidance, with the goal of providing more specific information regarding the onset, duration, and cessation of severe weather events across the contiguous U.S. (CONUS). This timing guidance combines full-period SPC Day 1 convective outlook probabilities with 4-hr calibrated High-Resolution Ensemble Forecast (HREF) and Short Range Ensemble Forecast (SREF) guidance for severe hazards including hail, tornado, and wind. This timing guidance has been archived since April 2018. To gain an understanding of forecast quality, statistical verification was performed upon a 5-year subset of archived data, comprising 15 April 2018 - 15 April 2023. Performance and reliability diagrams and ROC curves based on the hourly output of the timing guidance accumulated within 4-hr periods and local storm report (LSR) data were constructed. In general, these metrics mimic similar qualities of the stand-alone full period convective outlook verification, but with variance across the 4-hr periods and a peak in performance in the late evening, coincident with a relative maxima in the frequency of LSR occurrence. In addition, the temporal bias was examined at each gridpoint over the entire CONUS. The timing guidance shows a slight late bias for all hazards, with a gradual increase in bias from west to east.
-
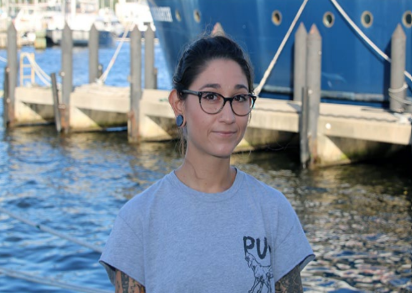
Jessica Caggiano
School: University of South Florida
Major: Oceanography
NOAA Affiliation: OAR Pacific Marine Environment Lab
Research Title
Diurnal Cycle of the Atmospheric Boundary Layer Stability In NCEP ModelsAbstract
The tropical Pacific Ocean is of significant interest to oceanographers due to its unique and complex dynamics, which play a crucial role in shaping global climate patterns and weather systems. Since the 1980’s, the Tropical Atmosphere Ocean (TAO) buoy array has been sampling atmospheric and oceanographic data at discrete locations along the equatorial Pacific. A bias in the atmospheric temperature data retrieved from these buoys is a current area of investigation. These errors could impact surface heat flux estimates and have possible implications when calibrating ocean-atmosphere coupled models. Here, we explore the diurnal cycle of atmospheric and oceanographic data from a nature run of the NCEP Climate Forecast System to explore whether these diurnal anomalies may be related to the physics of the atmospheric boundary layer rather than a bias associated with radiative warming of the air temperature sensor.
-

Joshua Ostaszewski
School: Texas Tech University
Major: Atmospheric Science
NOAA Affiliation: OAR National Severe Storms Lab
Research Title
Near-Storm Environment Spatiotemporal Analysis of the Lowest 1-km of the Boundary Layer using High-Resolving Mobile Lidar and Radar from the TORUS ProjectAbstract
Storm-scale processes that affect mesocyclogenesis, maintenance, and tornado-likelihood are still not fully understood owing to the lack of knowledge of the boundary layer evolution in both near-storm and ambient environments. The majority of prior studies have used idealized simulations to make vast kinematic and thermodynamic generalizations of the lowest few hundreds of meters of the boundary layer, often theorized to be important to a supercell’s tornado potential. The scarcity of boundary layer observations, usually only twice per day at NWS radiosonde launch sites (hundreds of kilometers apart) or at best hourly launches during a field campaign, is a major pitfall in quantifying heterogeneities in wind shear and storm-relative helicity in severe weather environments. The main goals of this study are to (1) assess the accuracy of wind measurements between the Doppler lidar’s continuous scanning mode and Ka radars’ VAD wind profile, (2) quantify the spatiotemporal heterogeneity of shear and storm-relative helicity in the lowest kilometer of the boundary layer, and (3) comparing the observed boundary layer evolution between strongly tornadic, weakly tornadic, and nontornadic supercells. When many scatterers are present (i.e. insects, dust, ect.) and the instruments were collocated, wind profiles were fairly consistent especially when the supercell was < 50 km in range and in inflow air. When scatterers were sparse, Ka radar winds had similar wind magnitudes as lidar but presented discrepancies in wind direction. Thus, changes in the magnitude of shear and storm-relative helicity at individual 100-m slices were analyzed to distinguish which slice contributed more to the overall 0-1 km layer. All three supercells exhibited noticeable increases of shear in the 0- 100 m slice and little relative increases in any other slice. Although the 0-1 km storm-relative helicity increased as the supercells approached, which 100-m slice contributed more differed significantly between each storm and usually was not always the 0-100 m slice, showing the importance of understanding other layers relative to the typical 0-100 m layer for tornado potential. In addition to the lidar and radar analysis, other objectives were explored, such as kinematic comparisons to launched radiosondes and examination of temporal near-storm environment buoyancy changes.
-

Savanah Kendrick
School: University of Florida
Major: Environmental Geosciences
NOAA Affiliation: NWS OBS National Data Buoy Center
Research Title
Enhancing Climatology Products and Analysis of NDBC's Coastal Weather Buoy NetworkAbstract
The goal of this project is to enhance and update the climatology displays for the Coastal Weather Buoy network used by the National Data Buoy Center (NDBC) on their website. The previous climatological displays have not been updated since 2009 and feature overwhelming and hard-to-read tables. To address these issues, new scripts will be created in MATLAB, and the displays will be refreshed using a cleaned version of the original coastal weather buoys dataset, incorporating various new types of graphs and plots. The final product will enable simplified and efficient analysis of the climatological data, provide valuable data control for NDBC in the future, and establish an up-to-date point of reference for their climate data.
-

Phoebe Lin
School: Massachusetts Institute of Technology
Major: Earth Atmosphere and Planetary Science
NOAA Affiliation: NWS NCEP Storm Prediction Center
Research Title
Developing Dry Thunderstorm Verification Tools to Improve Fire Weather Forecasting at NOAA’s Storm Prediction CenterAbstract
Dry-thunderstorm initiated wildfires represent 54% of the total land area burned by wildfires in the contiguous U.S. from 1992-2020, yet uncertainties in assessing fuel moisture remain a major challenge in predicting the occurrence of dry thunderstorms. The National Weather Service (NWS)’s Storm Prediction Center (SPC) issues daily Dry Thunderstorm Outlook areas in its fire weather outlooks corresponding to areas with dry fuels, rainfall accumulation less than 0.10”, and at least 10% (Isolated) or 40% (Scattered) coverage of cloud-to-ground lightning within 20 km of a point. In this study, differences in percentiles of Energy Release Component (ERC), a measure of fuel availability to burn, are first compared across two sources–WFAS (Wildland Fire Assessment System) and gridMET (the Gridded Surface Meteorological dataset). A new calculation of the gridMET ERC percentiles is performed based on aggregated data over all days in the 44-year record (1979-2022). Case studies confirm that the relevance of each of the three sets of ERC percentiles changes with seasonality. A daily verification plot then combines cloud-to-ground lightning flashes from the Vaisala National Lightning Detection Network, fuel readiness from the WFAS and gridMET sources, and daily Fire and Thunderstorm Outlooks issued by SPC. Additionally, flash counts within SPC isolated/scattered Dry Thunderstorm Outlook areas and Stage IV precipitation data from the National Centers for Environmental Prediction at each flash location are analyzed to evaluate existing precipitation thresholds for dry thunderstorms. These tools will provide essential next-day fire weather forecasting feedback for forecasters at the SPC and potentially NWS Weather Forecasting Offices across the country.
-
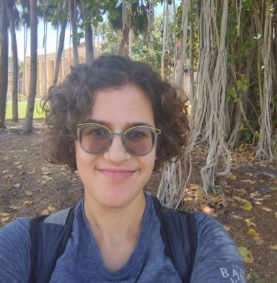
Veronica Lee
School: Georgia Tech University
Major: Statistics
NOAA Affiliation: OAR Office of Ocean Exploration
Research Title
Good Practices for Data Collection and Sampling Design in Deep-Sea Ocean ExplorationAbstract
The deep sea (>200 meters) remains largely unknown despite the fact that it is threatened by anthropogenic activities including fisheries harvesting, mining, and climate change. By performing habitat suitability modeling (HSM), we can understand species distributions across spatial regions and support conservation and environmental planning. Here, we assess our current ability to conduct HSMs with a case study using deep-sea sponge data that were collected by NOAA Ocean Exploration in the Hawaiian Islands region at community-selected dive locations. We used a quasi-Poisson generalized linear model with covariates generated from a bathymetric grid of the area. Our fitted model had severe limitations. Lack of high-resolution bathymetry data at all dive locations reduced the number of observations available for model building. Furthermore, the observations had spatial autocorrelation, which violated the model’s assumption of independence, and limited covariate gradients, which resulted in extrapolation when predicting across the study area. We developed good practices for data collection to maximize the utility of HSMs. We recommend collecting high-resolution bathymetry data at all sampling locations so that all species occurrences can be applied towards building a model with good predictive power. We also propose collecting data at distanced sampling locations to reduce spatial autocorrelation and using a random stratified sampling design to reduce bias and cover predictor gradients. With the use of these good practices, HSMs will have improved accuracy and assist us in protecting deep-sea species from anthropogenic threats.
-

Wilzave Quiles Guzman
School: University of Arizona
Major: Water Science and Policy
NOAA Affiliation: OAR Climate Program Office
Research Title
Meeting Communities Where They Are at: Centering Local Knowledge to Translate Science to ActionAbstract
Climate change can become politicized in certain regions of the United States, hindering engagement with the topic. Thus, researchers must employ different tools or frameworks to bridge the gap between science and society. One example is the Vulnerability, Consequences, and Adaptation Planning Scenarios (VCAPS) approach, which was originally developed by the Carolinas Integrated Sciences and Assessments to assist local governments in enhancing their ability to withstand the impacts of weather and climate change. Western Water Assessment has adapted this technique to work with small, rural communities in the Intermountain West, where climate change is still a culturally sensitive issue. This poster will share more about the approach, which we recently deployed in a small Wyoming community that is navigating the impacts of changing flood risk on their community’s safety and livelihoods. This project was part of a NOAA Lapenta internship. The Lapenta Internship Program provides opportunities for early career Earth scientists to build skills that connect research to real-world actions.
-
Danielle Recco
School: Vassar College
Major: Geography
NOAA Affiliation: NESDIS National Centers for Environmental Information
Research Title
Hypoxia's Impact on Catch per Unit Effort of Brown Shrimp in the Gulf of Mexico: A 3D Visualization of Oxygen ConcentrationsAbstract
Hypoxia (dissolved oxygen [DO] concentrations < 2 mg/L) in the northern Gulf of Mexico is the second largest hypoxic zone in the world. Low levels of DO can impact fisheries and ecosystems by reducing habitat availability, altering biogeography, and suffocating sessile organisms. The Gulf supports some of the most productive fishing grounds in U.S. coastal waters, particularly for the Brown Shrimp. NOAA Fisheries 2021 landing data of Brown Shrimp totaled almost 71 million pounds and were valued at $165 million with most of that data coming from the Gulf states. Previous research on the effects of hypoxia on the Brown Shrimp fishery is limited, but research has found that hypoxia significantly alters spatial dynamics and Catch Per Unit Effort (CPUE). This finding has the potential to impact the fishery with large economic consequences to fishermen. 2016 DO data from NOAA’s National Center for Environmental Information (NCEI) was processed in ArcGIS Pro to predict levels of dissolved oxygen in the Gulf using Empirical Bayesian Kriging 3D and then visualized as a voxel layer. This allowed DO levels to be visualized vertically in the water column. After hypoxic extent was visualized, shrimp count, length, and weight collected by Southeast Area Monitoring Assessment Program (SEAMAP) were correlated with levels of DO in R in order to determine whether DO levels significantly impact Brown Shrimp growth. New research has suggested that the volumetric response to reducing nutrient loading is more sensitive than the areal extent. Visualizing the volume helps fisheries data managers assess where hypoxia is localized in the bottom waters and where it could affect the ecological conditions of other taxa and inform future sampling efforts. The results of this work can provide a broader insight to the impact of hypoxia on this important fishery.
-
Benjamin Moose
School: Cornell University
Major: Atmospheric Science
NOAA Affiliation: NWS NCEP Aviation Weather Center
Research Title
Toward a prototype medium-range probabilistic product for boundary layer turbulenceAbstract
The Aviation Weather Center (AWC), which provides aviation hazard forecasts for the contiguous United States, currently issues only short-term turbulence products. Furthermore, the operational versions of the sophisticated Graphical Turbulence Guidance products remain in the short-range turbulence prediction domain, with forecasts extending 18 to 36 hours. Effective medium-range turbulence forecasts can provide the aviation community with decision support at longer lead times. This project makes progress toward – and helps evaluate the feasibility of – a medium-range probabilistic product targeting boundary layer turbulence. Pilot reports (PIREPs) of turbulence from light aircraft below the planetary boundary layer are filtered to remove potential thunderstorm or mountain wave-induced turbulence data. A variety of Global Ensemble Forecast System-derived turbulence predictors and model fields are associated with each report, and optimized turbulence indices are assembled. This research supplements earlier low-level turbulence index work performed by Andy Fischer at AWC but uses a different model, different PIREP filtering, and a wide range of predictors. Initial results, however, suggest similar index performance. Despite significant limitations due to PIREP biases, a framework for moving towards probabilistic turbulence forecasts using an optimized set of predictors is explored and implemented, and these prototype forecasts are visualized.
-

Phoebe Brache
School: University of Washington
Major: Environmental Engineering
NOAA Affiliation: NOS Integrated Ocean Observing Systems
Research Title
Deep Learning for Supporting Ocean Data Quality ControlAbstract
U.S. EPA Act of 2000 requires states with beaches to cooperate with the EPA to monitor the level of bacteria that impact water quality and issue swimming advisories when threshold levels are violated. However, the main methods currently used can take 18-96 hours to yield results. For users of the coastal waters, the delay can mean the information is obsolete by the time reports are available. The AI enabled Enterococcus Predictor: “e-Predictor” project aims to support the Texas Coastal management Program in accelerating both the quantification of coastal ocean bacteria and the dissemination of results to agencies and the public. Using decades of beach water quality data provided by the Texas Beach watch program, the GCOOS team has generated several potential models via AI/ML algorithms. From there we use AIC and BIC regression analysis to find the best fit model for the “e-Predictor” and simulate its application. The “e-Predictor”, if proven viable and fully implemented, will allow the Texas General Land Office (TGLO) to publish daily Enterococcus level outlook and forecast data to help the community plan coastal activities ahead of time. Additionally, if the model proves successful, it can be applied to other areas.
-
Sarah Packman
School: Harvard University
Major: Earth and Planetary Science
NOAA Affiliation: OAR Pacific Marine Environment Lab
Research Title
Characteristics of Subsurface Marine Heat Waves and Their Relationship to Mechanisms of Heat Wave FormationAbstract
Marine heatwaves (MHWs) can be defined as anomalously high ocean temperature events (> 90th percentile) lasting > 5 days. A MHW can form through multiple mechanisms, including anomalous air-sea flux and subsurface mixing (“top-down”); a reduction of upwelling of cold, deep water (“bottom-up”, e.g., during El Niño); and deep-reaching gyre or frontal motions along western boundary currents (“all-at-once”). Most previous MHW studies have focused on the sea surface. However, the persistent subsurface signature of “The Blob,” an extreme MHW in the Northeast Pacific from 2013-2016, contributed substantially to marine life mortality. This study extends MHW analyses to the global interior ocean, quantifying the duration and phasing of subsurface temperature anomalies. We use a novel global gridded dataset, consisting of machine learning estimates of interior temperature trained with Argo float and satellite data, at 1 ̊spatial and weekly temporal resolution from 1993-2022. By calculating lagged covariance, we show that in the Northeast Pacific, temperatures at depths up to 200 dbar are still influenced by a surface temperature anomaly up to 2 ½ years after the surface signature, implicating the “top-down” mechanism of MHW formation. However, in the equatorial Pacific, temperature anomalies can appear as deep as 100 dbar up to a year before manifesting at the surface (“bottom-up”), while in the Tasman Sea, temperature anomalies manifest throughout the water column (up to 1500 dbar) within ¼ of a year (“all-at-once”). We extend these regional analyses to the global ocean, showing that these patterns are consistent in other locations with similar regional dynamics. Thus, regional dynamics play a large role in determining the subsurface manifestations of MHWs, which in turn affect the nature of the extreme conditions experienced by marine life.
-

McKenna Eichenauer
School: Purdue University
Major: Atmospheric Science
NOAA Affiliation: NWS Southern Region Operations Center
Research Title
Impact-Based Climate Risk CommunicationAbstract
In order to better understand NWS Southern Region partner needs, perspectives on climate and climate change impacts were gathered through both formal and informal meetings with Texas emergency management officials and partners like the USDA and FEMA. Several common themes emerged among the sentiments expressed by over half the people spoken to. The themes are as follows: Climate doesn’t concern us because we don’t think on that timescale. We don’t really talk about climate because that can get political. People stop listening to me when I say “climate change”. The people we serve are not knowledgeable about the risks of a changing climate in their city or home. We are focused on adapting to the climate as disasters happen. In an effort to address these inhibitions to impactful discussions around climate, we will showcase the “Impact-Based Climate Risk Toolbox,” a new resource on climate change impacts compiled using the perspectives and information gathered in these meetings. These compiled resources are presented as an interactive ArcGIS Online StoryMap in order to effectively convey information and give impact-based context on climate change effects. The user can navigate through climate change effect categories to view maps, concise text descriptions, and photos to explore potential climate change impacts like electrical grid failure, sea level rise, heat related illness, and more. After receiving in depth feedback from partners regarding the use of the Impact-Based Climate Risk Toolbox, the consensus is the tool can be used as a concise and engaging training module for the general public, NWS partners, or meteorologists alike. Our goal is to educate these groups about direct climate change impacts and to inform decision makers about potential climate related disasters.
-
Asha Spencer
School: Pennsylvania State University
Major: Meteorology
NOAA Affiliation: NESDIS Office of Satellite and Product Operations
Research Title
The Start of a Northern Hemisphere Sea Ice Climatology Using Interactive Multisensor Snow and Ice Mapping System DataAbstract
The USNIC is seeking to create climatological snow and ice products using datasets generated by the in-house Interactive Multisensor Snow & Ice Mapping System (IMS). The 2021 Lapenta internship project resulted in the creation of an appendable record of IMS snow cover in the Northern Hemisphere. The 2023 Lapenta internship project added sea ice to the record. This project produced an appendable climatological data record of sea ice cover over the past 17 years using 4km resolution IMS data. A cumulative record of days of ice cover and an average record of days of ice cover over bimonthly (half-month) periods were produced, creating 24 cumulative Geotiffs and 24 average Geotiffs using ArcGIS Pro. IMS data was reclassified to extract daily ice data using ModelBuilder. Next, the reclassified rasters were stacked to create cumulative files. These files were then divided by the number of years of data using ESRI Raster Calculator to create the 2006 to 2022 average bimonthly sea ice extent.
-
Stephanie Caddell
School: University of North Carolina Chapel Hill
Major: Environmental Science
NOAA Affiliation: NMFS Greater Atlantic Regional Fisheries Office
Research Title
Using Data Loggers in Trawl Fisheries to Save Sea TurtlesAbstract
All sea turtles in U.S. waters are listed under the Endangered Species Act, and bycatch in fisheries remains one of the primary threats. In trawl fisheries, NOAA Fisheries (NMFS) has required turtle excluder devices (TEDs) in the southeastern shrimp trawl fishery and in the southern mid-Atlantic summer flounder trawl fishery to reduce mortality of sea turtles. However, other trawl fisheries remain a threat and, in some, the use of the TED can result in larger catch losses if the target species cannot fit through the bars in the device. Thus, NMFS is exploring alternatives to reduce sea turtle mortality while minimizing catch loss. Data show that when tow durations are less than 60 minutes, sea turtle mortality is reduced to a negligible amount (Matzen et al. 2015). While in some instances (eg. nets too small to accommodate a TED) limited tow times are allowed in lieu of TED requirements, tow times are difficult to monitor and enforce, limiting confidence in their conservation effectiveness. Thus, NMFS and their partners developed and conducted preliminary studies on a data logger for monitoring of tow duration (Matzen et al. 2015). This year, the agency is revisiting the data loggers and is developing a plan on how to move the data logger from the research phase to a tool that could be implemented in the fisheries. We sought to understand how the actual implementation of such a device would work. This year, we conducted interviews within the agency and with local partners. Included in these discussions were trawl fishermen, data and tech specialists with NOAA, partners at the Office of Law Enforcement, NOAA attorneys, and experts from our observer and cooperative research teams. Through these interviews, we have identified the challenges and opportunities that data loggers may provide and have used this information to inform development of an implementation plan. This plan will be used to assess the feasibility of the data logger prior to taking any regulatory action. If feasible, the data logger could provide the industry additional options for reducing sea turtle mortality, due to capture in trawl nets, and allow them to have flexibility to choose the tool best suited for their operations.
-
Robby Frost
School: University of Oklahoma
Major: Meteorology
NOAA Affiliation: OAR ESRL Global Systems Lab
Research Title
The Impacts of the Grell-Freitas Scheme on Short-Range Forecasts of the April 19, 2023 Convective EventAbstract
The Unified Forecast System (UFS) is NOAA’s community-based Earth modeling system that includes the Short Range Weather (SRW) Application, which serves as the foundation for NOAA’s next-generation regional Rapid Refresh Forecast System (RRFS). A known issue with the RRFS is its tendency to produce excessively strong convection. To counteract this bias, convective parameterizations like the Grell-Freitas (GF) scheme have recently been implemented within the SRW App. This study compares forecasts with and without GF for the April 19, 2023 convective event with the aim of determining how well the GF counteracts the RRFS's high convective bias. This event was chosen because it posed numerous challenges for weather forecasters due to the presence of marginal synoptic forcing and uncertainties in the strength of a capping inversion. Forecasts were initialized at 12 UTC on April 19 using initial conditions from the High Resolution Rapid Refresh (HRRR) and lateral boundary conditions from the Rapid Refresh (RAP). Qualitative analysis shows that in the No-GF forecast, there is spurious convection in eastern Texas/Oklahoma before the initiation of severe weather in Oklahoma, while in the GF forecast, there is no such spurious convection in this location during this period. In each forecast, supercellular convection initiates at the same time as observations, but is shifted southwest, potentially due to errors in initial conditions. In both forecasts, these storms track across central Oklahoma, but the No-GF forecast predicts weaker storms that dissipate much earlier than what was observed due to cold pools in eastern Oklahoma from the earlier spurious convection. The GF forecast aligns better with observed rainfall than No-GF while also having lower frequency bias for most rainfall thresholds, reflectivities greater than 40 dBZ, and echo tops above 30 kft. The GF forecast also has slightly more skill for these forecast variables at higher thresholds, although results are noisy due to just one simulation being run for each case. These results show that GF counteracts the high convective bias of RRFS for this case, indicating that implementation of GF within NOAA’s CAM-based modeling systems may improve forecasts and help operational forecasters when dealing with marginally convective environments.
-
Brianna Hauke
School: Northland College
Major: Climate Science
NOAA Affiliation: NESDIS Center for Satellite Applications and Research
Research Title
Hyperspectral Remote Sensing: Ground-based Calibration/Validation for Air Quality and Atmospheric Composition Satellite MissionAbstract
Hyperspectral remote sensing is the next step up from multispectral UV- to visible and near-infrared imaging, as the need to measure the atmosphere grows with increasing issues, such as worsening air quality posing a hazard to human health. The GeoXO satellite system will have a hyperspectral spectrometer to study air quality by measuring trace gases that interact with sunlight at a variety of wavelengths, and aerosols that scatter light. Calibration of the satellite instruments can be done by taking in-situ ground measurements using a spectrometer. The goal of this internship was to show how calibration and validation of satellite measurements is done, using the TROPOMI instrument aboard the Sentinel 5-Precursor. We took in-situ measurements with an Ocean SR Miniature Spectrometer. The spectrometer has a spectral range from 190 nm to 1050 nm. We collected measurements with the spectrometer using a Spectralon solar diffuser and 350-1050 nm optical fiber, and then calculated the radiance by using the solar zenith angle and dividing by pi. Irradiance measurements were done with a cosine corrector and aiming the fiber straight up. The measurements were taken on the same day that TROPOMI passed closest to our location, on July 17th. We plotted the TROPOMI Bands 1-6 reflectance at the time of the overpass. The radiance measurements at three different times were also plotted. This technique will be used in calibration and validation of measurements of the future GeoXO mission.
-
Indigo Fox
School: State University of New York at Stony Brook
Major: Atmospheric Science, Applied Mathematics
NOAA Affiliation: NWS NCEP Environmental Modeling Center
Research Title
Examining Impacts of Wave Coupling on the Future Global Forecast SystemAbstract
The current Global Forecast System (GFSv16) is a one-way coupled model with feedback from the atmospheric model to the wave model. The next version of the GFS will add ocean and sea ice components and feedback from the wave to the atmosphere and ocean components. This project examines the impact of wave feedback on the coupled model. To analyze the differences, two configurations of the global coupled Unified Forecast System (UFS) model were run with atmosphere, land, ocean, ice, and wave components. The “two-way” coupled configuration includes wave feedback and the “one-way” coupled does not. Each configuration was run for 16 days for 2 initial condition dates, 2/13/2020 00z and 9/13/2020 00z. These dates were chosen as examples of high impact events, as the first has Winter storm Dennis, an intense extratropical cyclone affecting parts of Northern Europe, and the second has Hurricane Teddy, a category 4 hurricane affecting the East coast of the US and Canada. Output from each run was analyzed, with a focus on examining the impacts of wave coupling on sea surface temperature, significant wave height, and the drag coefficient over the ocean.
-

Brandon Feole
School: Johns Hopkins University
Major: Environmental Science
NOAA Affiliation: OAR Atlantic Oceanographic and Meteorological Lab
Research Title
Generating a Time Series Record of Biodiversity in South Florida Waters Using eDNA ObservationsAbstract
Recently, a large body of research has emerged focusing on a potentially catastrophic loss of marine biodiversity. These concerns necessitate the development and utilization of techniques to monitor marine biodiversity that, compared to dive surveys, are less resource/time intensive and less invasive while also being able to cover broader areas and more diverse taxonomic groups. To fill this need, the AOML, as a collaborator with the Marine Biodiversity Observation Network, has been working to develop a time series record of biodiversity in South Florida waters using eDNA observations. Through the collection of marine samples, extraction of environmental DNA, amplification and sequencing of target marker genes, and downstream bioinformatic analysis, the Thompson 'Omics lab is able to build a more comprehensive picture of South Florida marine biodiversity and the factors that are driving its change. My role in this project has focused on three of the above components. The first half of my internship focused primarily on extraction of eDNA and preparing/verifying collected metadata. I then shifted my focus on the bioinformatic analysis of sequenced eDNA: utilizing tools such as Tourmaline to calculate metrics for biodiversity. Finally, in my second to last week on site I was able to partake in a research cruise and collect the eDNA samples.
-

D’Andre Tillman
School: Pennsylvania State University
Major: Meteorology
NOAA Affiliation: NESDIS Center for Satellite Applications and Research
Research Title
Using GOES Satellite and Radar to Estimate Precipitation from Convective SnowAbstract
The primary objective of this project is to build the foundation for an operational satellite-based product that improves forecaster situational awareness for hazardous terrestrial convective snow squalls. Convective snow squalls are generally short duration events that can produce intense snowfall rates, reduced visibilities, and can initiate flash freeze events on highway surfaces. Furthermore, the shallow nature of convective snow squalls creates NEXRAD observational deficiencies at longer distances from radar sites as the lowest elevation radar scan overshoots the convective snow cores. This project will first investigate the location and frequency of Snow Squall Warnings issued by National Weather Service Weather Forecast Offices over a multi-year period to provide a geographical census of where and when hazardous snow squalls occur. A merged dataset composed of GOES-16 observations and derived cloud products, NEXRAD radar reflectivity and derived snowfall rates, surface visibility, and model-derived environmental conditions will also be developed and interrogated to identify relationships between relevant variables derived from the respective datasets. Different in situ and model-derived visibility datasets will also be exploited to create an operationally viable enhanced gridded visibility product. The ultimate project goal will be to produce a robust training database using all available remote sensing, in situ, and modeling datasets that can be deployed in an Artificial Intelligence (AI)/Machine Learning (ML) setting. This satellite product will provide quantitative precipitation rates and/or a probabilistic hazardous threat level for convective snow squall events that can be easily interpreted for nowcasting purposes and will augment NEXRAD observations in regions prone to radar observational deficiencies for convective snow events.
-
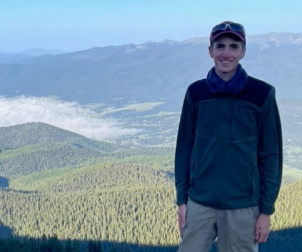
Mark Skaggs
School: Virginia Polytechnic University
Major: Meteorology
NOAA Affiliation: NWS NCEP Weather Prediction Center
Research Title
Algorithm Testing of the WPC Winter Storm Severity IndexAbstract
The WSSI has evolved into a suite of tools that, in addition to the NDFD version, focus on the probability of impact (Probabilistic WSSI) and short term travel impacts (Travel WSSI). Improvement to the WSSI algorithms is continuously sought. Internal NWS and partner feedback help highlight priority areas to focus on. This presentation will showcase improvements to the ground blizzard, blowing snow and flash freeze components. Algorithm testing of the WSSI consists of determining what specific components in the tool need to be improved and developing a test plan consisting of numerous iterations and comparing the results against each other to the original formulation. This was done with the ground blizzard component, to try and better tune the algorithm for colder and winder conditions. This methodology helps identify which set up provides the most improvement towards our desired outcome for the future. Additionally, algorithm testing was conducted on a new melting snow characteristic within the flash freeze algorithm. Melting snow is now a part of the flash freeze tool, and it is treated like rainfall in the calculation for flash freeze. This presentation will also key in on the specific components of WSSI that were improved using algorithm testing and show the results of the effect the testing had on the output of WSSI. The Travel WSSI uses High-Resolution Rapid Refresh (HRRR) model weather data alongside transportation related factors and time of day factors. Weather conditions, and parameterized road surface conditions are used to generate the severity of winter storm impacts on surface transportation. A redesigned blowing snow algorithm was tested, aimed at generating impacts for reduced visibility. Snow squall and mountain pass cases were rigorously tested to ensure impacts forecast improvements for these tough scenarios. Conducting algorithm testing an analysis on these tools of WSSI, will help improve the tool as a whole and maintain the integrity of this tool for use from many sectors.
-
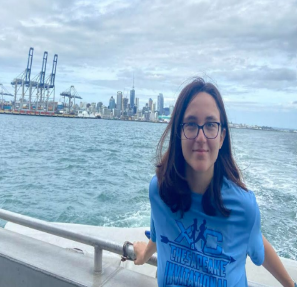
Jennifer Salerno
School: University of Maryland College Park
Major: Atmospheric and Oceanic Science
NOAA Affiliation: NWS NCEP Ocean Prediction Center
Research Title
A Quantitative Study of Ship Weather Avoidance in Response to the Evolution of Typhoon MerbokAbstract
The cyclone Merbok cut across all Trans-Pacific shipping routes causing disruptions from September 10th through 18th, 2022. Ships were forced to exercise weather avoidance procedures by significantly changing either their speed or course to avoid Merbok in both tropical and extratropical phases. This avoidance was effective, as no cargo was lost and no ships were damaged. Although successful, avoidance caused a drastic increase in the time and distance it took for many of these ships to complete their voyages. It is estimated that more than half of U.S. imports are transported by seagoing vessels. Many of these ships are transporting goods from across the Pacific Ocean. When these ships are forced to avoid dangerous weather conditions, it costs both time and money, as well as potentially adding distance to the voyage. Using AIS location data for ships in the Pacific, this research estimated the duration of the delays, and any added distance to the voyages that were incurred by commercial shipping vessels traversing the Pacific during the Merbok Typhoon.
-

Andrew Saldana
School: Pennsylvania State University
Major: Meteorology
NOAA Affiliation: NESDIS Office of Satellite and Product Operations
Research Title
Analysis on the Mesoscale Domain Sectors (MDS) using GOES-WestAbstract
The operational GOES-EAST and GOES-WEST imagers each contain two Mesoscale Domain Sectors (MDS) that can be activated upon request to provide 1-minute imagery for significant and critical weather events. Several factors affect the daily movement of the MDS that are in accordance with an activation priority list; Fires are sixth priority. The full cycle of the MDS process will be shown which includes the Mesoscale Mission Viewer (MMV) tool, the NWS Senior Duty Meteorologist, and the Environmental Satellite Processing Center (ESPC). The objectives of this investigation are multifold and include a) Provide a statistical analysis on the MDS coverage for a subset of major wildfires in California, b) Utilize R-programming to display the causes of wildfires using ancillary information from the National Interagency Fire Center (NIFC) data, and c) Spotlight the periods of no full-time MDS coverage over large wildfires. It will be shown that over seventy-five percent of major fires are covered and improvement should be made.
-
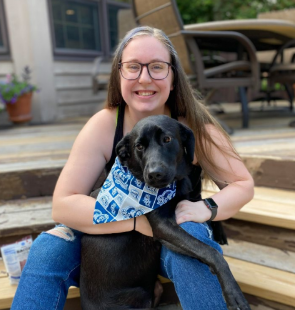
Emma Graves
School: Old Dominion University
Major: Oceanography
NOAA Affiliation: OAR Atlantic Oceanography and Meteorology Lab
Research Title
Tracking the Biological Carbon Pump in the Gulf of Mexico Using 'omics ApproachesAbstract
The biological carbon pump (BCP) is a major pathway for transporting carbon that is fixed by primary producers from the surface ocean to the deep. This process is the dominant mechanism for ocean carbon sequestration on geologic time scales. Particulate organic carbon (POC) is the vehicle for this carbon transport, and consists of organic-rich particles formed from photosynthesis within the photic zone that are remineralized and reprocessed as they sink through the water column. Given the microscopic processes that are taking place on a global scale, the relatively limited number of BCP-relevant observations currently hinders our understanding. We seek to answer the unknown of “who” is contributing to POC flux by identifying the biological members associated with deep ocean particulate fluxes. The application of ’omics approaches, in our case metabarcoding of the 16S and 18S rRNA genes, allows for a thorough description of the eukaryotic and prokaryotic communities who are associated with deep ocean particulates, and by extension the BCP. We have chosen to apply this approach in the Gulf of Mexico, where interactions between the Loop Current and extreme weather events can potentially cause seasonal fluctuations in water column POC dynamics. This study aims to better characterize the major biological contributors to POC that are exported to the deep through the BCP in the Gulf of Mexico. A sediment trap mooring was deployed in the Northern Gulf of Mexico (28°N, 89°W, 1200 m water depth) in December 2021 and has been collecting 2-week particulate fluxes continuously. DNA extracts from collected sediments have been repaired from formalin-fixed sediment samples, and 16S and 18S amplicon sequencing was carried out. Water column eDNA samples were collected during mooring servicing cruises every 6 months, filtered from set depths overlying the sediment trap. Bioinformatics analysis was done using the Tourmaline workflow, and the community data were interpreted in the context of various geochemical fluxes, including organic carbon and nitrogen, inorganic carbon, and silica. Sediment communities were compared with overlying water column communities to compare the major biological community members.
-

Declan Crowe
School: North Carolina State University
Major: Meteorology, Spanish
NOAA Affiliation: NWS NCEP National Hurricane Center
Research Title
Watch/Warning Verification for US-Landfalling Tropical Cyclones since 2017Abstract
This project examines the watches and warnings issued for the 19 Atlantic-basin tropical cyclones that made landfall in the United States between 2017 and 2022. We verify the highest level watch or warning an area received with wind radii data to determine whether a given area received the correct advisory for the wind conditions they experienced. We focus on coastal areas of the United States and its territories, with additional comparisons to areas outside the US.
-
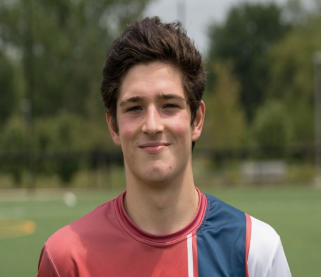
Aaron Bartlett
School: University of Michigan
Major: Computer Science
NOAA Affiliation: NWS OSTI Meteorological Development Lab
Research Title
Connecting Forecast Offices with Statistical VerificationAbstract
The current means of disseminating forecast verification data requires a high level of effort and planning to be done by Regional Managers and Operations Officers. This project makes several quality of life improvements to work towards bridging the gap between power users and the statistics they use to find weak points in their forecasting models. The main task undertaken was to create tailored chart packages for each user from the National Digital Forecast Database (NDFD) verification data. Adding monthly scheduling for these packages means users only need to request their tailored data once and it will show up in their inbox every month when the tables are released. Improvements have also been made to reduce users’ access time on the NDFD statistics viewer and speedup navigation between charts.
-
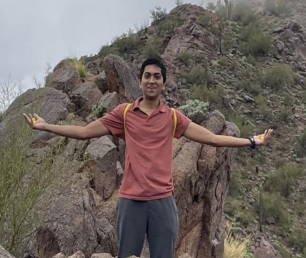
Manish Venumuddula
School: University of Michigan
Major: Climate and Computer Science
NOAA Affiliation: NWS OPPSD Office of Central Processing
Research Title
Developing Software Solutions for AWIPS EnhancementsAbstract
During my internship with the Office of Central Processing (OCP) AWIPS Software Development Team (ASDT), I had the opportunity to contribute to the improvement of AWIPS through feature enhancements. This presentation focuses on those improvements, including the successful display of the SPC Severe Timing Guidance product, which will soon allow NWS forecasters to use this product in AWIPS. Additionally, I made strides in displaying the Alaska Probabilistic-Extra Tropical Storm Surge (P ETSS) product and displaying the new Great Lakes Wave Model grids with the addition of Lake Champlain. These tasks are currently under further discussion, with potential solutions in the works.
I tackled many challenges, such as working with few requirements, difficulties ingesting data properly, and, frankly, the steep learning curve of an AWIPS developer. This presentation highlights the challenges faced, lessons learned, and my contributions to enhancing AWIPS. -

Kristen Hung
School: Bryn Mawr College
Major: Environmental Studies
NOAA Affiliation: NMFS Southwest Fisheries Center
Research Title
Incorporating Citizen Science in Northern and Central California Groundfish Stock AssessmentsAbstract
Citizen science has rarely been utilized in West Coast groundfish stock assessments. We explored the efficacy of incorporating crowdsourced recreational fishing data in California groundfish stock assessments by analyzing data from Fishbrain, an app used by recreational anglers to share their catches, and comparing it with standardized recreational fishery data collected by the California Department of Fish and Wildlife and available in the Pacific Coast’s Recreational Fisheries Information Network (RecFIN). We specifically investigated data from Northern and Central California (above Point Conception) because of the complex regulations in Southern California, and a focus was placed on cabezon due to the abundance of its observations in the Fishbrain dataset. Several quantitative analyses were conducted, including latitudinal size variation, size variation with distance from land and depth, and length-weight relationship comparisons. In addition, accuracy of angler species identification was investigated. The RecFIN data showed an increase in size from south to north while the Fishbrain data did not show the same clear trend. The investigations of size variation with distance from land and depth were inconclusive, showing no clear trend. Estimation of the length-weight relationship was more precise in the RecFIN data than the Fishbrain data. We found that species identification by anglers as recorded in the Fishbrain app was relatively accurate, since 95.2 percent of the observations logged as cabezon from January 2018 to July 2023 were correctly identified as cabezon. Based on this information, we conclude that crowdsourced recreational fishing data can be helpful in providing qualitative information for fisheries, and future work is needed to determine the ability to directly incorporate data into stock assessments.
-
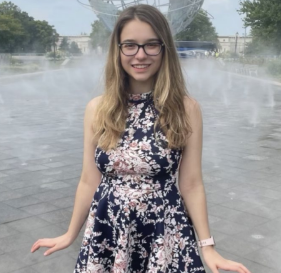
Samantha Donner
School: Rutgers University
Major: Meteorology
NOAA Affiliation:
Research Title
Water Mass Transformation by Tropical Cyclones in the North Atlantic OceanAbstract
My project is focused on how subsurface water masses move through the mixed layer after a hurricane passes. We look at the salinity, temperature, and depth of particles we plot on a map. We compare these results between a forcing and control model.
-

Zachary Strasberg
School: University of New Mexico
Major: Earth and Planetary Science
NOAA Affiliation: OAR Ocean Acidification Program
Research Title
Surface Ocean CO2 Atlas (SOCAT) Coverage in Large Marine EcosystemsAbstract
Understanding the historical coverage capacity of ocean chemical observation programs is a key strategic goal for NOAA’s Ocean Acidification Program’s (OAP) ability to monitor OA in Large Marine Ecosystems (LMEs). This project assesses historical coverage of the Surface Ocean CO2 Atlas (SOCAT), a synthesis of quality-controlled surface ocean CO2 fugacity (fCO2) measurements from NOAA’s Ships of Opportunity program (SOOP) along with other nodes of the National OA Observing Network. fCO2 measurements were gridded and a grid cell is considered “covered” if one or more fCO2 measurements were recorded in a month. The creation of OAP in 2009 coincided with a 4x increase in coverage from 2008-2011 in the nine LMEs studied for this project. From 2011-2021, the average LME had ~2.4% coverage. While six of nine LMEs had similar amounts of coverage by area (40000-75000 sq. km), the Northeast U.S. Continental Shelf LME was the most covered LME at 19% of its total area covered due to its small size. The summer was the most covered season, with the strongest seasonality occurring in polar LMEs that are unnavigable in the winter. This strong seasonality potentially limits the characterization of seasonal variability and annual fCO2 averages. Future work will incorporate additional datasets from other observing networks to this analysis in order to have a more complete understanding of global OA monitoring. Other coverage analysis should be performed on additional OA indicators (pH, DIC, Alkalinity) to determine NOAA’s ability to fully model all OA indicators. Finally, observing system simulation experiments may add additional information toward the strategic deployment of new sensors to help reduce uncertainty in LME-wide fCO2 modeling efforts.
-
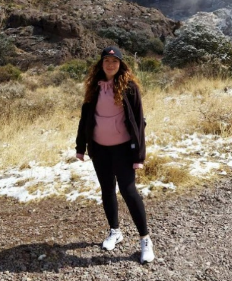
Kaitlin Escobar
School: Grand Valley State University
Major: Environmental Sustainability
NOAA Affiliation: OAR Air Resources Lab
Research Title
Air Pollutants and Greenhouse Gas in New York City: Comparison of Mobile and Aircraft ObservationsAbstract
The study of atmospheric emissions of greenhouse gas and air pollutants is crucial to understanding their effects on air quality and climate change, exceedingly within highly populous locations. Both ground-based and airborne measurements were conducted in New York City using gas and aerosol analyzers onboard a research SUV and aircraft. The results of concentration readings over New York City are mapped out for methane, carbon dioxide, ozone, black carbon and particulate matter (PM) 2.5 and 10. Identified disadvantaged communities in New York City have been located where the highest concentrations of gasses and air pollutants coincide, bringing particular attention to these areas that may be underserved and could benefit from a transition to reduced pollution and cleaner air. Calculated enhancement ratios between different trace gases measured on the surface and in the air help to indicate and suggest potential anthropogenic or natural sources of emissions throughout New York City.
-

Jonathan Starfeldt
School: University of Wisconsin-Madison
Major: Atmospheric and Ocean Science, Data Science
NOAA Affiliation: NESDIS Center for Satellite Applications and Research
Research Title
Exploration of a Statistical Approach for the Calibration of the NOAA CrIS Sensors Using Machine LearningAbstract
The Cross-Track Infrared Sounder (CrIS) is a Michelson interferometer currently onboard three polar-orbiting satellites as a part of the Joint Polar Satellite System (JPSS), Suomi-NPP (SNPP), NOAA-20 (N20), and NOAA-21 (N21). Data from CrIS helps produce geolocated radiance spectra that are critical for weather prediction and climate modeling. CrIS measures the infrared radiance of three spectral bands, longwave (LWIR) from 650 to 1095 cm-1, midwave (MWIR) from 1210 to 1750 cm-1, and shortwave (SWIR) from 2155 to 2550 cm-1, in the form of interferograms. The calibration process, while currently a well defined process, may prove to be too time consuming in the future with an increasing need for calibrated radiances and environmental data with low latency. The computational efficiency and the quality that artificial intelligence (AI) has shown in some technological applications makes it a promising tool to help aid the calibration of CrIS data. A specific type of AI, neural networks, define a series of linear and nonlinear operations to transform the input (uncalibrated radiances) into a desired output (calibrated radiances), using a variable system of weights and biases to fine-tune the model based on its performance. Once a neural network is trained on a large amount of sample data, it can be used to speed up the large-scale calibration of CrIS data, given that the AI calibrated radiances meet specified CrIS data requirements.
-
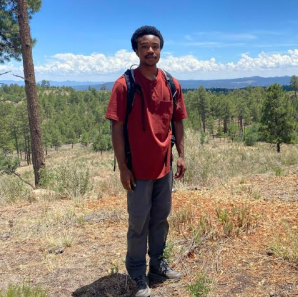
Zavier Avery
School: North Carolina A&T University
Major: Environmental Studies
NOAA Affiliation: OAR Climate Program Office
Research Title
Developing Inventory of Climate and Justice Related Federal ProgramsAbstract
Climate change is a problem that has become evident in recent years. It has altered our lives and will continue to do so. How can we adjust to the ever-changing climate? One solution is programs that help communities with building climate resilience. Climate resilience programs help with a variety of questions and problems. The programs do it by providing science based information to the public, creating tools that assist in planning and reaching out to communities to inform them of methods to adapt to the climate.
-
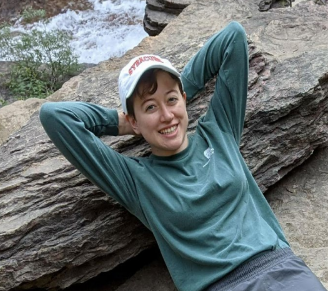
Madison Woodley
School: Syracuse University
Major: Meteorology
NOAA Affiliation: NWS NCEP Environmental Modeling Center
Research Title
Evaluation of the NoahMP Model Using the SNOTEL Network for Water Year 2020Abstract
Land surface models provide valuable information of surface fluxes and how they vary across our planet. The Noah-MP land surface model (LSM) was created to understand the complex hydrological and biogeochemical processes on Earth and how the land surface interacts with the atmosphere, and to improve upon its predecessor, the Noah LSM. A hierarchical testing approach is used that involves a spectrum of LSM-only simulations and coupled simulations. For coupled simulations, we use a candidate prototype of the Global Forecast System (GFSv17). We focus on Noah-MP performance of snow processes such as snow compaction and snowmelt and how the model compares to field observations. Evaluations of the model’s performance use snow observations of snow depth, snow water equivalent (SWE), and snow density from the U.S. SNOTEL Network during the 2020 water year. The SNOTEL network comprises 829 stations, stretching over 13 states from a range of elevations starting at 500 m to 3500 m with a focus on mountainous regions. Preliminary results of the model’s performance show that the model underestimates snow depth and SWE during early winter and show better agreement with observational data in mid to late February. This underestimation is particularly prevalent in the Pacific Northwest region where precipitation in the model and observations have the strongest disagreement. Additionally, results show that the model-predicted snowpacks are completely melted in some regions long before observations indicate that the snowpack has melted.
-

Joseph Schaubroeck
School: University of Michigan
Major: Computer Science
NOAA Affiliation: NWS OPPSD Office of Dissemination
Research Title
Configuration Script for GeoServerAbstract
The open source geographic information system, GeoServer, is utilized by many across the world for communicating geospatial data. Any major spatial data source can be published to GeoServer in order to streamline dissemination. Before, entering data into the GeoServer was a manual process that involved tediously inputting information by hand into an assortment of different fields. This configuration script utilizes GeoServer’s REST API to effortlessly submit information in an efficient manner. By utilizing this program, organizations can deliver information in a more timely manner.
-

Alex Swan
School: Mississippi State University
Major: Meteorology
NOAA Affiliation: NWS NCEP Environmental Modeling Center
Research Title
Validation of JEDI Software for NCEP's Next-Generation Unified Data Assimilation SystemAbstract
The Joint Effort for Data assimilation Integration (JEDI) project is developing the next generation DA system for use throughout NOAA and other organizations. In addition to replacing much of the existing code infrastructure, JEDI software aims to take into account additional components of the Earth system, enabling the evolution towards a fully-coupled forecast model. In order for JEDI software to be accepted by the National Centers for Environmental Prediction (NCEP) for use in a future version of the Global Forecast System (GFS), the system components must be verified independently for scientific validity and computational stability. In the presentation, we will compare static background error and observation error impacts on analysis increments using three-dimensional variational assimilation (3DVar). We will also verify cross-variable dependencies. Results from single observation impact tests will be shown. Additionally, we will look at a benchmark test to evaluate model runtimes.
-
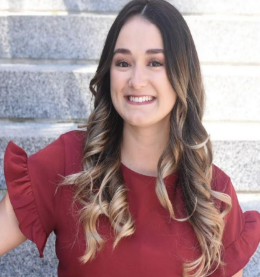
Gabriela Lirio
School: Florida A&M University
Major: Environmental Science
NOAA Affiliation: OAR Atlantic Oceanographic and Meteorological Lab
Research Title
Using Shell Morphometricsto Understand Ocean Acidification Impacts on the Calcification of Foraminifera in the Gulf of Mexico RegionAbstract
Anthropogenic fossil fuel emissions since the Industrial Revolution have led to increased concentrations of atmospheric CO 2 , with at least one-quarter of emitted CO 2 being absorbed by the ocean. Ocean acidification (OA) refers to the reduction in seawater pH that occurs as a result of CO 2 absorption in seawater. OA results in a lowering of carbonate ion concentration ([CO 3 2- ]), which is important to many marine calcifiers that use CO 3 2- to precipitate their shells and skeletons. A 0.5 m sediment core collected in the northern Gulf of Mexico to investigate long term changes in calcification of planktic foraminifera (Orbulina universa and Neogloboquadrina dutertrei), which are ubiquitous throughout the global ocean and contribute to carbon cycling. These samples were analyzed using a morphometric measurement, area density (estimated by individual weight/2-D area), to infer shell thickness and analyze changes in calcification over the industrial period. Preliminary results indicate an increase in calcification since the beginning of the time series.
-

Claire Bohman
School: Purdue University
Major: Atmospheric Science
NOAA Affiliation: OAR ESRL Global Monitoring Lab
Research Title
Characterization of Vertical and Seasonal Patterns in Atmospheric CO2, CH4, and CO over Colorado from AirCore DataAbstract
NOAA GML in Boulder, Colorado collects samples of carbon dioxide (CO2), methane (CH4), andcarbon monoxide (CO) through its AirCore program. These AirCores, which are launched in Northeastern Colorado, collect samples of CO2, CH4, and CO throughout the atmospheric column, and are analyzed to generate a climatology of these gases. In order to reflect the seasonal trends of these gases, it is essential to first analyze the CO2, CH4, and CO data from the Mauna Loa Observatory (MLO), as this data is largely unaffected by local emissions and is considered the “global standard”. By detrending the MLO data for these gases, the trendlines for the yearly fluctuations are produced. By subtracting this MLO trendline from the Colorado data, the yearly changes in CO2, CH4, and CO are able to be extracted for Northeastern Colorado specifically. Finally, by binning this data by month, seasonal climatologies for CO2, CH4, and CO are produced. In general, over Northeastern Colorado, there is a notable enhancement of CO2 during the winter season while conversely, there is depletion during the summer, growing season. Furthermore, while CO2 does decrease above the tropopause, its long air life allows it to remain constant in the stratosphere. CO shows a notable increase in the troposphere during the wildfire season and a slight depletion during the winter months. CH4 generally is consistent in the troposphere throughout the year. However, like CO, it drops off considerably above the tropopause as it is destroyed in the stratosphere. Future applications of this data will be to analyze the compatibility of the GML Aircraft data, launched farther north, to determine whether a move of the Aircraft site to the new CAO tower, in the vicinity of the current AirCore data measurements, will be feasible.
-
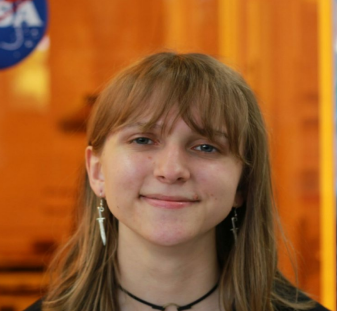
Jordanne Brisby
School: University of Georgia
Major: Atmospheric Science, Geography
NOAA Affiliation: NESDIS Office of Satellite and Product Operations
Research Title
Utilizing Satellite Imagery for Water Hyacinth Detection and Plastic Pollution AssessmentAbstract
Water bodies worldwide are increasingly threatened by the invasive Water Hyacinth (Eichhornia crassipes) and the associated pollution caused by plastic debris. Recent studies have shown that the presence of water hyacinth plays a significant role in the transportation of macroplastics, dislodging otherwise idle debris and pulling it downstream. This study aims to explore the potential of satellite imagery in identifying water hyacinth infestation and determining the extent of plastic contamination in aquatic ecosystems, as well as highlight its importance in planning river cleanup operations.
Satellite imagery offers a unique advantage for large-scale monitoring due to its extensive coverage, frequent revisit times, and multispectral capabilities. In this research, high-resolution images of water bodies from various satellites, such as Landsat, Sentinel-1, and Sentinel-2, are processed and categorized by the seasonality and annual cycle of their water hyacinth growth and movement. -

Noah Lang
School: Valparaiso University
Major: Meteorology, Mathematics
NOAA Affiliation: OAR Great Lakes Environmental Research Lab
Research Title
Updating a Hindcast of Arctic September Sea Ice Extent Using Teleconnection IndicesAbstract
The decline of Arctic sea ice in recent decades has prompted efforts to hindcast sea ice extent using teleconnection indices. A recent study applied regression models to predict September sea ice extent from 1948-2000, as well as conduct research on the influence teleconnection patterns have on sea ice amounts. This study extends the timeframe to 1950-2020, and examines monthly teleconnection indices of the Arctic Oscillation (AO), the Central Arctic Index (CAI), the North Atlantic Oscillation (NAO), the El Niño-Southern Oscillation (ENSO), the Atlantic Multidecadal Oscillation (AMO), and the Pacific Decadal Oscillation (PDO) to create hindcast regression models of September sea ice extent. The hindcast regression models were generated by increasing statistical significance to a Pearson correlation coefficient of 0.1 or less, so that only substantially influential teleconnections were considered while also increasing computational efficiency. After recreating the original study’s results, the extended study found that the increased timeframe allowed for good model performance, and was usually better than the original model. Teleconnection influence was examined through pretraining and posttraining exclusions of teleconnection data, but both methods demonstrated similar results. AMO and AO were consistently the biggest influence on Arctic sea ice extent, while ENSO and PDO were the smallest. CAI and NAO were often varied in their influence, ranging from negligible to moderate with respect to the other teleconnections.
-
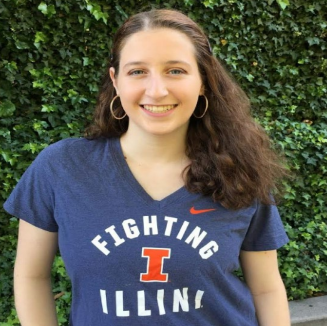
Emily Glenn
School: University of Illinois Champaign-Urbanna
Major: Earth, Society and Environmental Sustainability
NOAA Affiliation: OAR Weather Program Office
Research Title
Using Customer Satisfaction, Experience, and Engagement Data to Improve the Ease of Applying to WPO’s Funding CompetitionsAbstract
The Weather Program Office (WPO) is dedicated to supporting exceptional weather research aimed at safeguarding lives, preserving property, and bolstering the national economy. Annually, the WPO hosts funding competitions, encouraging academic and private sector stakeholders to submit research proposals focused on advancing weather forecasting, enhancing knowledge, and creating weather-related products and services. To continually optimize the proposal submission process for these competitions, the WPO seeks to gain insight into how applicants presently perceive and engage with its funding opportunities and submission procedures. To address this need for essential data, the WPO launched the Applicant Customer Experience and Satisfaction (ACES) survey at the conclusion of the Fiscal Year 2023 proposal submission window. By analyzing both quantitative and qualitative ACES Survey feedback, this stakeholder input will enable the WPO to refine its funding competition procedures and enhance the overall user experience for prospective applicants, ensuring greater accessibility to WPO's funding opportunities.
-
.png)
Shria Shyam
School: Carnegie Mellon University
Major: Environmental Engineering
NOAA Affiliation: NWS NCEP Environmental Modeling Center
Research Title
Assessing Initial Condition Sensitivity in the UFS ModelAbstract
The Unified Forecast System Weather Model (UFSWM) is a nonlinear Earth System model whose predictions often behave chaotically. This project visualizes the surprisingly large changes in model forecasts arising from changes in initial conditions and interactions between model components.
-

Richard Farrell
School: North Carolina A&T University
Major: Computer Science
NOAA Affiliation: NESDIS National Centers for Environmental Information
Research Title
Semantic API Runtime Object Layering of Stored PatternsAbstract
The vAIP API is a system of systems that facilitates knowledge sharing and discovery via a technology called Semantic Web. This presentation is a description of a new feature added to the vAIP system, to aid knowledge graph editing and exploration. Runtime Object Layering (ROL) is a method employed to recreate the specific environment that a stored knowledge graph had at its time of creation.
-

Evelyn Bohlmann
School: Valparaiso University
Major: Meteorology
NOAA Affiliation: OAR ESRL Global Systems Laboratory
Research Title
Comparison of MRMS and GREMLIN Reflectivity using the Method for Object-Based Diagnostic EvaluationAbstract
The Multi-Radar Multi-Sensor system (MRMS) is a mosaic product that integrates data from many sources, such as models, observations, and radars in both the United States and Canada. Since its operational implementation in 2014, it has proven to be a useful tool for forecasting, data assimilation, and forecast verification. However, despite its advantages, MRMS has considerable gaps in coverage in particularly data-sparse locations, such as mountainous regions and over the Gulf of Mexico. A proposed solution in order to fill these gaps is the use of satellite-derived reflectivity products, such as GOES Radar Estimation via Machine Learning to Inform NWP (GREMLIN). GREMLIN is a convolutional neural network that estimates the composite reflectivity field from infrared satellite observations. This project aims to compare GREMLIN’s estimated composite reflectivity to MRMS’s using the Method for Object-based Diagnostic Evaluation (MODE). MODE is more comparable to a human’s evaluation than traditional verification methods, as it allows for consideration of differences in magnitude, displacement, and other metrics. This comparison will serve as an evaluation of GREMLIN’s performance, and potentially its plausibility as a supplemental data source or replacement for MRMS in data assimilation and forecast verification applications.
-
Clara Caspard
School: Pomona College
Major: Mathematics and Physics
NOAA Affiliation: OAR ESRL Global Monitoring Lab
Research Title
Analysis of Texas Ozone ProfilesAbstract
This presentation covers ozone as a chemical compound, including its variability with time as a function of altitude from Earth’s surface. I will be going over the work that takes place in NOAA’s ozonesonde lab and at the Marshall Field station in Boulder, CO to prepare, deploy, and recondition ozonesonde instruments that measure aeronautical ozone concentrations. This includes an overview of the science and technology that allows these instruments to measure ozone concentrations. Lastly, I will be providing an analysis of ozone concentrations measured in September of 2013 between Houston and Smith Point, a more rural location approximately 40 miles southeast of the city, considering the effects of metropolitan activity on air quality.
-

Jacob Tatum
School: Virginia Polytechnic University
Major: Meteorology
NOAA Affiliation: NWS NCEP Weather Prediction Center
Research Title
Verification of the WPC Winter Storm Severity IndexAbstract
The Winter Storm Severity Index (WSSI) is a tool produced by the Weather Prediction Center. It categorizes the amount of impact expected due to weather phenomena including, Blowing Snow, Ground Blizzard, Flash Freeze, Ice, Snow Load, and Snow Amount. Culminating in an Overall conditions summary that is the maximum impact from any of the other components. The WSSI uses geospatial analysis to denote the level of impact with respect to the location of the event. These impact levels include Winter Weather Area, Minor, Moderate, Major, and Extreme impacts. With new thresholds created and algorithms being tested it is important to verify this living product. Analyzing the 2021-2022 and 2022-2023 winter seasons of WSSI by County Warning Area (CWA) and CONUS gives the forecasters and the development team an improved view of the statistics inclusive of each impact and component. Higher elevations skewed results for the average counts by CWA, especially within the CWAs containing the Sierra Nevadas and the Cascades. Implementing a mountain mask could help in reducing the over forecasting of impacts experienced in these CWAs such as the Seattle, Portland, Sacramento, and Hanford Offices. Overall seasonal statistics will be presented highlighting where winter weather impact is seen spatially and quantitatively. Impact verification is needed in addition to subjective storm reports and objective snow amounts. An experimental winter weather impacts category was added to mPING this year that allows the user to report new winter impact categories. This new level of information allows for a more direct assessment of the WSSI’s forecasts and can be verified more accurately with respect to over or under forecasting. With mMPING data being collected, verification for specific events can be processed with greater accuracy. However, one discrepancy that must be accounted for is nonresponse bias. With cities having denser populations and agricultural areas having a vested interest in weather conditions there is a plethora of impact reports in these areas. There are pockets within CONUS (western mountains, deserts, and nonagricultural rural areas) where there is a lack of responses. This must be taken into account otherwise these regions appear to be significantly over forecasted. This presentation will show examples of specific events with mPING data plotted overtop of the WSSI Overall forecasts as well as information from storm data release cases.
-
Justin Hassel
School: Pennsylvania State University
Major: Atmospheric Science
NOAA Affiliation: NESDIS GOES-R Office
Research Title
Automated Tasking Tool for Optimal Placement of GOES-R Mesoscale Sectors (joint with Kyndra Buglione)Abstract
The NOAA National Centers for Environmental Prediction (NCEP) produce and maintain over 100 probabilistic forecast products for a variety of different hazards, time scales, and audiences. There have been recommendations from some areas of the community to standardize the presentation of these products. An in-depth analysis and visualization of NCEP probabilistic products can help NCEP and the weather community understand these products before any attempt to standardize them is made. Important characteristics to document were identified, and then the products were cataloged using these set characteristics. In order to ensure that the characterization is complete and accurate, members of Center leadership were sent sections of the spreadsheet with their respective Center’s data for feedback. The spreadsheet was then revised and analyzed. To show the variety of probabilistic products that exist, “forecast funnels” for a number of different weather events (extreme heat, tropical cyclones, severe convection, winter weather, and flooding) were created only using NCEP probabilistic products. Multiple Centers were represented in each funnel, with the Climate Prediction Center (CPC) and Weather Prediction Center (WPC) being represented in all funnels. Combined with data analysis, these funnels show that temperature, precipitation, and their related hazards (flooding, heat index, blizzard, etc.) are the most popular hazards to communicate probabilistically, and CPC and WPC produce the most probabilistic products.
-
Kyndra Buglione
School: Montana State University
Major: Electrical Engineering
NOAA Affiliation: NESDIS GOES-R Office
Research Title
Automated Tasking Tool for Optimal Placement of GOES-R Mesoscale Sectors (joint with Justin Hassel)Abstract
The NOAA National Centers for Environmental Prediction (NCEP) produce and maintain over 100 probabilistic forecast products for a variety of different hazards, time scales, and audiences. There have been recommendations from some areas of the community to standardize the presentation of these products. An in-depth analysis and visualization of NCEP probabilistic products can help NCEP and the weather community understand these products before any attempt to standardize them is made. Important characteristics to document were identified, and then the products were cataloged using these set characteristics. In order to ensure that the characterization is complete and accurate, members of Center leadership were sent sections of the spreadsheet with their respective Center’s data for feedback. The spreadsheet was then revised and analyzed. To show the variety of probabilistic products that exist, “forecast funnels” for a number of different weather events (extreme heat, tropical cyclones, severe convection, winter weather, and flooding) were created only using NCEP probabilistic products. Multiple Centers were represented in each funnel, with the Climate Prediction Center (CPC) and Weather Prediction Center (WPC) being represented in all funnels. Combined with data analysis, these funnels show that temperature, precipitation, and their related hazards (flooding, heat index, blizzard, etc.) are the most popular hazards to communicate probabilistically, and CPC and WPC produce the most probabilistic products.
-

James Park
School: Vanderbilt University
Major: Chemistry
NOAA Affiliation: NWS NCEP Environmental Modeling Center
Research Title
Evaluation of the NOAA National Air Quality Forecast Capability (NAQFC)Abstract
Air quality is determined by the extent to which ambient air has no harmful pollutants that can affect human health, ecological systems, and/or visibility (WHO, 2006). Primary air pollutants are emitted into the atmosphere whereas secondary air pollutants form in the atmosphere. The operational NOAA National Air Quality Forecast Capability (NAQFC) utilizes the Community Multiscale Air Quality (CMAQ) model, which is driven by the NCEP Global Forecast System (GFS) meteorological model (AQMv6). An Air Quality Model (AQM) v7 has been developed and is under experimental testing at NOAA. AQMv7 couples the CMAQ-based chemistry model with the FV3-based atmosphere model within the Unified Forecast System (UFS) frame. This model transitions from the offline-coupled GFS-CMAQ system to an online-coupled UFS-based online-CMAQ and is showing promising improvements in predicting hourly PM 2.5 and the daily maximum 8-hr averaged ozone concentrations. This project aims to evaluate the NOAA air quality model meteorological and atmospheric chemistry predictions from the summer of 2022. Specifically, analyzing the July 20-22, 2022 ozone exceedance event affecting metropolitan NYC and Long Island—the most widespread ozone event of the season. Using the EPA Photochemistry Assessment Monitoring System (PAMS) and the AirNow air quality datasets, detailed chemistry measurements were used to analyze the performance of the model. Analysis was performed for ozone, NO2, and NO chemical compounds. Overall, there are mixed results for predictions using the AQMv7 when compared to the v6 for the high impact ozone case of July 20-22, 2023. However, though predictions improved for the exceedance case, the model produced unfavorable results in non-exceedance areas, producing conflicting results.
-
Julianna Yapur
School: University of Maryland College Park
Major: Environmental Science
NOAA Affiliation: OAR Climate Program Office
Research Title
Transformational Adaptation as a Climate Response Strategy: Exploring Definition, Literature, and its Role in NOAA’s CAP/RISA ProgramAbstract
Transformational adaptation has emerged as a crucial climate response strategy aiming to address the multifaceted challenges posed by climate change. The National Oceanic and Atmospheric Administration's (NOAA) Climate Adaptation Partnerships program (CAP), formerly the Regional Integrated Sciences and Assessments (RISA) program, is at the forefront of strengthening adaptation efforts while prioritizing equity and justice in the face of climate change. CAP/RISA fosters collaborative partnerships between researchers, decision-makers, and communities that co-create actionable knowledge and solutions that address the specific climate challenges faced by different regions. CAP/RISA’s commitment to community engagement aims to build trust and collaboration by uplifting the voices and needs of frontline communities, recognizing that equitable adaptation practices require an understanding of the social, economic, and cultural contexts in which they operate. This project examines the prevalence of transformational adaptation in the global literature and highlights why it is an essential strategy for building resilience and sustainability in the face of climate uncertainty. We explore the concept of transformational adaptation through a review of scholarly work, case studies, and informal interviews. Our analysis reveals a growing recognition of the need for transformative approaches that move beyond incremental changes and fundamentally reshape social, economic, and environmental systems. We highlight its potential to foster systemic change, enhance adaptive capacity, promote equity and social justice, and enable long-term resilience at multiple scales. This underscores the urgency for transformative approaches and the importance of integrating such strategies into climate policy, planning, and decision-making processes. By centering their efforts around equity and justice, CAP/RISA is driving a transformative shift in how climate adaptation is approached, making it more holistic, responsive, and capable of creating long-lasting change for all communities, particularly those most at risk from the impacts of climate change.
-

Dean Calhoun
School: Purdue University
Major: Applied Mathematics
NOAA Affiliation: NWS OSTI Meteorological Development Lab
Research Title
Improving Probabilistic Forecasting of Thunderstorms Using a 2D Convolutional Neural NetworkAbstract
Machine learning is a powerful tool with the potential to advance the NWS’s objective to provide probabilistic impact-based decision support services by making skillful probabilistic predictions. A type of machine learning model called a 2-D convolutional neural network (CNN) uses a linear operator known as convolution to process image data into feature maps, which are used to create predictions. These predictions are evaluated using a loss function, which is then used to change the model weights to improve future predictions. Previous work by Dr. Mamoudou Ba has shown that a CNN training using 13 HRRR input variables can be used to create probabilistic predictions of thunderstorms with skill matching or exceeding HRRR reflectivity forecasts. This project investigates whether the addition of a new training variable improves prediction skill. The new inputs tested are HRRR lightning rate and LAMP probability of convection. In both cases, the new data significantly improves model performance. The improvement is greatest in the latter case, as the model tends to incur less bias and produce fewer over-forecasts. Tuning of additional model parameters is suggested to further improve probabilistic forecast capabilities.
-
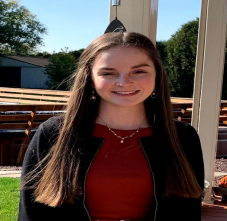
Keelie Steiner
School: Millersville University
Major: Meteorology
NOAA Affiliation: OAR Climate Program Office
Research Title
Visualizing the Earth’s Radiation Budget (ERB) PortfolioAbstract
Science communication is important for building trust between the general public and government researchers, which proves to be especially true for federal programs new to the public eye such as the National Oceanic and Atmospheric Administration’s (NOAA) Earth’s Radiation Budget (ERB) Initiative. This project evaluates ongoing scientific research through literature reviews and connects necessary research gaps to ERB’s projects in order to create the foundation for an interactive visualization. Furthermore, exploratory citation maps demonstrate how ERB publications are being referenced in other scientific literature and what other publications are influencing the work of ERB publications. Lastly, this project culminated in an opinion piece inspired by one of the gaps identified during literature review. The essay analyzes the possible health concerns as a result of solar radiation management (SRM) research and engages with the ongoing discussion of SRM. Through this project, it is made apparent that SRM research is an up and coming field with many research areas that need to be addressed before fully understanding the impact and capability of SRM.
-

Alekya Srinivasan
School: Pennsylvania State University
Major: Meteorology
NOAA Affiliation: OAR Weather Program Office
Research Title
Insights, Strategies, and Perspectives from the Inaugural UFS/EPIC Student AmbassadorAbstract
Interpreting and visualizing the future for programming and technological advancements is essential for adapting to the ever changing scientific community. The position of Student Ambassador for the Unified Forecast System (UFS) signifies the importance of engaging with a diverse background of users across the Weather Enterprise. Composed of many different sectors, including industry, private sector, and academia, the Weather Enterprise is a crucial component of maintaining community engagement connections and technical support. However, recent research shows that academic participation levels are lower compared to industry or the private sector. In order to promote innovative change, this project will venture and combine two different routes: (1) performing outreach to collect qualitative data from universities and students and (2) evaluating UFS tutorials/training materials to measure their usability in an academic setting. Contacting universities with renowned atmospheric science and/or computer science programs to discover current and future interests regarding programming or Numerical Weather Prediction (NWP) will inform scientists from different backgrounds about how they can further adapt to the community’s needs. The research process, findings, and ideas have been presented at the Unifying Innovations in Forecasting Capabilities Workshop (UIFCW) in Boulder, Colorado. The innovative information, recommendations, and future steps developed throughout the summer will be compiled into a technical report, a UFS Student Engagement Plan, and an overall final report, all written from an undergraduate student perspective.
-

Kyra Schlezinger
School: University of Washington at Seattle
Major: Atmospheric Science
NOAA Affiliation: NWS NCEP Office of Director
Research Title
Summarization of Probabilistic Products across all NCEP CentersAbstract
The NOAA National Centers for Environmental Prediction (NCEP) produce and maintain over 100 probabilistic forecast products for a variety of different hazards, time scales, and audiences. There have been recommendations from some areas of the community to standardize the presentation of these products. An in-depth analysis and visualization of NCEP probabilistic products can help NCEP and the weather community understand these products before any attempt to standardize them is made. Important characteristics to document were identified, and then the products were cataloged using these set characteristics. In order to ensure that the characterization is complete and accurate, members of Center leadership were sent sections of the spreadsheet with their respective Center’s data for feedback. The spreadsheet was then revised and analyzed. To show the variety of probabilistic products that exist, “forecast funnels” for a number of different weather events (extreme heat, tropical cyclones, severe convection, winter weather, and flooding) were created only using NCEP probabilistic products. Multiple Centers were represented in each funnel, with the Climate Prediction Center (CPC) and Weather Prediction Center (WPC) being represented in all funnels. Combined with data analysis, these funnels show that temperature, precipitation, and their related hazards (flooding, heat index, blizzard, etc.) are the most popular hazards to communicate probabilistically, and CPC and WPC produce the most probabilistic products.
-

Anthony David Jr.
School: Harrisburg Institute of Science and Technology
Major: Environmental Science and Technology
NOAA Affiliation: OAR Weather Program Office
Research Title
A Climate Adjusted Approach to Major Flooding EventsAbstract
American Gulf and Atlantic coastal regions and islands are at higher risk of extreme weather events and subsequent impacts, especially coastal and inland flooding. Flood events have a disproportionate impact on vulnerable communities and exacerbate issues such as increasing economic instability, disrupting access to food and household resources, and aggravating existing health disparities.
The aim of this research is to look at priority locations where interventions can mitigate both physical and social aspects of vulnerability related to flooding in the New Orleans area. This analysis overlays CDC Social Vulnerability Index data with NOAA’s flood extent data from LEO and GEO satellites in combination with other social science and flood-related data. A spatial analysis using bivariate local indicators of spatial association to map spatial clusters of extreme flood extent in socially vulnerable areas will also be presented.
-

Laura Dailey
School: University of Delaware
Major: Meteorology, Climate Science
NOAA Affiliation: OAR Weather Program Office
Research Title
Guidelines for Measuring, Defining, and Fostering Innovations in Earth Prediction SystemsAbstract
This investigation was inspired by NOAA’s Weather Program Office (WPO) FY2023 Innovations for Community Modeling Competition, which funds high-risk, high-reward research to advance forecasting methods for the Unified Forecast System (UFS). My project aims to develop guidelines for WPO to understand the meaning of innovation in the research-to-operations process for Earth Prediction Systems. Based on my findings from this research, I will analyze priority areas for innovation metrics that are valuable when reviewing proposals for future Notice of Funding Opportunities (NOFOs). I will also design metrics for WPO to expand initiatives to
inspire innovation within the office and in its engagement with key stakeholders. I will suggest additional activities and efforts that can be implemented in WPO to better foster innovation with its mission of improving Earth prediction systems, such as the UFS, and to gain new perspectives from all members in the community. One of the intended outcomes of my research is to ensure we attract and fund innovative proposals rather than incremental changes in future NOFOs that focus on innovations, and hopefully my suggestions will lead to the development of an ‘innovation learning agenda’ for the office.
