QPE Mosaic Process - Warning Decision Training Division (WDTD)
Navigation Links
Products Guide
QPE Mosaic Process
Short Description
Most of the Multi-Radar / Multi-Sensor (MRMS) Quantitative Precipitation Estimate (QPE) products are mosaicked onto a national Cartesian grid. For each grid point, there may be data from multiple radars available. The mosaic process uses a distance- and height-weighted mean scheme to determine the final value at each grid point.
Subproducts
None.
Primary Users
None. This is not a stand-alone MRMS product, but rather is used to mosaic many other MRMS products.
Input Sources
Radar Reflectivity, Radar Blockage Maps, Radar Quality Index
Resolution
Spatial Resolution: 1km x 1km
Temporal Resolution: 2 minutes
Product Creation
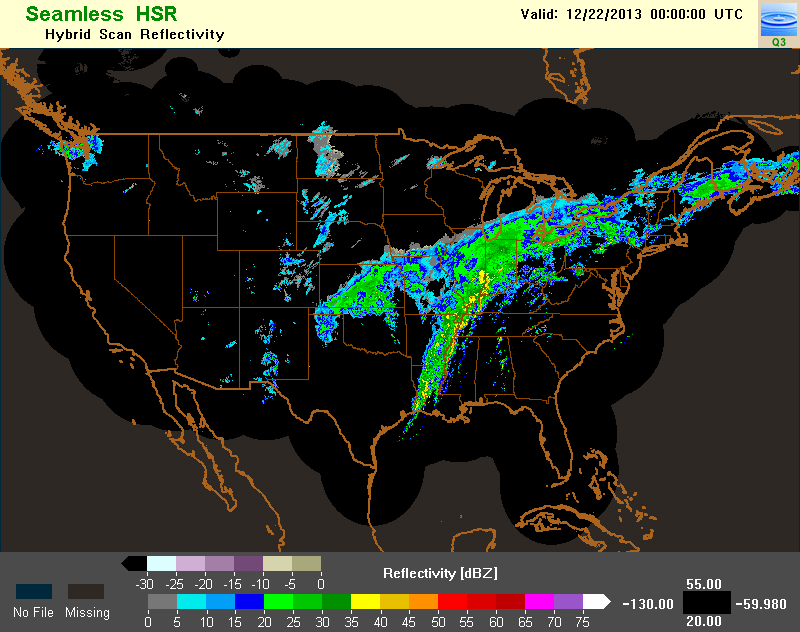
Many areas in the MRMS domain are covered by multiple radars. An ideal method to get the most accurate precipitation rate estimate at the ground is to take data from the lowest radar bin, among multiple radars, that is not significantly blocked. For beams that are blocked by more than 50%, the next elevation angle is used. Those bins constitute a 2-D polar grid called “hybrid scan” reflectivity (HSR; Fulton et al. 1998). However, this method produces discontinuities between neighboring radars due to different radar wave propagation, calibration biases, etc. To mitigate these discontinuities, the “seamless” hybrid scan reflectivity (SHSR) was developed at each radar site, and then mosaicked using a distance-weighted mean of reflectivities for bins that have 10-50% blockage.
The first step in the process to create this spatially-continuous mosaicked product is to remap the single product fields from 2D polar to a national Cartesian grid via a nearest neighbor approach. Then, for each grid point that has multiple radar coverage, a decision tree is used to decide the final reflectivity value at that point (Figure 1). The tree first determines whether the lowest altitude datum (among all overlapping radars) has precipitation or no precipitation using reflectivity from the SHSR. This mitigates false accumulations for precipitation evaporating before reaching the ground. The next several steps determine if the radar quality is sufficient at that point. The higher the Radar Quality Index (RQI), the more certain the quality is good and the radar is less affected by freezing level height contamination and terrain blockage.
The process starts with finding overlapping radars that have a high RQI threshold (RQI ≥ 0.9). If the criteria are met, then only those radars’ data are weighted to get the final value. Subsequently, lower thresholds are used until either a final value or “no coverage” is determined at that point. The purpose of having multiple thresholds is to assure continuity in the mosaic field while minimizing the impact of data from higher altitudes that might not be representative of what is occurring at the ground.
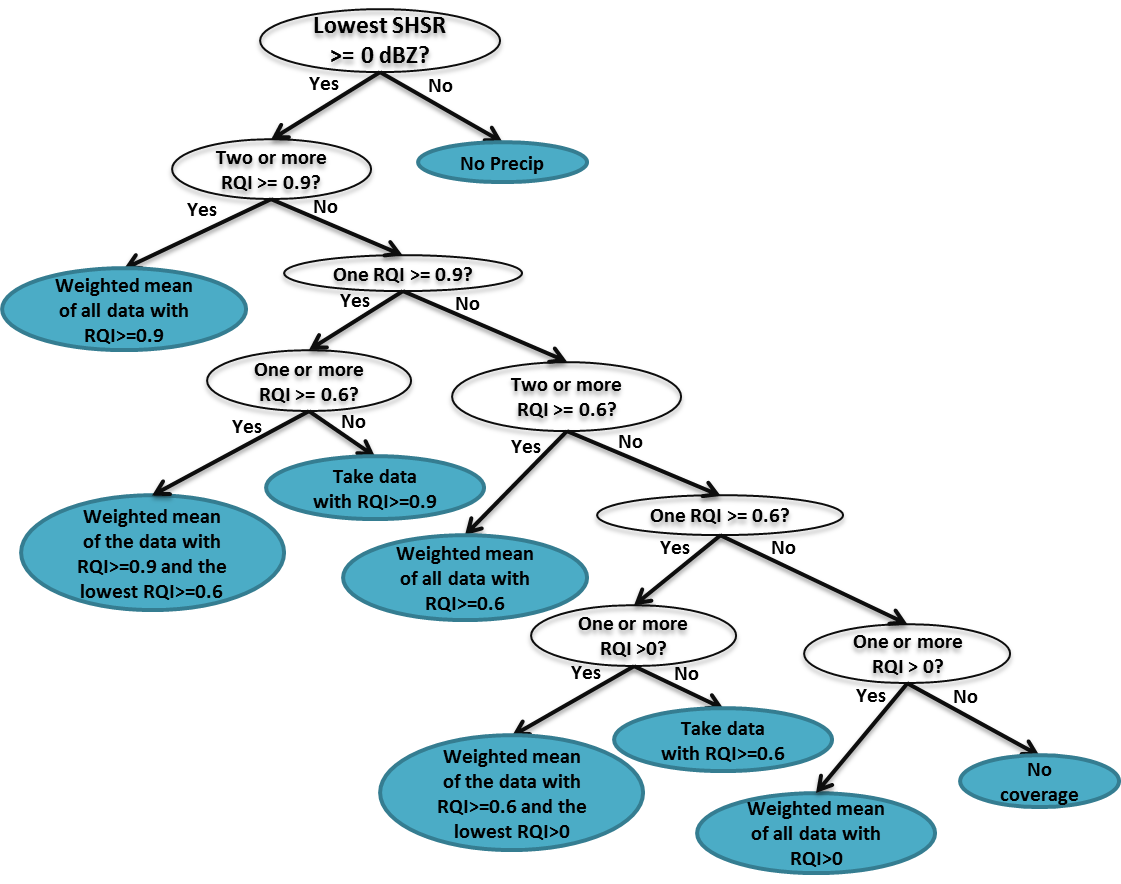
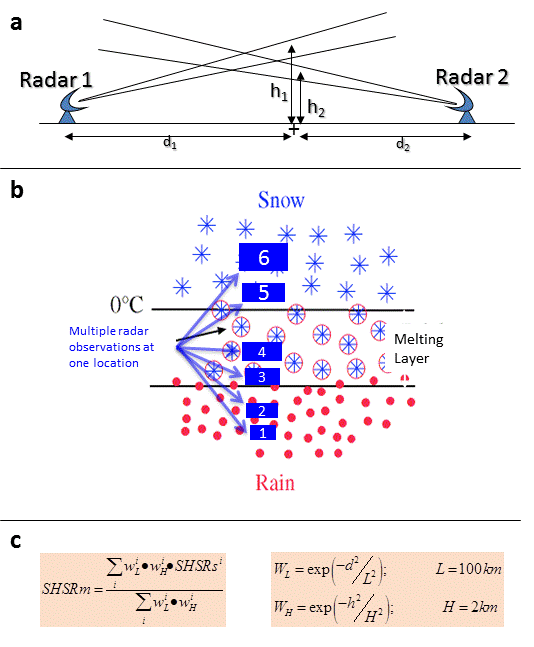
Figure 2 further illustrates the distance-weighting process for a field such as the SHSR product. Consider a point “+” in Figure 2a. The candidate reflectivity data for this point comes from Radar 1 and Radar 2. The values from both radars are weighted according to distance (d1 and d2), height (h1 and h2), and Radar Quality Index (RQI) thresholds. Remember, only data meeting the RQI thresholds defined by the decision tree are retained for the weighting process.
For the simple case where there is no terrain blockage present, the contributing radars’ SHSR data are grouped into “liquid”, “mixed”, and “ice” categories based on their heights with respect to the top and bottom of the melting layer. Figure 2b shows a scenario where six different radars have observations at various heights at a given location. If the “liquid” category (i.e. the lowest group) is found to have valid data (via the RQI thresholds), then only that group’s data is used in the weighted mean. If none are available, radars within the melting layer are considered, and then finally the ice region. This process eliminates choppy transitions within the mosaic.
The SHSR equation uses exponential weighting functions (Figure 2c) to calculate the grid point SHSR value. At the grid point in question, higher weights are given to shorter distance from the radar (small d) and beam axis closer to the ground (small h). The length (L) and height (H) scale factors are set at the default values of 100 km and 2 km, respectively.
Technical Details
Latest Update: MRMS Version 12 (due to update in RQI; no other changes to mosaic process)
References
Zhang, J., K. Howard, S. Vasiloff, C. Langston, et al., 2011: National Mosaic and multi-sensorQPE (NMQ) system: description, results and future plans. Bull. Amer. Met. Soc., 92, 1321-1338.
Zhang, Jian, et al. "Radar-based quantitative precipitation estimation for the cool season in complex terrain: Case studies from the NOAA Hydrometeorology Testbed." Journal of Hydrometeorology 13.6 (2012): 1836-1854.
Zhang, J., K. Howard, S. Vasiloff, C. Langston, B. Kaney, Y. Qi, L. Tang, H. Grams, D. Kitzmiller, J. Levit, 2014: Initial Operating Capabilities of Quantitative Precipitation Estimation in the Multi-Radar Multi-Sensor System. 28th Conf. on Hydrology, Amer. Meteor. Soc.
Other MRMS product documentation: RQI, SHSR, Height of SHSR
Applications
The mosaic process is used for RQI, SHSR, and Height of SHSR. The precipitation estimation products, which are also on a mosaicked grid, are created from mosaicked SHSR fields.
Example Images