Gauge Quality Control - Warning Decision Training Division (WDTD)
Navigation Links
Products Guide
Gauge Quality Control
Short Description
Algorithm that flags the hourly gauge data and identifies reports that most likely contain errors and may degrade the quality of gauge-derived products.
Subproducts
None.
Primary Users
None. This algorithm is not a stand-alone product, but rather is primarily incorporated into other products, such as the Multi-Sensor QPE, Mountain Mapper QPE and Radar QPE w/ Gauge Bias Correction.
Input Sources
HADS and MADIS gauge networks; Radar Quality Index; 1-hr QPE – Radar Only; hourly model Surface Wet-Bulb Temperature; model QPF
Resolution
Spatial resolution: n/a
Temporal resolution: 60 minutes (with latencies due to gauge collection)
Product Creation
The Gauge Quality Control (QC) algorithm goes through a series of steps to determine if a gauge report falls into one of the categories that could cause it to be omitted in gauge-based product generations. The QC flags gauges that:
- Report accumulations that are more than 7 minutes outside of the valid time
- Missing data
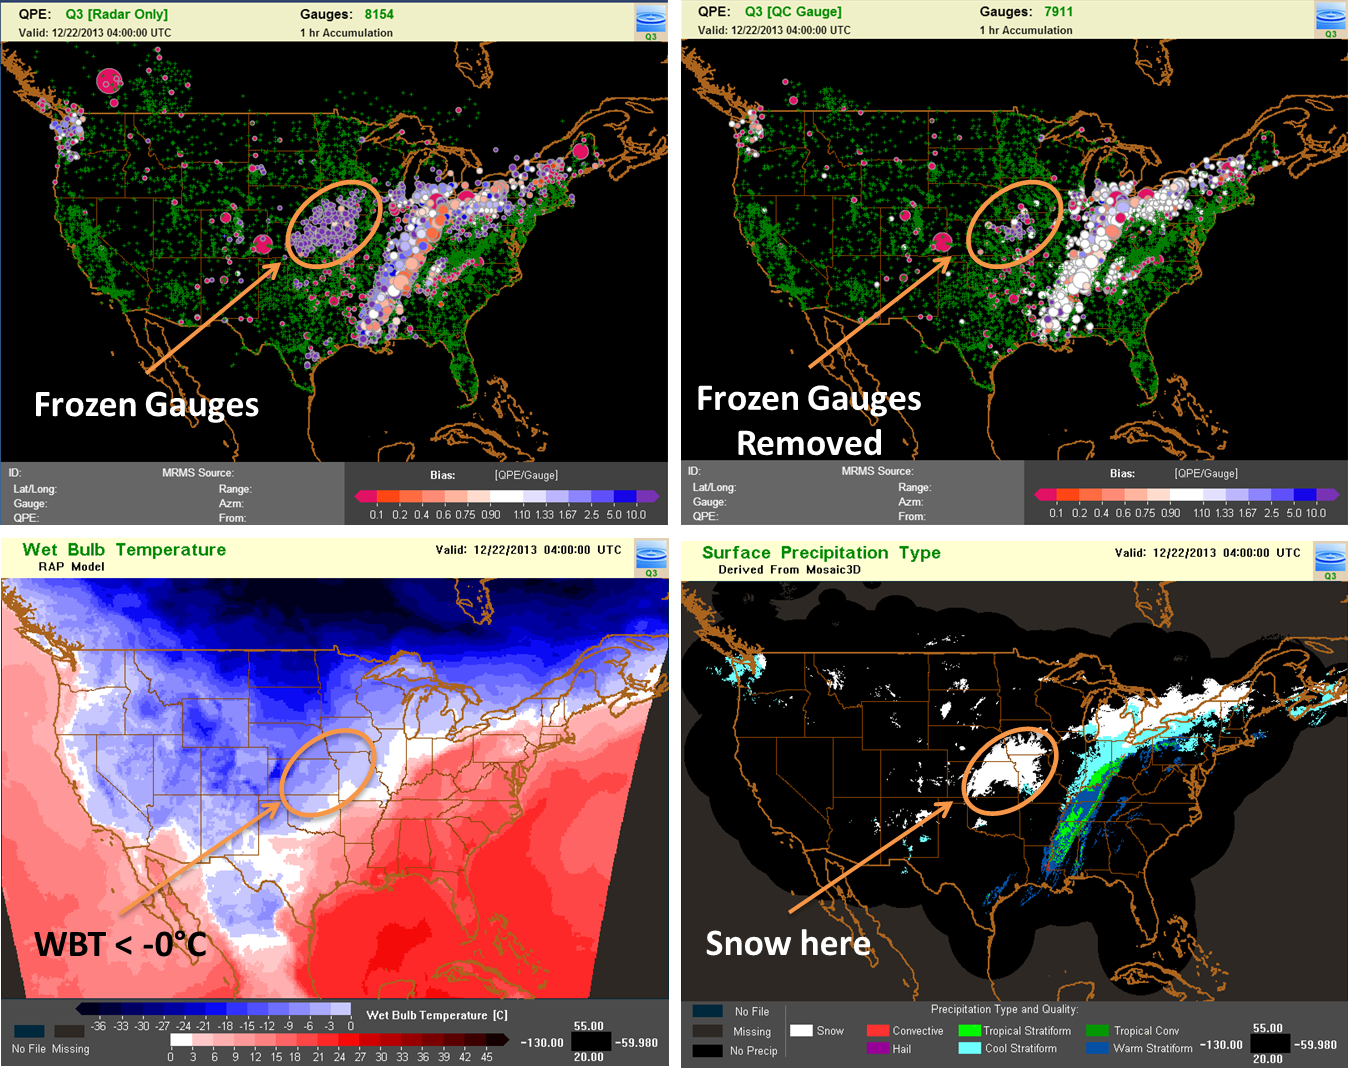
- May be frozen due to winter precipitation
- May be suspect due to poor radar quality that makes comparison impossible
- Report “false zero” as compared to the QPE - Radar Only and model QPF
- Report “false precipitation” as compared to the QPE - Radar Only and model QPF
- Are considered “outliers high” based on maxima from power curves
- Are considered “outliers low” based on minima from power curves
Technical Details
Latest update: MRMS version 12.2
Below is a short description of the Gauge QC logic tree as it categorizes each gauge:
- Hourly gauges that have non-missing values and are within the domain undergo an initial time check to retain gauges that are within +/- seven minutes from the top of the hour. This is to prevent the introduction of biases of a significant rain event during the top of the hour based solely on large time differences from the observation time. Gauges are then paired with a best matched collocated grid cell using a 1-km radius.
- Gauge observations are identified based on whether the observation is zero or non-zero and if the surface wet bulb temperature is above of below 0C. The use of the wet bulb temperature is to account for winter precipitation in above-freezing ambient temperatures.
- The type of gauge QC applied to the gauge is then based on the adequacy of radar data through the use of the Radar Quality Index (RQI) product.
- For gauges located in areas where the RQI < 0.40, the HRRR model QPF is considered as a mask to help identify areas where precipitation existed (or not) in combination with the radar for certain situations. The actual values are not considered given the potential overshooting of precipitation with radar and large variations in biases of QPF values in the HRRR.
- There are suspect checks that mitigate the introduction of false observations in areas of poor radar coverage. The suspect check value is set at 50.8 mm in rain and 10.16 mm in winter precipitation.
- For gauges located in areas that are adequately covered by radar (i.e. RQI >= 0.40), the gauge value is directly compared to the radar value. The equations that define the curves for rainfall regimes are dynamically varying based on RQI, where the greater the RQI value, the more leeway that is given in the gauge vs. radar comparison. The equations that govern winter precipitation are more strict, especially for the lower outlier comparison. Gauges that are less than 80% of the radar value are flagged based on studies showing the partial impacts of frozen precipitation impeding the recording of a liquid-equivalent value.
- A suspect check is applied for winter precipitation to remove potentially high outlier observations as well.
- For gauges located in areas where the RQI < 0.40, the HRRR model QPF is considered as a mask to help identify areas where precipitation existed (or not) in combination with the radar for certain situations. The actual values are not considered given the potential overshooting of precipitation with radar and large variations in biases of QPF values in the HRRR.
- Fail-safes are built into the logic in case radar data and/or HRRR data is missing regardless of RQI.
A 21-month study on the gauge quality control algorithm showed that an average of 86.6% of gauge observations per hour are passed or conditionally passed for use in MRMS.
References
Martinaitis, S. M., Cocks, S. B., Simpson, M. J., Osborne, A. P., Harkema, S. S., Grams, H. M., ... & Howard, K. W. (2021). Advancements and Characteristics of Gauge Ingest and Quality Control within the Multi-Radar Multi-Sensor System. Journal of Hydrometeorology, 22(9), 2455-2474. https://doi.org/10.1175/JHM-D-20-0234.1
Martinaitis, S. M., Osborne, A. P., Simpson, M. J., Zhang, J., Howard, K. W., Cocks, S. B., ... & Kaney, B. T. (2020). A physically based multisensor quantitative precipitation estimation approach for gap-filling radar coverage. Journal of Hydrometeorology, 21(7), 1485-1511. https://doi.org/10.1175/JHM-D-19-0264.1.
Qi, Y., S. Martinaitis, J. Zhang, and S. Cocks, 2016: A real-time automated quality control of hourly rain gauge data based on multiple sensors in MRMS system. J. Hydrometeor., 17, 1675–1691.
* Zhang, J., K. Howard, S. Vasiloff, C. Langston, B. Kaney, Y. Qi, L. Tang, H. Grams, D. Kitzmiller, J. Levit, 2014: Initial Operating Capabilities of Quantitative Precipitation Estimation in the Multi-Radar Multi-Sensor System. 28th Conf. on Hydrology, Amer. Meteor. Soc.
* Zhang, J., K. Howard, S. Vasiloff, C. Langston, et al., 2011: National Mosaic and multi-sensor QPE (NMQ) system: description, results and future plans. Bull. Amer. Met. Soc., 92, 1321-1338.
Other MRMS product documentation: RQI, QPE - Radar Only, QPE - Radar w/ Gauge Bias Correction, QPE - Gauge Only, QPE - Mountain Mapper
* Changes were applied to the QC algorithm after the completion of both of these references.
Applications
The Gauge QC algorithm is applied to gauge data before the data is used in the Multi-Sensor QPE, Radar QPE w/ Gauge Bias Correction, and Mountain Mapper QPE products. Further, the quality-controlled gauges can provide more accurate evaluations of independent QPE products than gauges without the QC.
Example Images