
The Great Flood of 1993 - National Weather Service Heritage
The Great Flood of 1993
By NWS Heritage Projects Editorial StaffEditor's Note: The following article first appeared at https://www.weather.gov/lsx/1993_flood, retrieved October 9, 2019, 2:52 p.m. MST.
The size and impact of the Great Flood of 1993 was unprecedented and has been considered the most costly and devastating flood to ravage the U.S. in modern history. The number of record river levels, the aerial extent, the number of persons displaced, amount of crop and property damage and its duration surpassed all earlier U.S. floods in modern times.
Uniquely extreme weather and hydrologic conditions led to the flood of 1993. The stage was set in 1992 with a wet fall which resulted in above normal soil moisture and reservoir levels in the Missouri and Upper Mississippi River basins.
These conditions were followed by persistent weather patterns that produced storms over the same locations. Their persistent, repetitive nature and aerial extent throughout the late spring and summer, bombarded the Upper Midwest with voluminous rainfall amounts. Some areas received more than 4 feet of rain during the period.
In the St. Louis National Weather Service (NWS) forecast area encompassing eastern Missouri and southwest Illinois, 36 forecast points rose above flood stage, and 20 river stage records were broken. The 1993 flood broke record river levels set during the 1973 Mississippi and the 1951 Missouri River floods.
In April, the Mississippi River had crested 6 to 10 feet above flood stage and once again near the same levels during the month of May. In the beginning of June the rivers dropped below flood stage and were receding. During the second week of June, river levels rose to near flood stage before yet again beginning their slow recession. By the end of June, the Mississippi River was four feet below flood stage at St. Louis, while many other river locations in the region were near flood stage. Precipitation for the month averaged from one inch above normal at Kansas City, to nearly four inches above normal at Springfield.
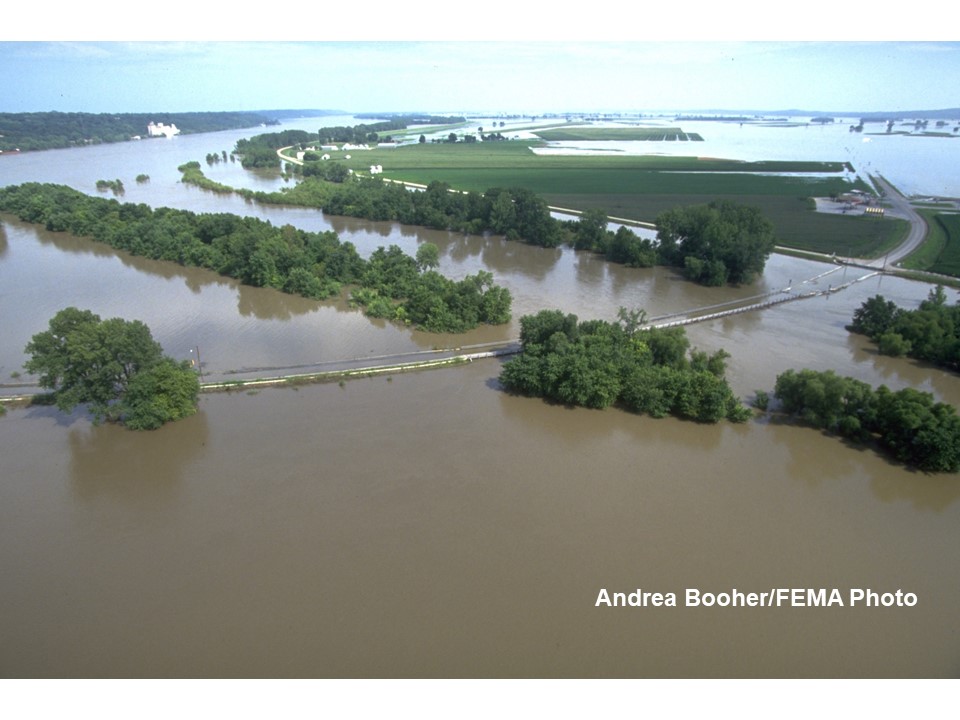
Starting as early as June 7, reports of levees being overtopped and levee breaks became common. These breaches acted to delay the flood crests, temporarily storing excess water in the adjacent lowlands, but the rain kept falling.
July brought more heavy rain to the Missouri and upper Mississippi River basins in Missouri, Iowa, Kansas, Nebraska, North and South Dakota, Illinois and Minnesota. Rainfall amounts of 5 to 7 inches in 24 hours were common. Precipitation for the month averaged from one inch above normal at St. Louis and Springfield, to between six and seven inches above normal at Columbia and Kansas City, Missouri. The copious rain amounts during July sent record setting crests down the Mississippi and Missouri Rivers, causing river gages to malfunction along the way. Both record crests met each other at their confluence near St. Louis within days of each other.
The Mississippi River stalled a few days at the April 1973 record stages, seemingly waiting for the Missouri River to arrive, before pushing levels upwards again, breaking levees, driving people and their possessions to higher ground and causing havoc with anything in its path.
The crests, now combined as one, moved downstream through St. Louis and Chester on its way to the confluence with the Ohio River at Cairo, IL. Only minor flooding occurred below the Ohio due to the drought the eastern U.S. was facing the same time.
Major sandbagging activities were underway on the lower Missouri River, the River Des Perre in St. Louis, the Mississippi River south of St. Louis and on many other tributaries across Missouri and Illinois. Some of these efforts were successful while others were not as the river continued to spawn destruction.
Over 1,000 flood warnings and statements, five times the normal, were issued to notify the public and need-to-know officials of river levels. In places like St. Louis Missouri, river levels were nearly 20 feet above flood stage and had never been this high in its 150 year history. The 52 foot St. Louis Flood wall, built to handle the volume of the 1844 flood, was able to keep the 1993 flood out with just over two feet to spare.
On August 1, levee breaks near Columbia, Illinois flooded 47,000 acres of land, inundating the towns of Valmeyer and Fults, Illinois. The released water continued to flow parallel to the river, approaching the levees protecting historic Prairie du Rocher and Fort de Chartres, Illinois. On August 3, the Corps of Engineers made the tough decision to break through the stronger Mississippi River levee to allow the water back into the river. The innovative plan worked and the historic areas were saved.
On the Missouri River it was estimated that nearly all of the 700 privately built agricultural levees were overtopped or destroyed. Navigation on the Mississippi and Missouri River had been closed since early July resulting in a loss of $2 million (1993) dollars per day in commerce.
The Mississippi River at St. Louis crested at 49.6 feet on August 1, nearly 20 feet above flood stage and had a peak flow rate of 1.08 Million cubic feet per second. At this rate, a bowl the size of Busch Stadium would be filled to the brim in 69 seconds.
Some locations on the Mississippi River were in flood for almost 200 days while locations on the Missouri neared 100 days of flooding. On the Mississippi, Grafton, Ill., recorded flooding for 195 days, Clarksville, Mo, for 187 days, Winfield, Mo., for 183 days, Hannibal, Mo., for 174 days, and Quincy, Ill., for 152 days. The Missouri River was above flood stage for 62 days in Jefferson City, Mo., 77 days at Hermann, Mo.; and for 94 days at St. Charles in the St. Louis metropolitan area. On October 7, 103 days after it began, the Mississippi River at St. Louis finally dropped below flood stage.
In the 20 years since 1993, the NWS has made many improvements to their river forecasting and information delivery systems. Improved science, computing power, model calibration, higher density and more frequent river and rainfall data, along with the Advanced Hydrologic Prediction Service (AHPS) have increased our timeliness and service to the public. AHPS is available on our website at https://weather.gov/lsx. By clicking "Rivers and Lakes" under the heading "Hydrology" in the left margin, it is easy to assess the current stages and river forecasts.
For more information see the NWS Service Assessment by clicking HERE (https://www.weather.gov/media/publications/assessments/93_Flood.pdf).