The Daily Weather Map - National Weather Service Heritage
The Daily Weather Map
By Chris Geelhart (chris.geelhart@noaa.gov)On February 9, 1870, a joint Congressional resolution authorized the Secretary of War to establish meteorological observations at military stations, with the data used to forecast storms on the Great Lakes and the coastlines. The Army Signal Service was assigned the new duties.
According to the 1870 Report of the Chief Signal Officer, a plan was created to execute this new "Division of Telegrams and Reports for the Benefit of Commerce:"
- Selected stations across the United States would be designed to take meteorological observations. Spacing was placed to allow reports of a storm at one station to be relayed to downstream locations before the storm arrived at the new location. It was determined that a series of 3 observations per day (around 8 am, 6 pm, and midnight Washington time) would be adequate for this purpose. A total of 44 stations were selected for this task.
- The observations would be sent via a series of telegraph circuits, to both the central office in Washington, and to other cities, for publication. The process was not expected to exceed one hour.
- To publicize the reports, they would be given to newspapers and consolidated for use in board of trade rooms, merchants' exchanges, or other locations. The data would be plotted on a map for display. As experience was obtained, "deductions" (forecasts) could be attempted for the local area.
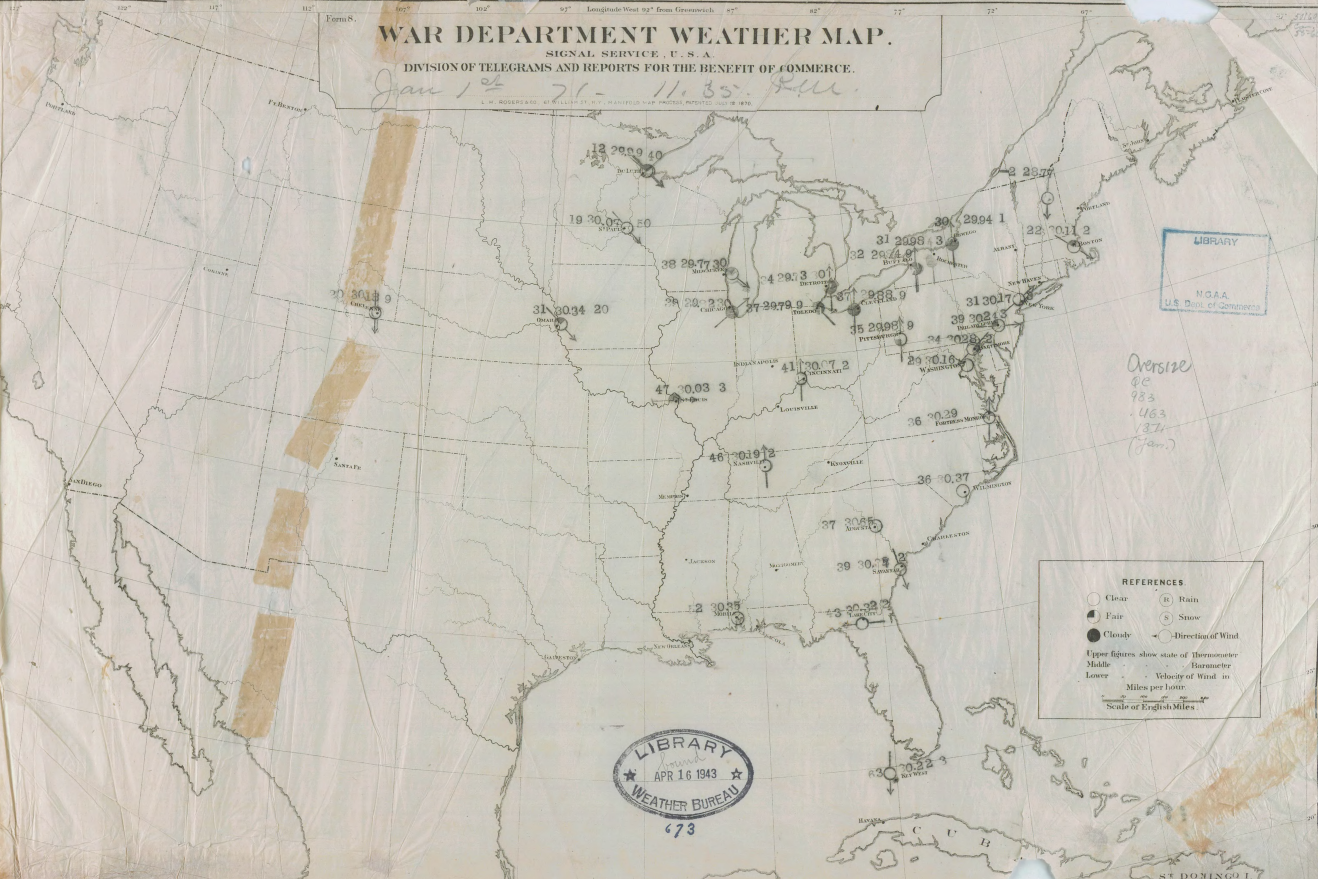
The first map was published on January 1, 1871. Given the sparse number of stations and the inexperience of the new forecasters, the initial maps were quite limited in their display:
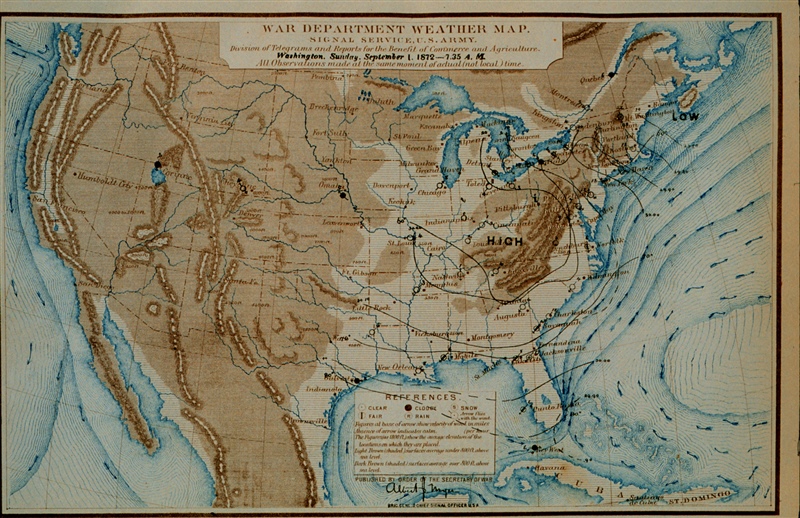
As additional experience was gained, the maps began to include "indications" (forecasts) for a larger area:
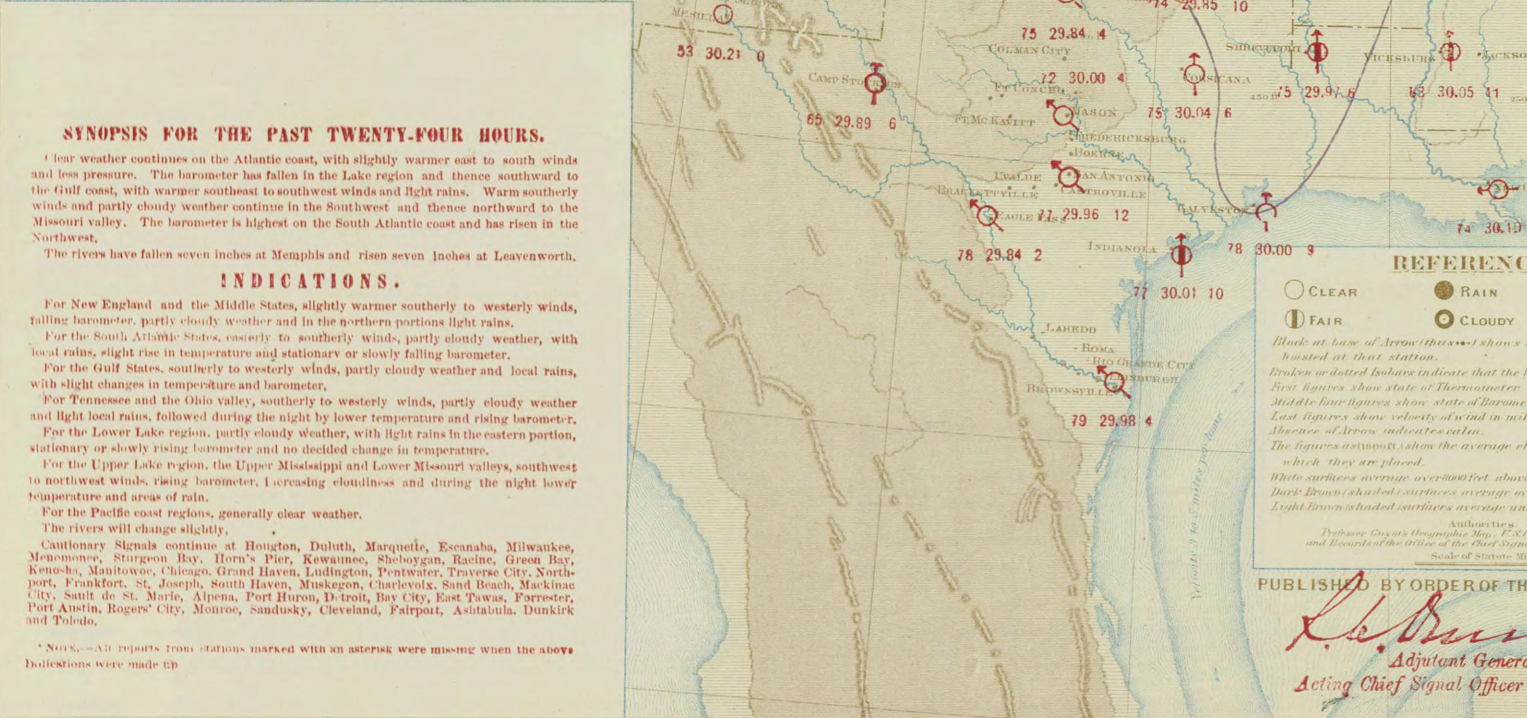
Image: NOAA Central Library Data Imaging Project
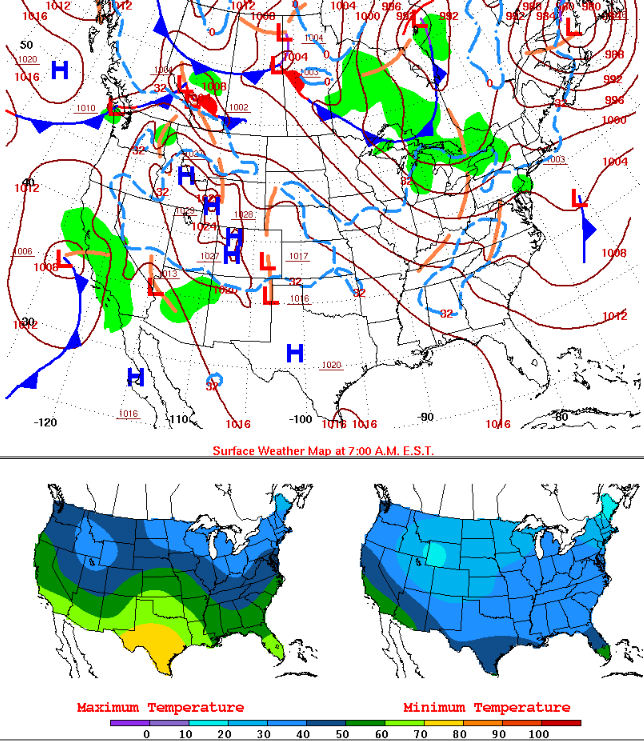
A significant change to the maps occurred on August 1, 1941. They were changed to include several different observed parameters, but the more radical change was the inclusion of "fronts" for the first time. The "Norweigan cyclone model," developed shortly after World War I, had introduced the concept of fronts, but the U.S. did not adopt the usage for many years.
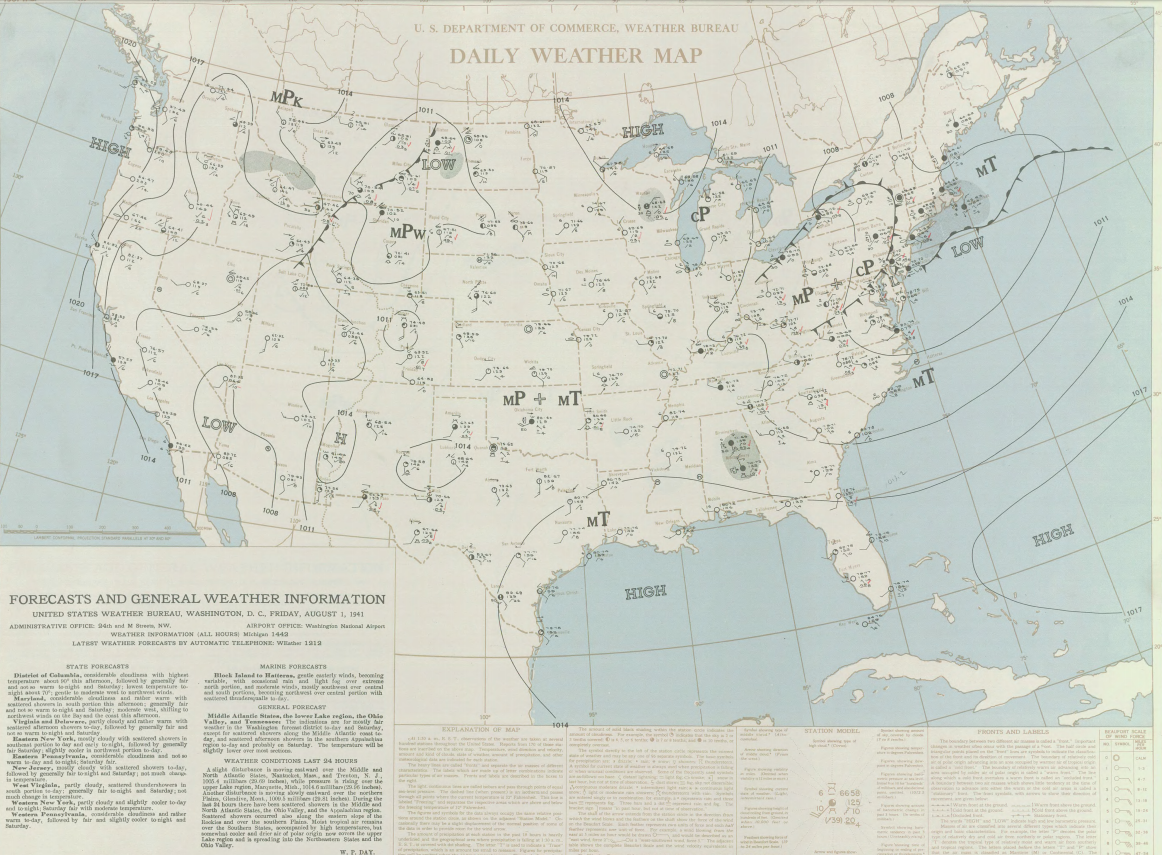
Image: NOAA Central Library Data Imaging Project
Beginning in 1968, the Daily Weather Map publication was changed to a weekly edition. Besides the surface maps, the publication included maps of conditions aloft, high and low temperatures, and precipitation. As the maps were mailed in many cases, the weather data was considered "stale" upon receipt, and considered more of an archive. In 2003, Internet access of the map publication began, allowing for more timely distribution, and continues today at https://www.wpc.ncep.noaa.gov/dailywxmap/index.html .