Origins of NOAA’s U.S. Spring Outlook - National Weather Service Heritage

Origins of NOAA’s U.S. Spring Outlook
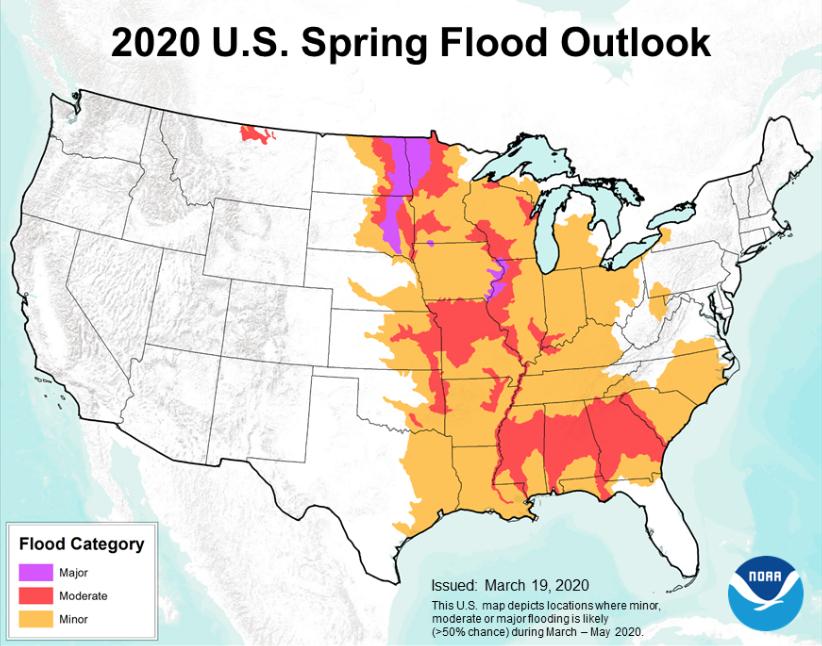
By Emily Senesac (emily.senesac@noaa.gov)Each March, NOAA issues its Spring Outlook, highlighting flood risks and temperature, precipitation, and drought outlooks for April through June. This outlook is one of many that NOAA produces to help communities prepare for weather and environmental conditions as part of the NOAA mission to minimize effects on lives and livelihoods.
The origins of the National Spring Outlook go back more than 30 years, when hydrologic specialists at both the local and national levels came together to share information and collaborate on a report known as the Spring Flood Outlook (SFO).
In the late 1980s, the Hydrometeorological Information Center (HIC) at the National Weather Service Headquarters began creating some of the earliest SFOs, formerly called National Hydrologic Outlooks (NHOs). A team of 5-7 from the HIC would come in on a Friday and work through the weekend to develop the Outlooks. Using data obtained via phone or fax from Weather Forecast Offices (WFOs) and River Forecast Centers (RFCs) across the nation, the team would create reports and graphics that reflected flood potential information and water supply on a national scale. Though these Outlooks were distributed on a bi-weekly basis, and creating them took immense time and effort--these were the days before automation. In other words, all graphics and maps were made by hand, a “master copy” was photocopied, and the finished product was distributed by U.S. mail.
Back then, the team began meeting to develop the National Hydrologic Outlooks at the beginning of January, usually releasing reports until April. However, depending on the snowfall and other occurrences during the winter season, the generation of NHOs could extend later into the spring. Additionally, RFCs and WFOs also released a more localized flood outlook on a bi-weekly basis.
In the summer of 1993, several states across the Midwest were devastated by an event remembered as the Great Flood. Remarkably, those areas had been noted as having above-average river flood potential on the NHO released in the months before. Throughout the month of March, forecasters expanded the area of potential flooding to include the region that would be affected by the flooding in the coming months, an impressive feat considering that the Great Flood was caused by heavy rainfall and saturated soil, not directly as a result of snowmelt, which would have been much easier to predict. This and other catastrophic flooding events catalyzed the development of technology and forecasting abilities that would occur in the years to come.
As technology and communication continued to improve, it became easier and more efficient to gather information from the field and develop the reports. Though email and the internet became a dominant element in the NHO creation process, maps were still drawn by hand before being uploaded and provided online. By the late 1990’s, RFCs began using NOAA’s Ensemble Streamflow Prediction (ESP), a capability that allows the NWS to generate extended range (probabilistic) river forecasts which quantify the forecast certainty, and provided that information electronically to HQ to be used in the NHO. By 2013, a nationally- consistent, long-range river flood risk outlook (LRO) map was added to the NWS web page. The LRO provided a single, nationally-consistent map depicting the 3-month risk of minor, moderate, and major river flooding. This risk information was based on ESP forecasts which are generated for approximately 2,600 river and stream forecast locations across the nation. The LRO improved the value of the National Hydrologic Assessment and Spring Flood Outlook by clearly and objectively communicating flood risk at the local level. As a result, the Spring Flood Outlook that we know today was born, which is a high-level summary of national flood potential that is released once a year. Today, local offices and regional and national centers, including the new National Water Center, collaborate in an entirely virtual environment.
Today, the National Hydrologic Assessment offers an analysis of flood risk and water supply for spring based on late summer, fall, and winter precipitation, frost depth, soil saturation levels, snowpack, current streamflow, and projected spring weather. NOAA hydrologists and physical scientists from the National Water Center, NOAA’s newest national operational center, work closely with WFOs, RFCs, and other national centers to assess flood risk. However, the report isn’t just about flooding. In addition to the flood potential, the national likelihood of drought, the spring and summer seasonal weather outlooks, and other information is discussed. The information in the SFO is highly sought-after, as it affects many different groups across the country. Using the report, the National Ocean Service (NOS) can forecast the ecosystem in the Gulf of Mexico in the months to come, and the United States Department of Agriculture (USDA) can get a handle on crop outlooks for the coming season. Thanks to the SFO, countless organizations and agencies nationwide are more informed. NWS expects to see future improvements to the SFO by employing the new National Water Model.
On the most fundamental level, now using the best available technology, local information and data comes together to paint a national picture of what’s to come, protecting lives and property in the process.
Additional Reading
