Here, in his own words, are those of Chris Stachelski, Regional Cooperative Observing and Climate Services Program Manager, NWS Eastern Region, Bohemia, NY.
How An Interest In Weather and A Big Blizzard Triggered A Career Path In Climate and Weather Observations
Most meteorologists got their interest in weather at a very young age, likely from one big storm or a number of storms or by watching cloud formations. Mine was a gradual interest from a series of weather events in the 1980s when I grew up in New Jersey. The oldest memorable one was being getting chased off the boardwalk in Seaside Heights (in the pre-MTV and Jersey Shore days) in July 1983 by a severe thunderstorm that literally sent crowds running – including my family – and getting drenched by the rain. Within a few days I would learn that not far from where my relatives and I were staying a supermarket had lost its roof from the storm because of a tornado, a rare event in New Jersey, especially one rated a F3. The following year my preschool came within feet of being inundated by a major river flood. The next year was Hurricane Gloria. And in the following years came numerous snowstorms that crescendoed in the winter of 1995-1996 with record seasonal snowfall in metropolitan New York City featuring the legendary Blizzard of ’96.
Growing up in the hill country of northwestern New Jersey, the closest National Weather Service office until 1996 was roughly 25 miles away at Newark International Airport. Besides the distance, Newark Airport was nearly 500 feet lower in elevation and far more urbanized and often got much less snow or no snow at all compared to where I lived in many winter storms. Even though this was the closest primary climate site to my house the climate was different enough that my dad used to like to take snow measurements after a decent snowstorm to keep his own records. He started around the Blizzard of ’78 and would write them on a calendar in our garage. When my own interest in weather kept escalating, I also started talking snow measurements and would compare them with my dad. Sometimes we had significantly different amounts. He used a spot that was fairly consistent and far away from most obstructions and about as level as we had on our property for years. Considering he was never a spotter or trained by a meteorologist he actually did pretty good, looking back at it.
I then started to wonder more how snow was measured in the figures shown on the television news at Central Park or the ones in the newspaper from Newark Airport. There was no internet over 25 years ago and learning about weather was confined to books, magazines, newspapers and some television including The Weather Channel. Finally, in the winter of 1994 during a snowstorm, WCBS in New York sent their weatherman Storm Field to Central Park to do a live broadcast of the National Weather Service measuring the official snow. I watched a meteorologist walk out into the grass and take several readings with a measuring stick and come up with an average. That was the official reading. I was thrilled to finally see how ‘it’ was actually done by a professional.
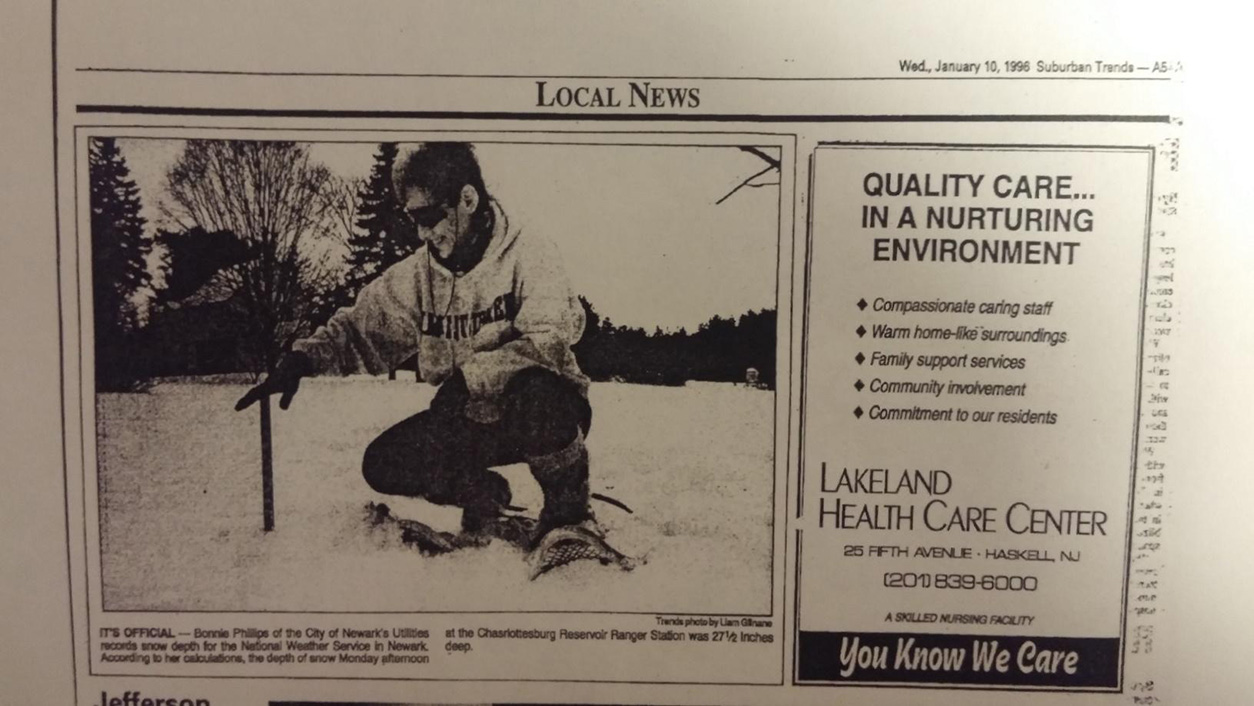
Two years later the Blizzard of ’96 hit. It remains the single largest snowstorm I ever personally witnessed. I measured 29.9 inches of powdery, wind-driven snow after taking 10 readings in different spots. I felt confident in my reading but I watched the news to see of any nearby towns had reports in of how much snow fell. There was no such luck. A few days later my dad obtained the Star-Ledger newspaper in hard copy from a co-worker from the two days after the storm. Newspaper deliveries were cancelled in most areas from the blizzard so obtaining a print copy from that time frame was not easy as most were not delivered. In it was a map with different towns that had measurements obtained by the National Weather Service. One report about 12 miles west from my house said “Charlotteburg, 27 inches.” That area was similar in terrain and I felt even better about my reading as amounts trended up going east in northern New Jersey due to the storm track. The following day a weekly local newspaper was delivered to our house and I looked through that. In the corner was a small photograph that caught my interest. It was a lady measuring snow – at Charlotteburg – and said she took the readings to send into the National Weather Service. I had no idea the National Weather Service had any sort of connection that close to my house to record weather as I assumed their only reports in my area of New Jersey were at Newark and the airports at Morristown and Teterboro. My interest grew further in what this was about.
Finally, the internet and college came along and I was told about the cooperative weather program by a professor. This was what I had seen in the newspaper after the Blizzard of ’96. I was fascinated further. I looked this up online and there were stations all over that had readings close to where I lived that would give me a better idea of how my past snow measurements compared to what was official. I could even look up totals from storms when I was even younger but did not measure how much snow fell. It was a treasure trove of information.
My interest in climate continued through college. My first visit to a National Weather Service office was in 2000 when I visited the Tallahassee, Florida office to work on a project in college for an internship I had. I was tasked to visit there and obtain copies of their local daily and monthly records. In those days records were still kept in a physical ‘record book’ written by typewriter or in WordPerfect and crossed out with a pen when broken at most offices. I took the records for my project and entered them in an electronic file that could be easily updated when they were tied or broken. Later while wandering at the library I found a section that housed government records and came across dozens of books with old weather data in them called “Climatological Data” that went back to 1914. They were for each state or a group of states. I used these for another research project for my synoptic meteorology class. Climatological Data is a publication still produced today that lists the daily and monthly values collected by cooperative observers across the country.
Eventually after graduating college and working in the private sector, I started with the National Weather Service in January 2007. I’ve been involved directly with the climate and cooperative weather programs each day since. My first job was a Meteorologist Intern at the Hanford, California Weather Forecast Office. I would call observers and collect and quality control their data. The Meteorologist-In-Charge along with the forecasters in the office recognized my interest in these programs was well above average and eventually asked me to assist these programs as an assistant focal point. In March 2008 I was promoted to the Las Vegas, Nevada Weather Forecast Office as a forecaster. I eventually became the Climate Focal Point and when our longtime Observing Program Leader retired took over the cooperative weather program for a year and a half due to ongoing vacancies. This is one of the largest geographic areas covered nationally by the program as it covers parts of four states.
In February 2016 I started my current position at Eastern Region Headquarters on Long Island, New York as the program manager for observations and climate services. This position oversees the nearly 1,400 cooperative weather stations in the region including site visits, equipment, awards and other paperwork in addition to data collection and quality control. As part of this position, I oversee the snow measurements in our region at all climate sites. After having graduated from college in Florida in meteorology I will say this is the most unusual thing I could have ended up doing as part of a job. But in a way much of my interest in my younger days now serves me well and guides me in this area. As part of this job I finally had the chance in 2016 to visit Central Park and Newark Airport and see in person how they measure snow and reflect back on my early interest in weather reports from both stations.
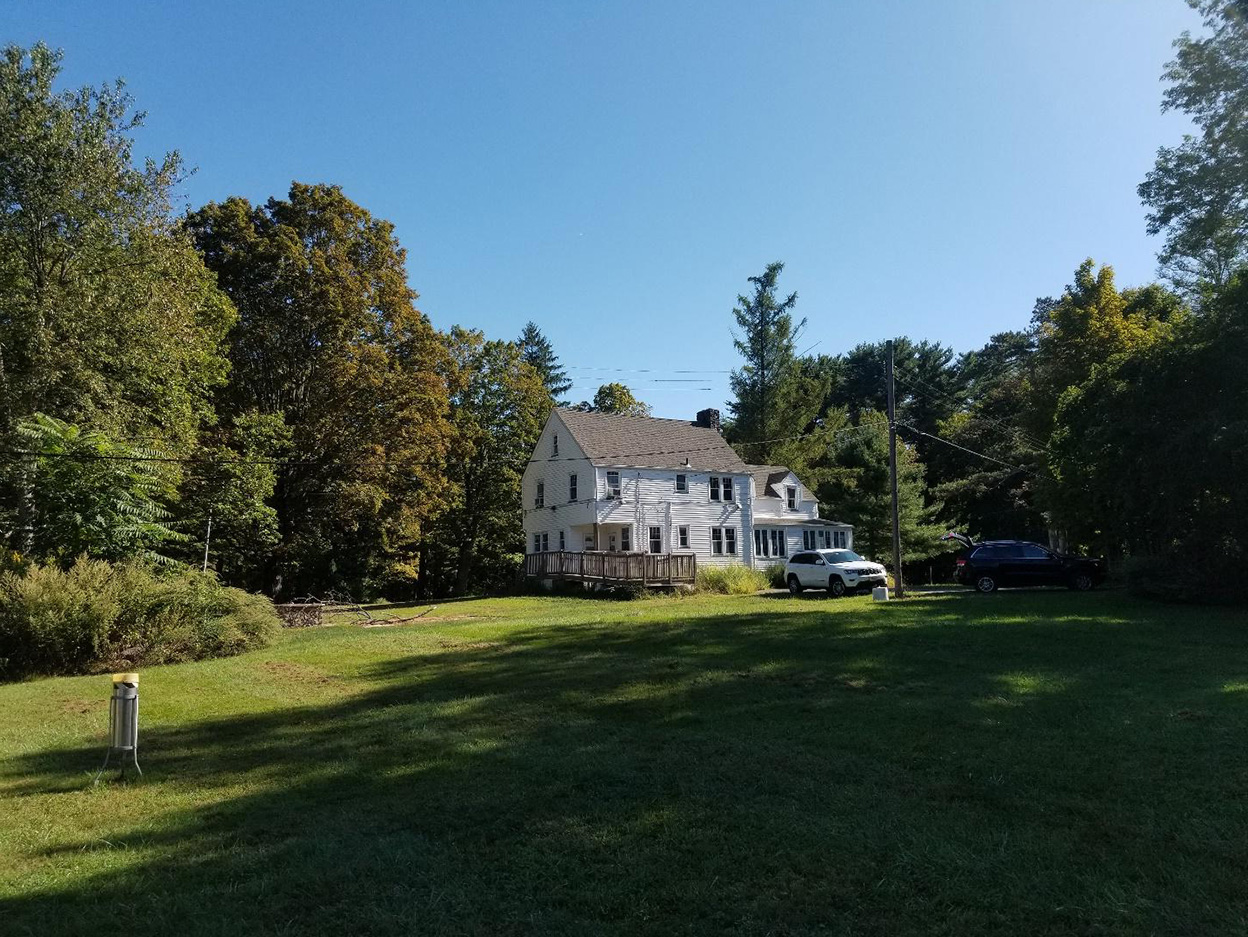
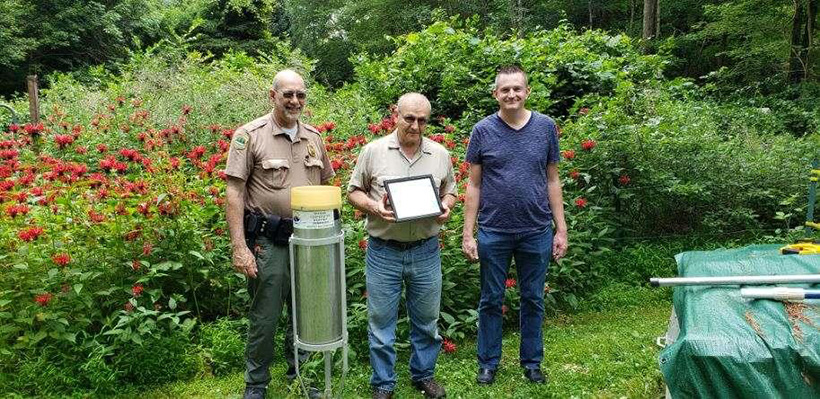
I also get the opportunity to visit some of our sites to present awards to observers. I’ve been privileged and honored to present awards to two cooperative observer sites who played a role in my early interest in weather. One of those was to the retired meteorologist from the National Weather Service who surveyed the tornado that spiked my interest in weather back in 1983 who serves as a cooperative observer at his house in South Jersey. The second was to the observers at the Newark Water District who operate three stations for the National Weather Service in North Jersey including Charlotteburg. It was a surreal experience for me to visit the site that first sparked my interest in the cooperative observing program over two decades earlier. Not all meteorologists get the chance to visit the people and places that inspired them early on in their interest in weather. I feel lucky I’ve had this chance and the opportunity to personally thank these observers for their data and services. I likely wouldn’t be writing this article if it wasn’t for them.