Product Descriptions - NASA SPoRT
Level/Layer Products
| Sample Image | Parameter | Pressure Levels (mb) | Pressure Layers (mb) |
|
|
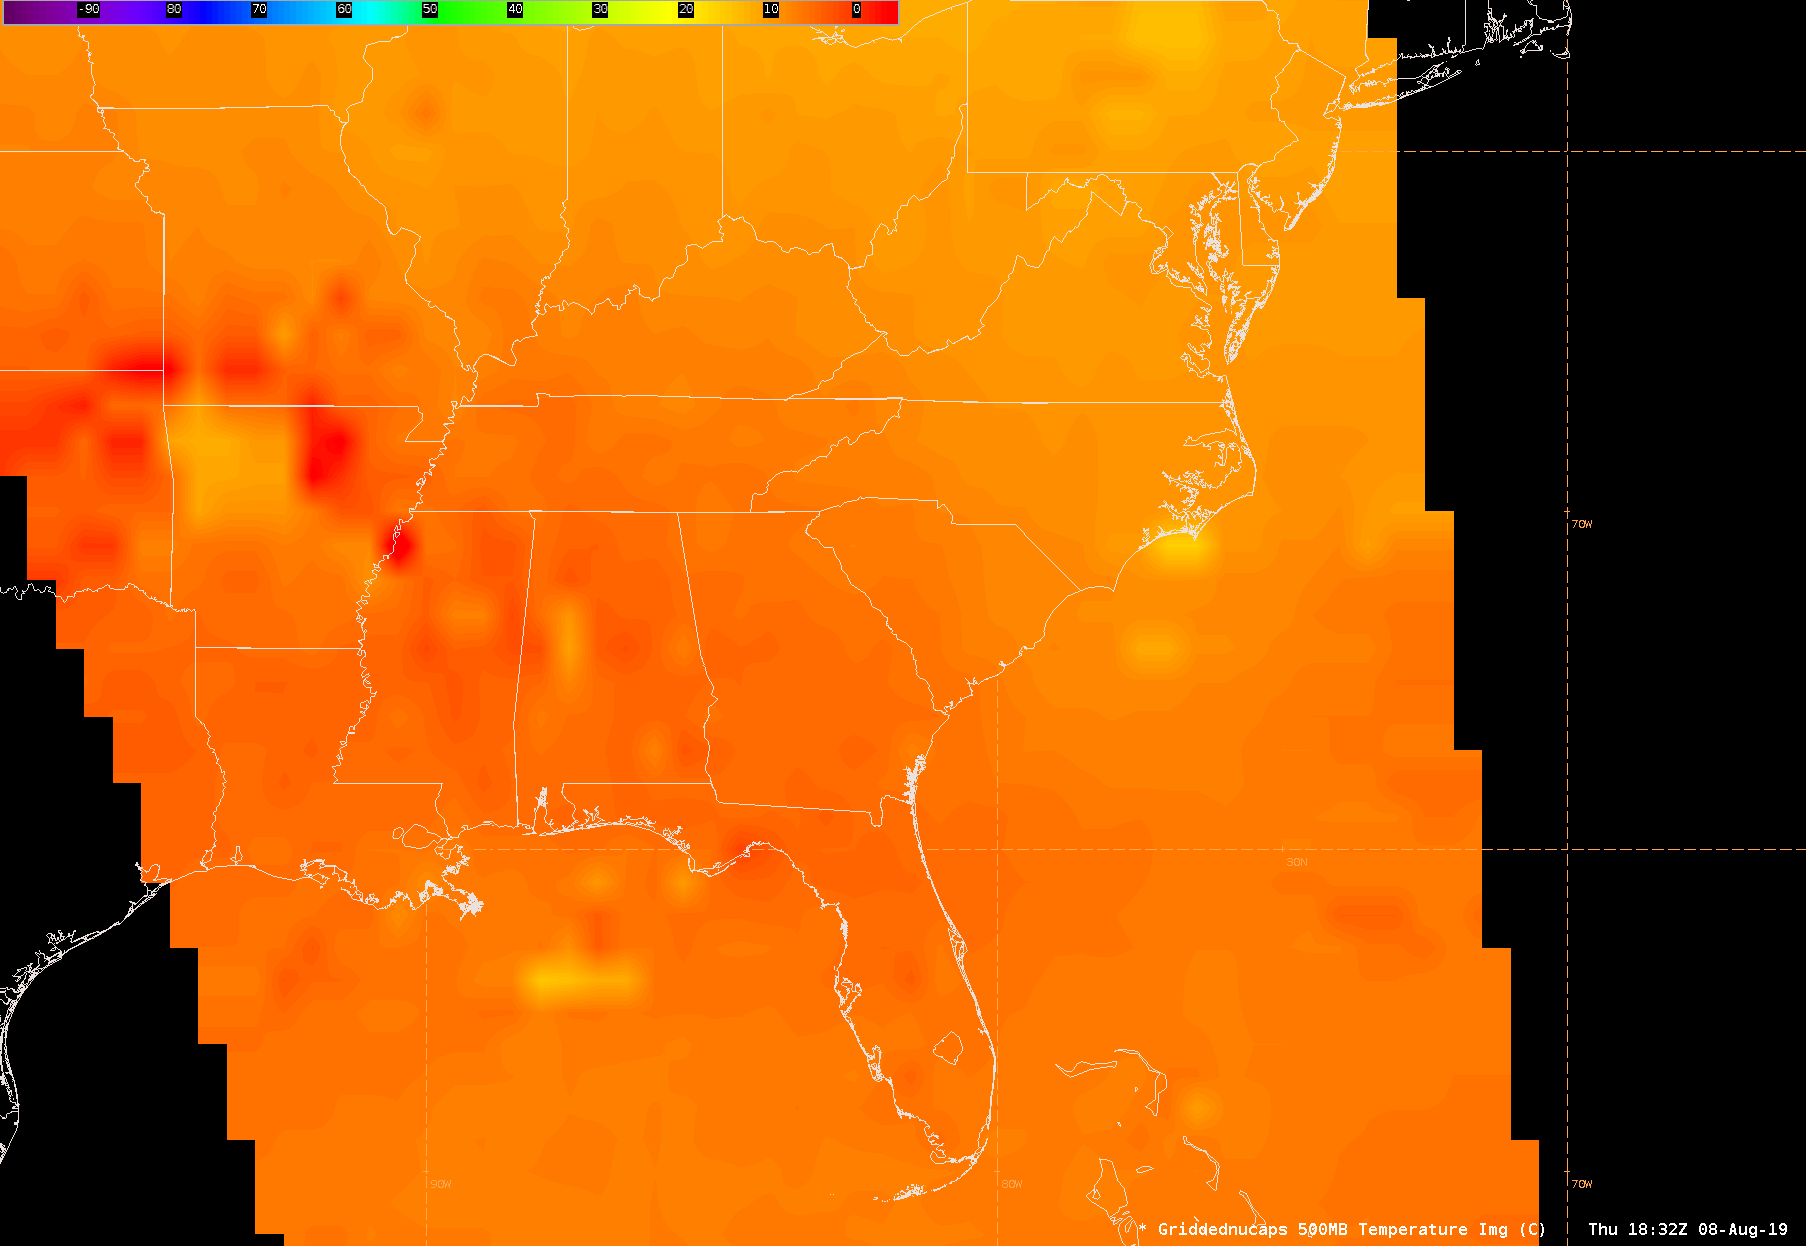
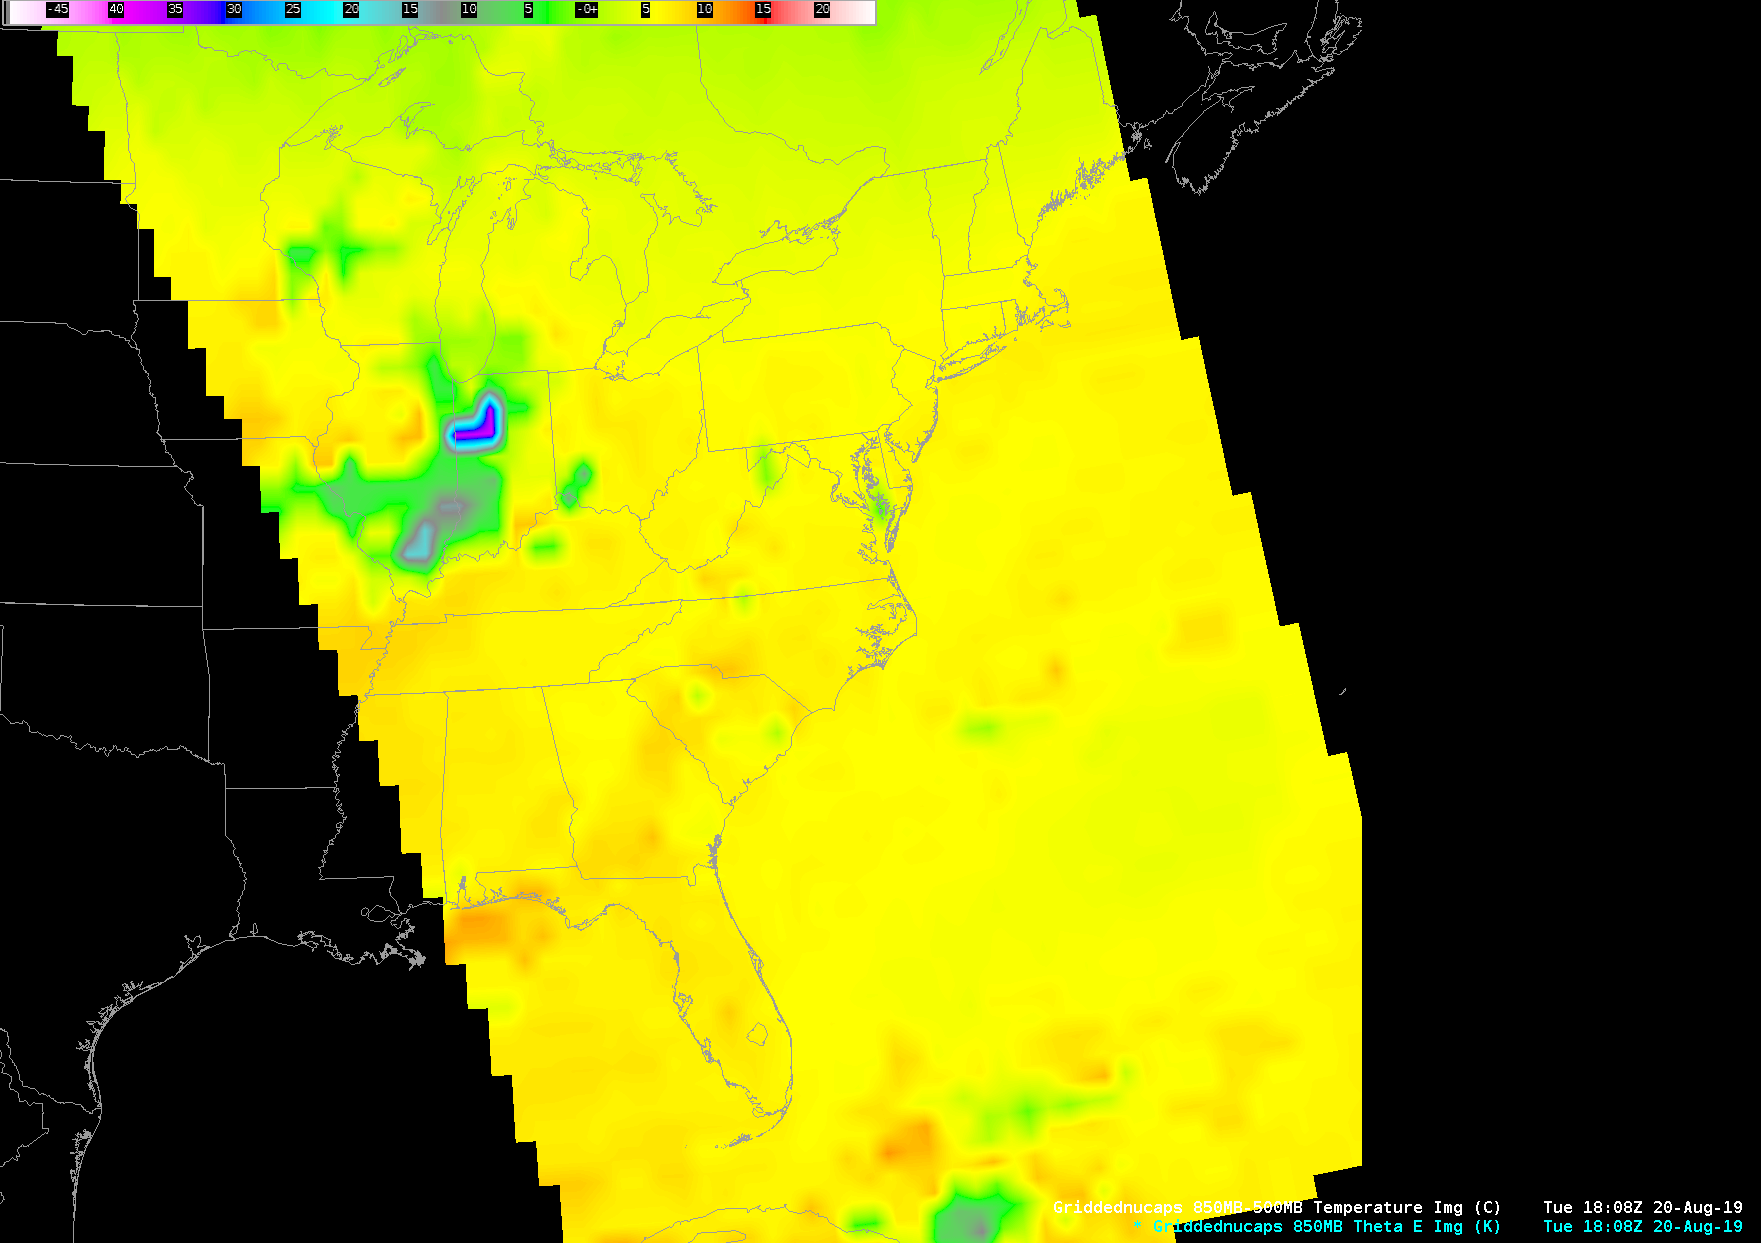
Temperature |
1000, 925, 850, 700, 500, 300, 250, 200, 100 | 850-500, 850-300, 700-500, 400-200 |
|
|
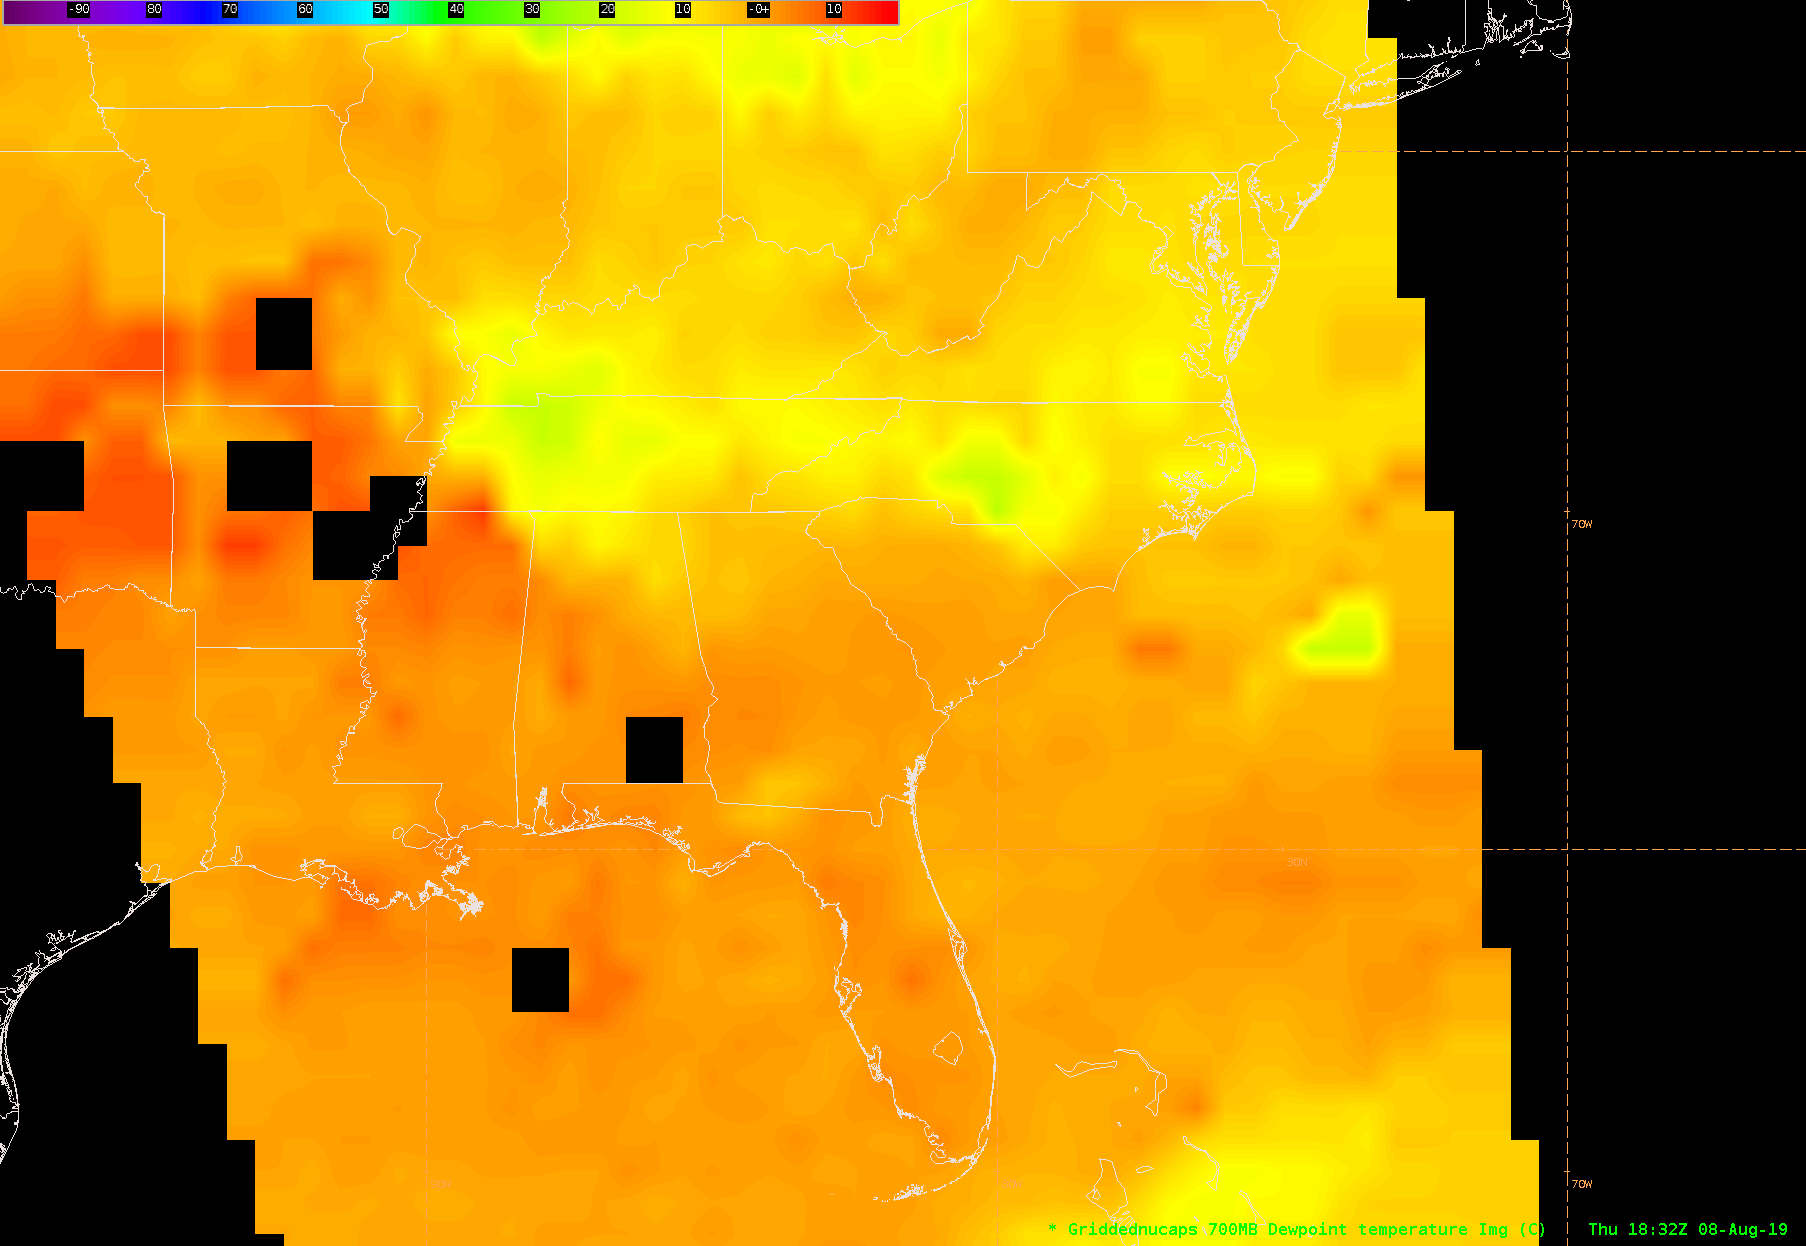
Dewpoint Temperature | 1000, 925, 850, 700, 500, 300, 250, 200, 100 | 850-500, 850-300, 700-500, 400-200 |
|
|
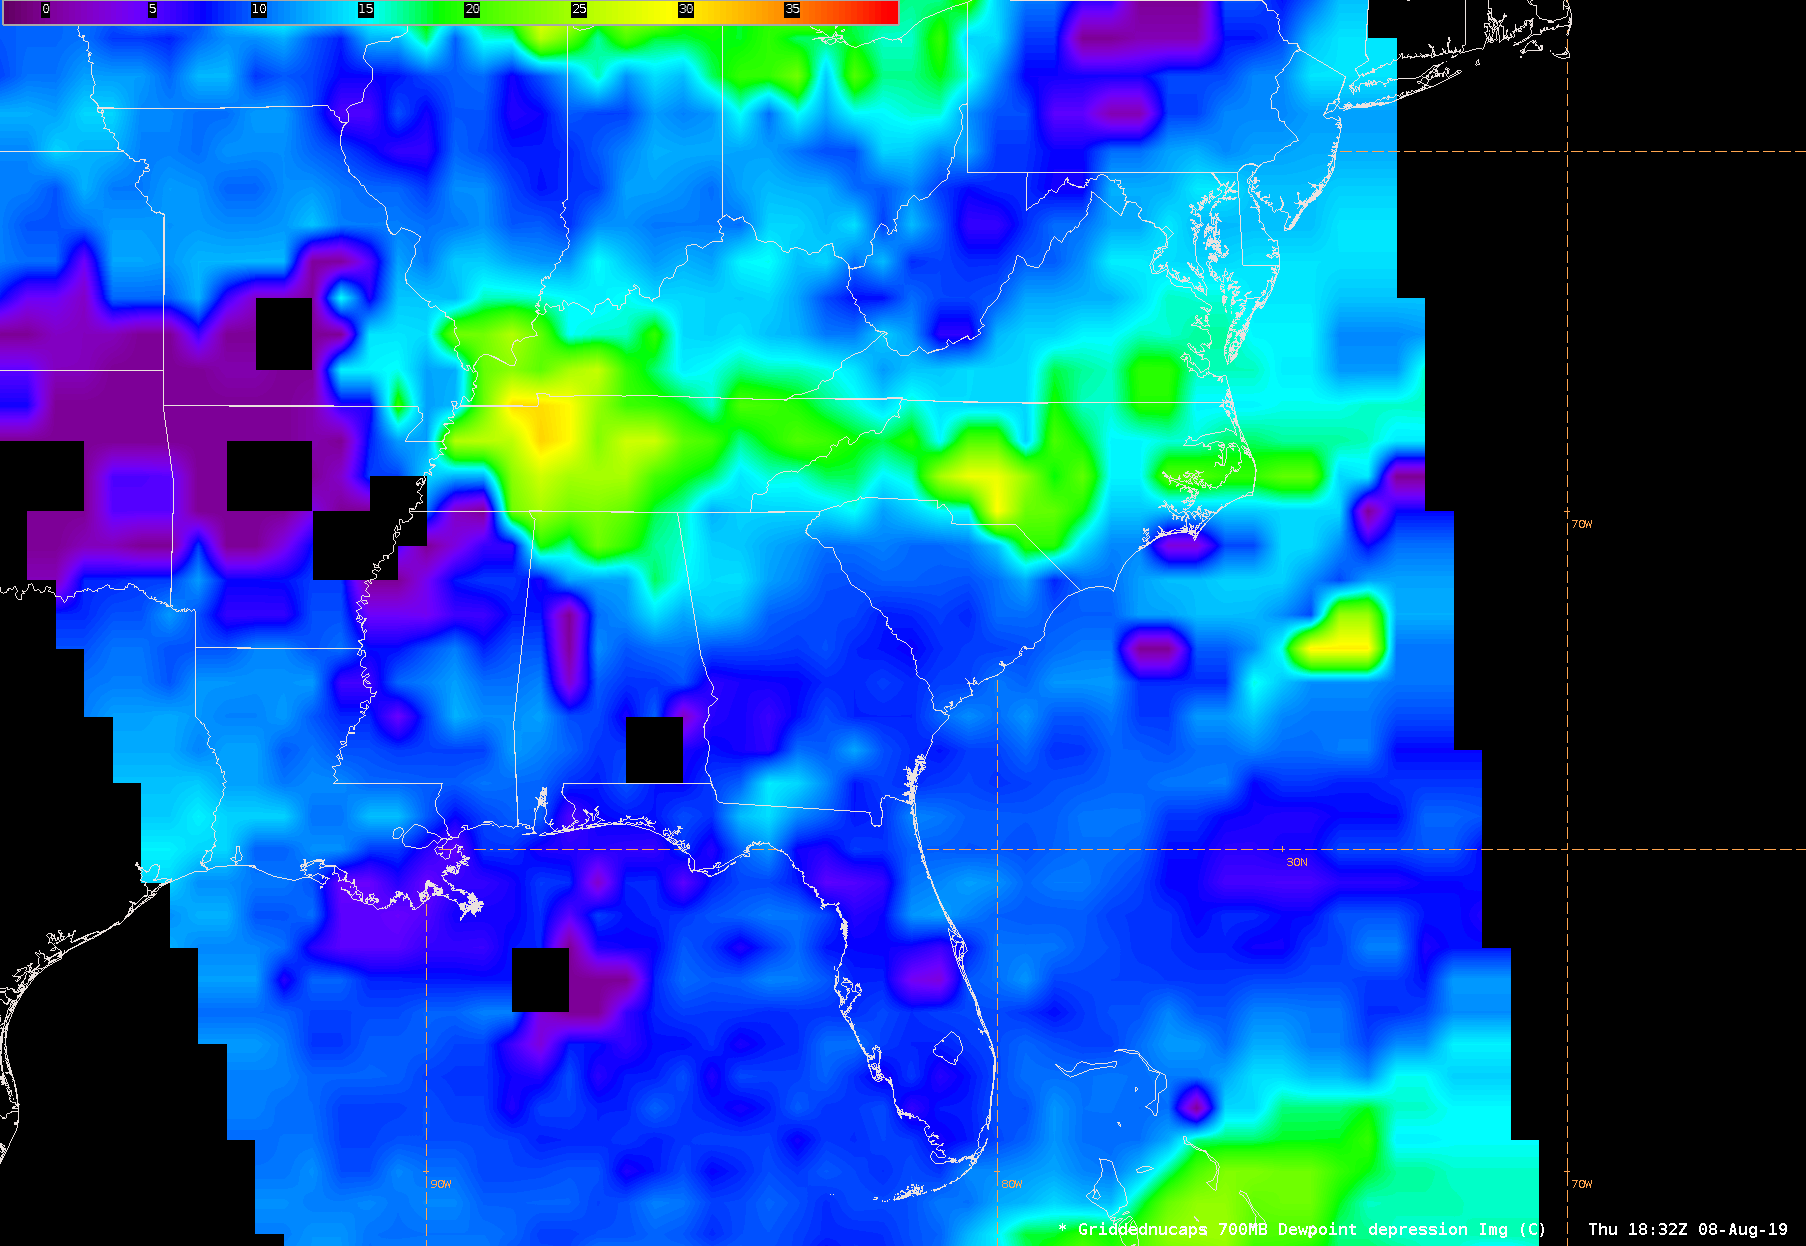
Dewpoint Depression | 1000, 925, 850, 700, 500, 300, 250, 200, 100 | 850-500, 850-300, 700-500, 400-200 |
|
|
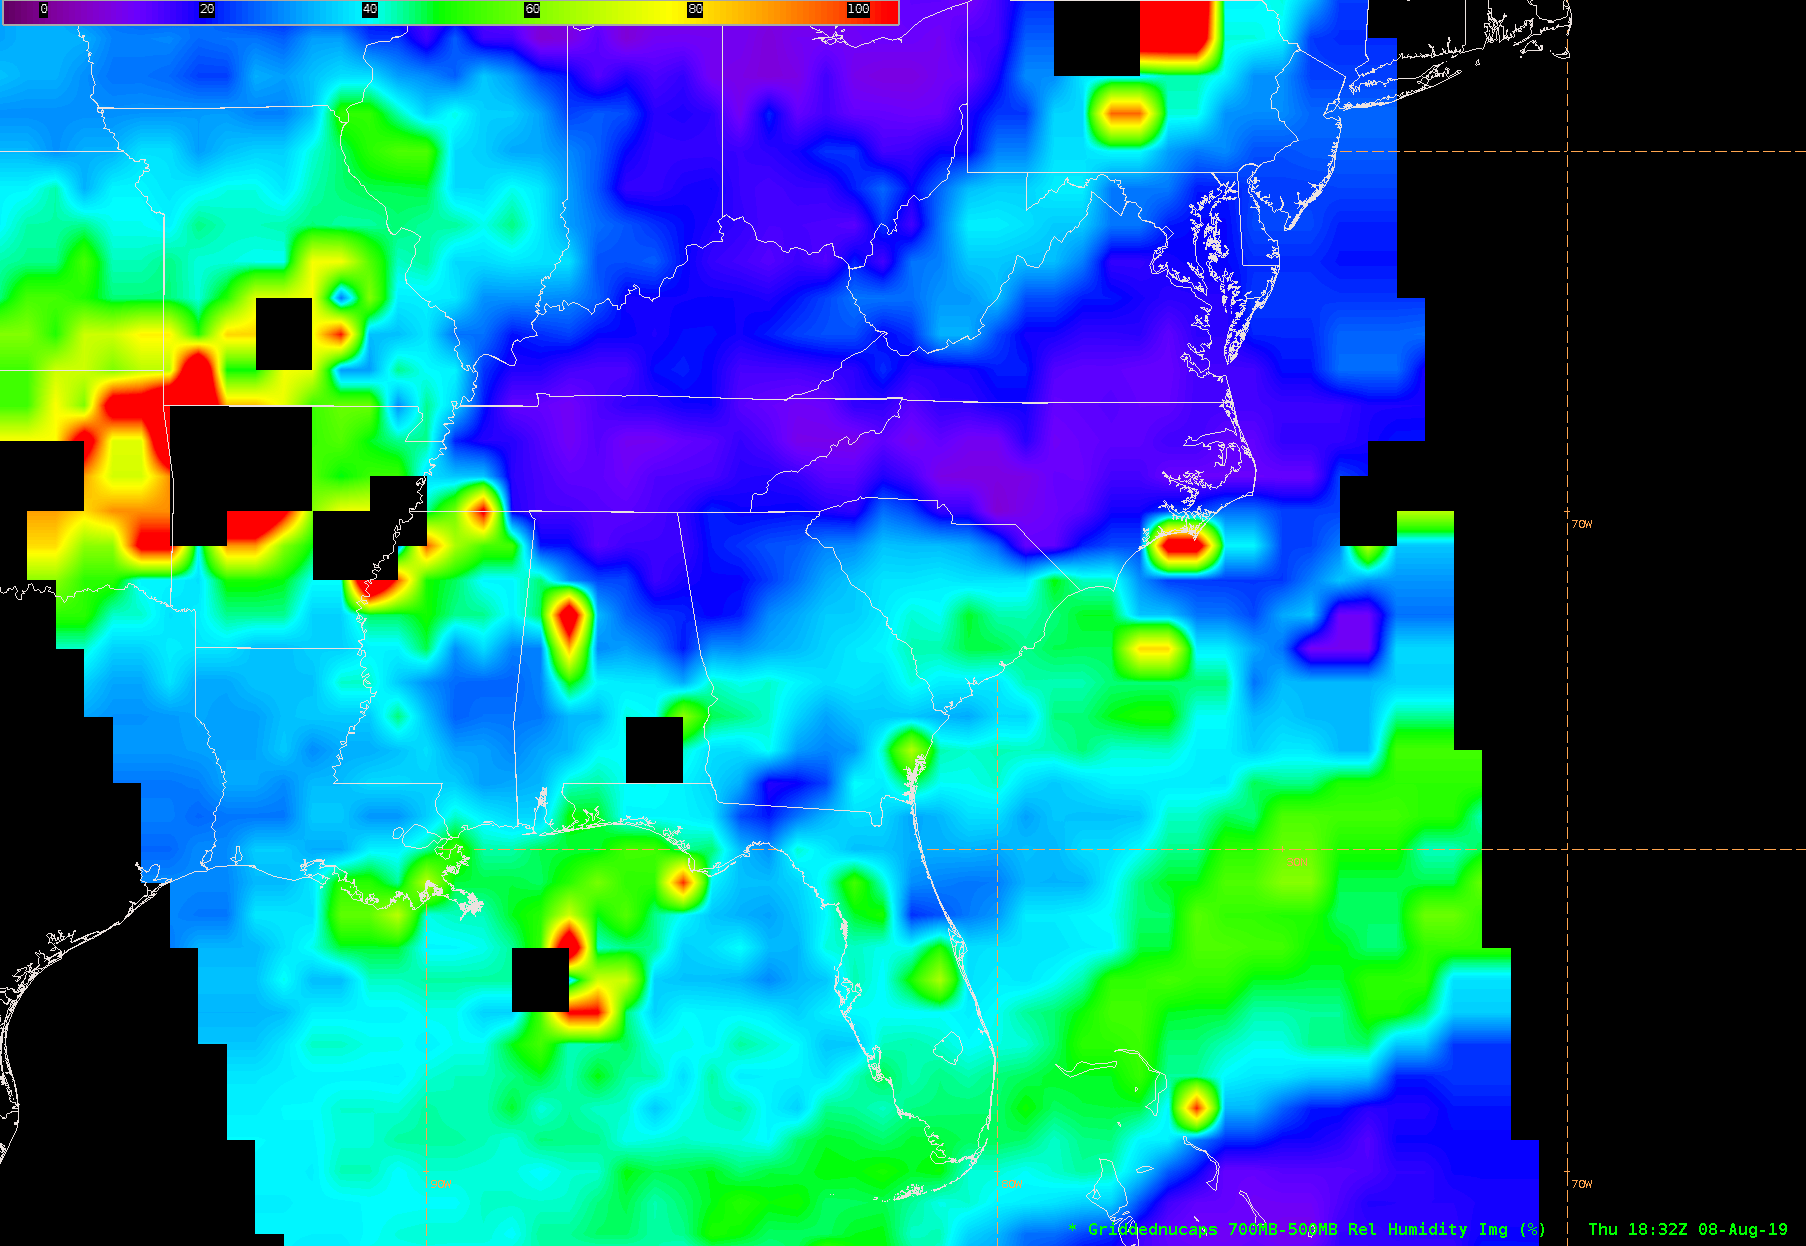
Relative Humidity | 1000, 925, 850, 700, 500, 300, 250, 200, 100 | 850-500, 850-300, 700-500, 400-200 |
|
|
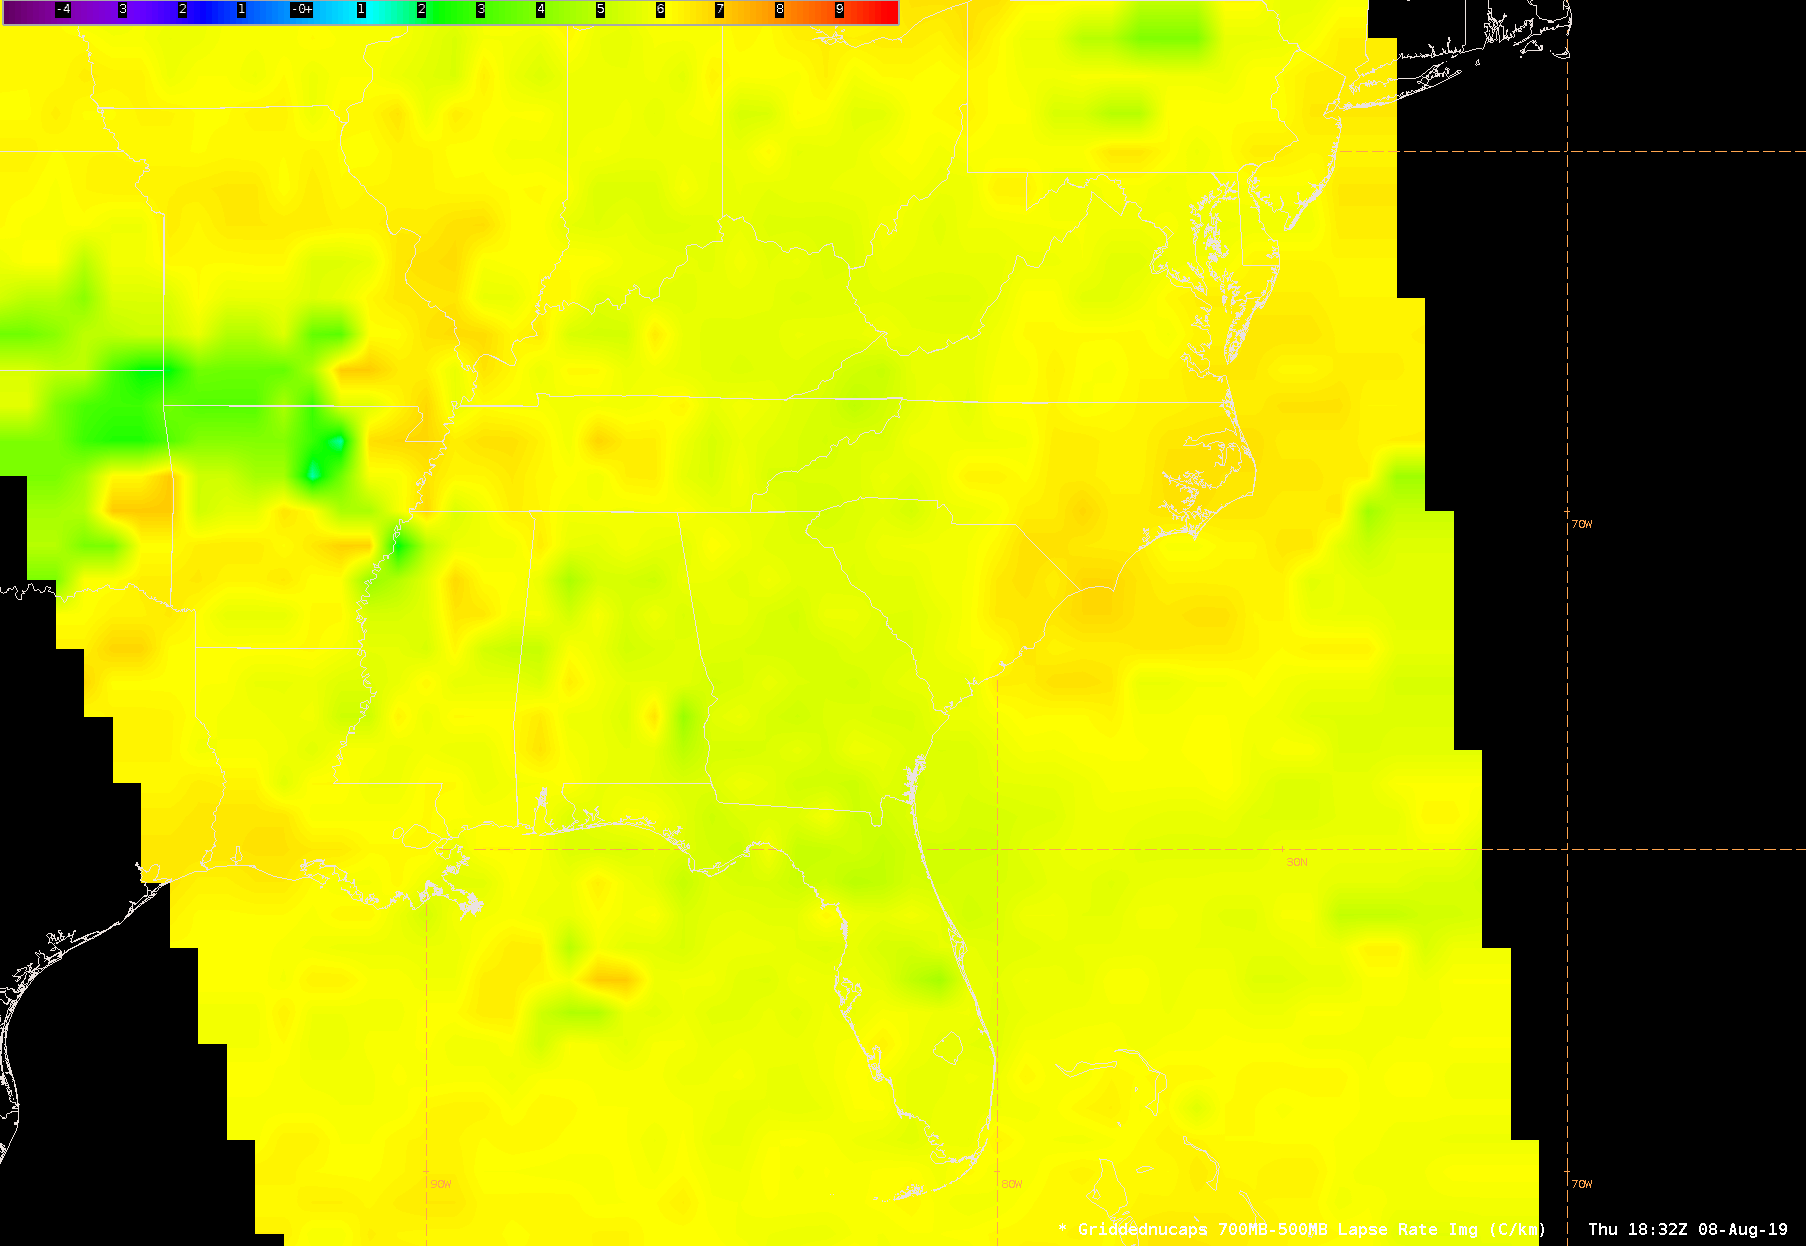
Lapse Rate | 850-500, 850-300, 700-500, 400-200 | |
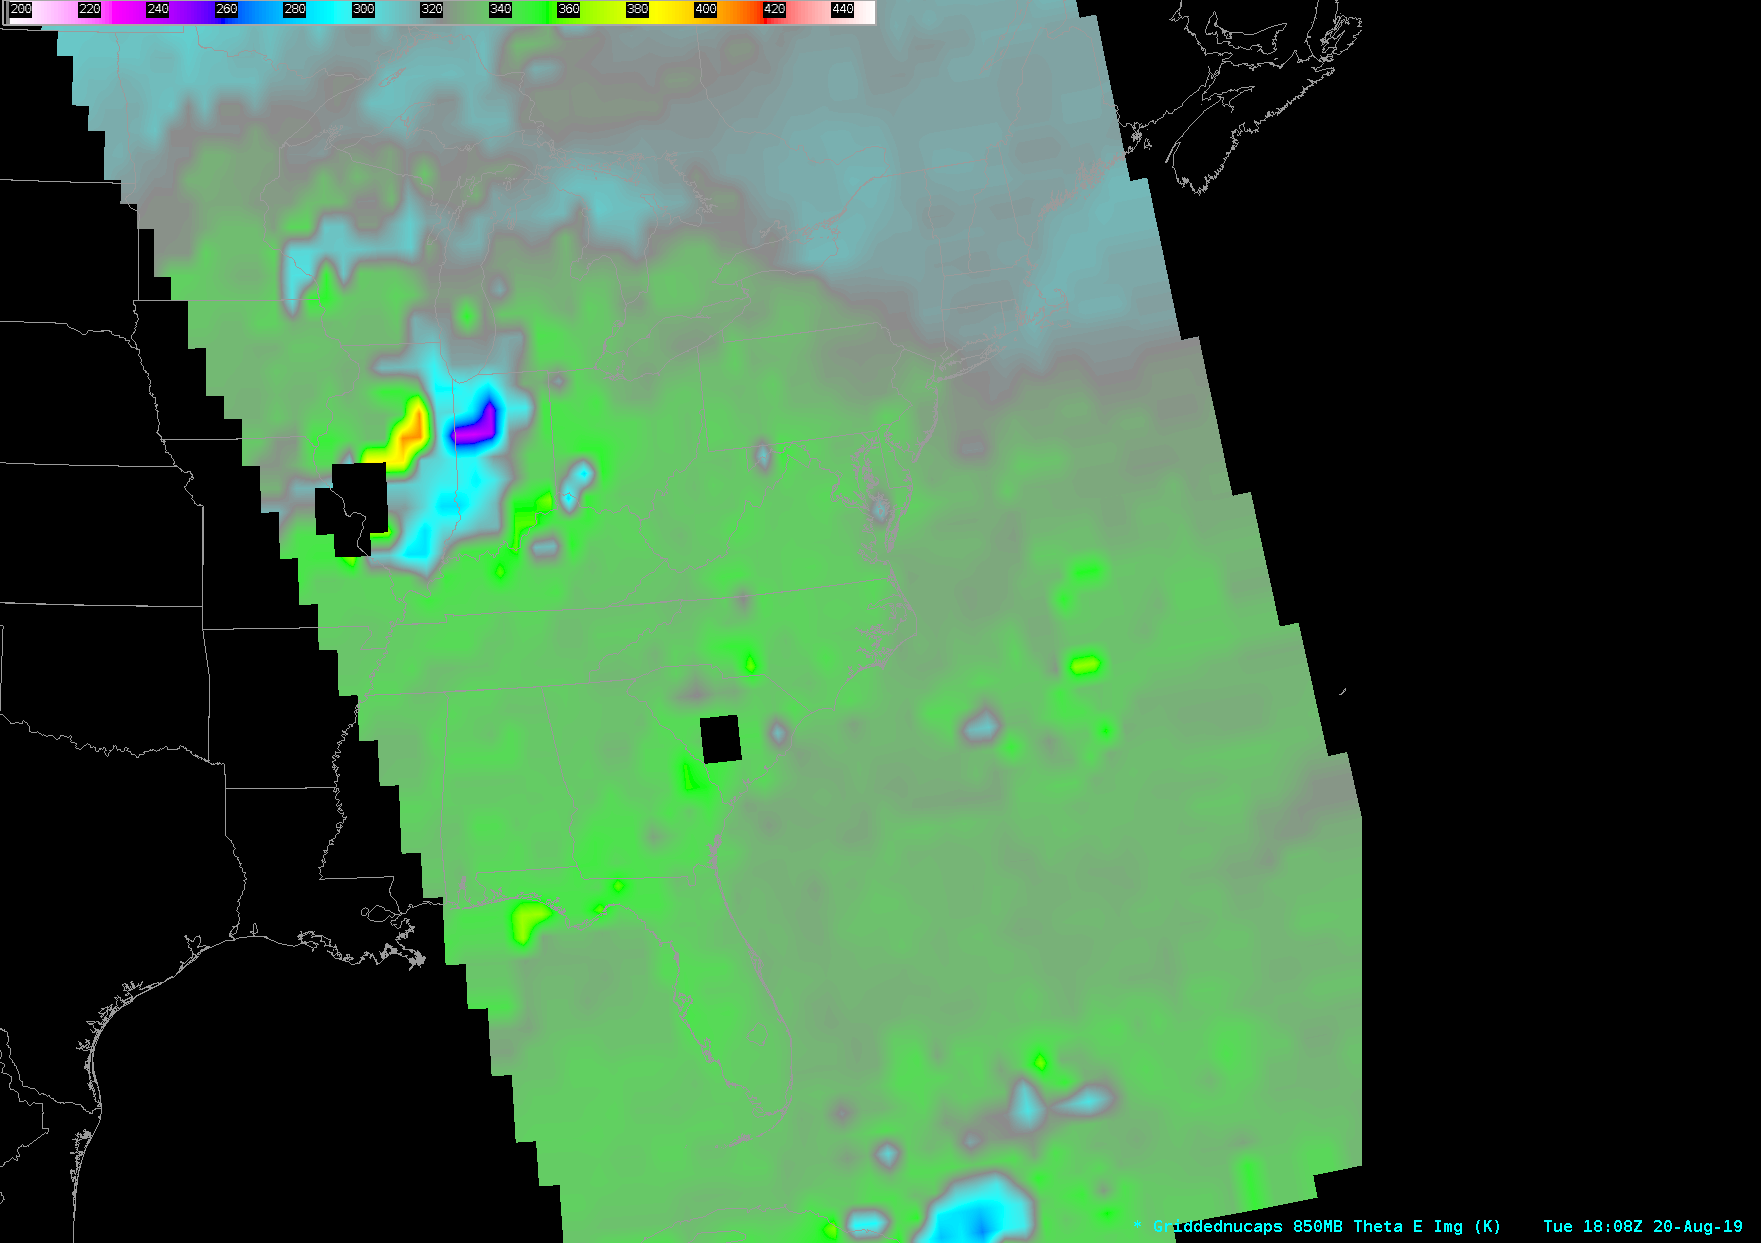 |
Theta-E | 1000, 925, 850, 700, 500, 300, 250, 200, 100 | 850-500, 850-300, 700-500, 400-200 |
|
|
Theta-E Lapse Rate | 850-500, 850-300, 700-500, 400-200 | |
|
|
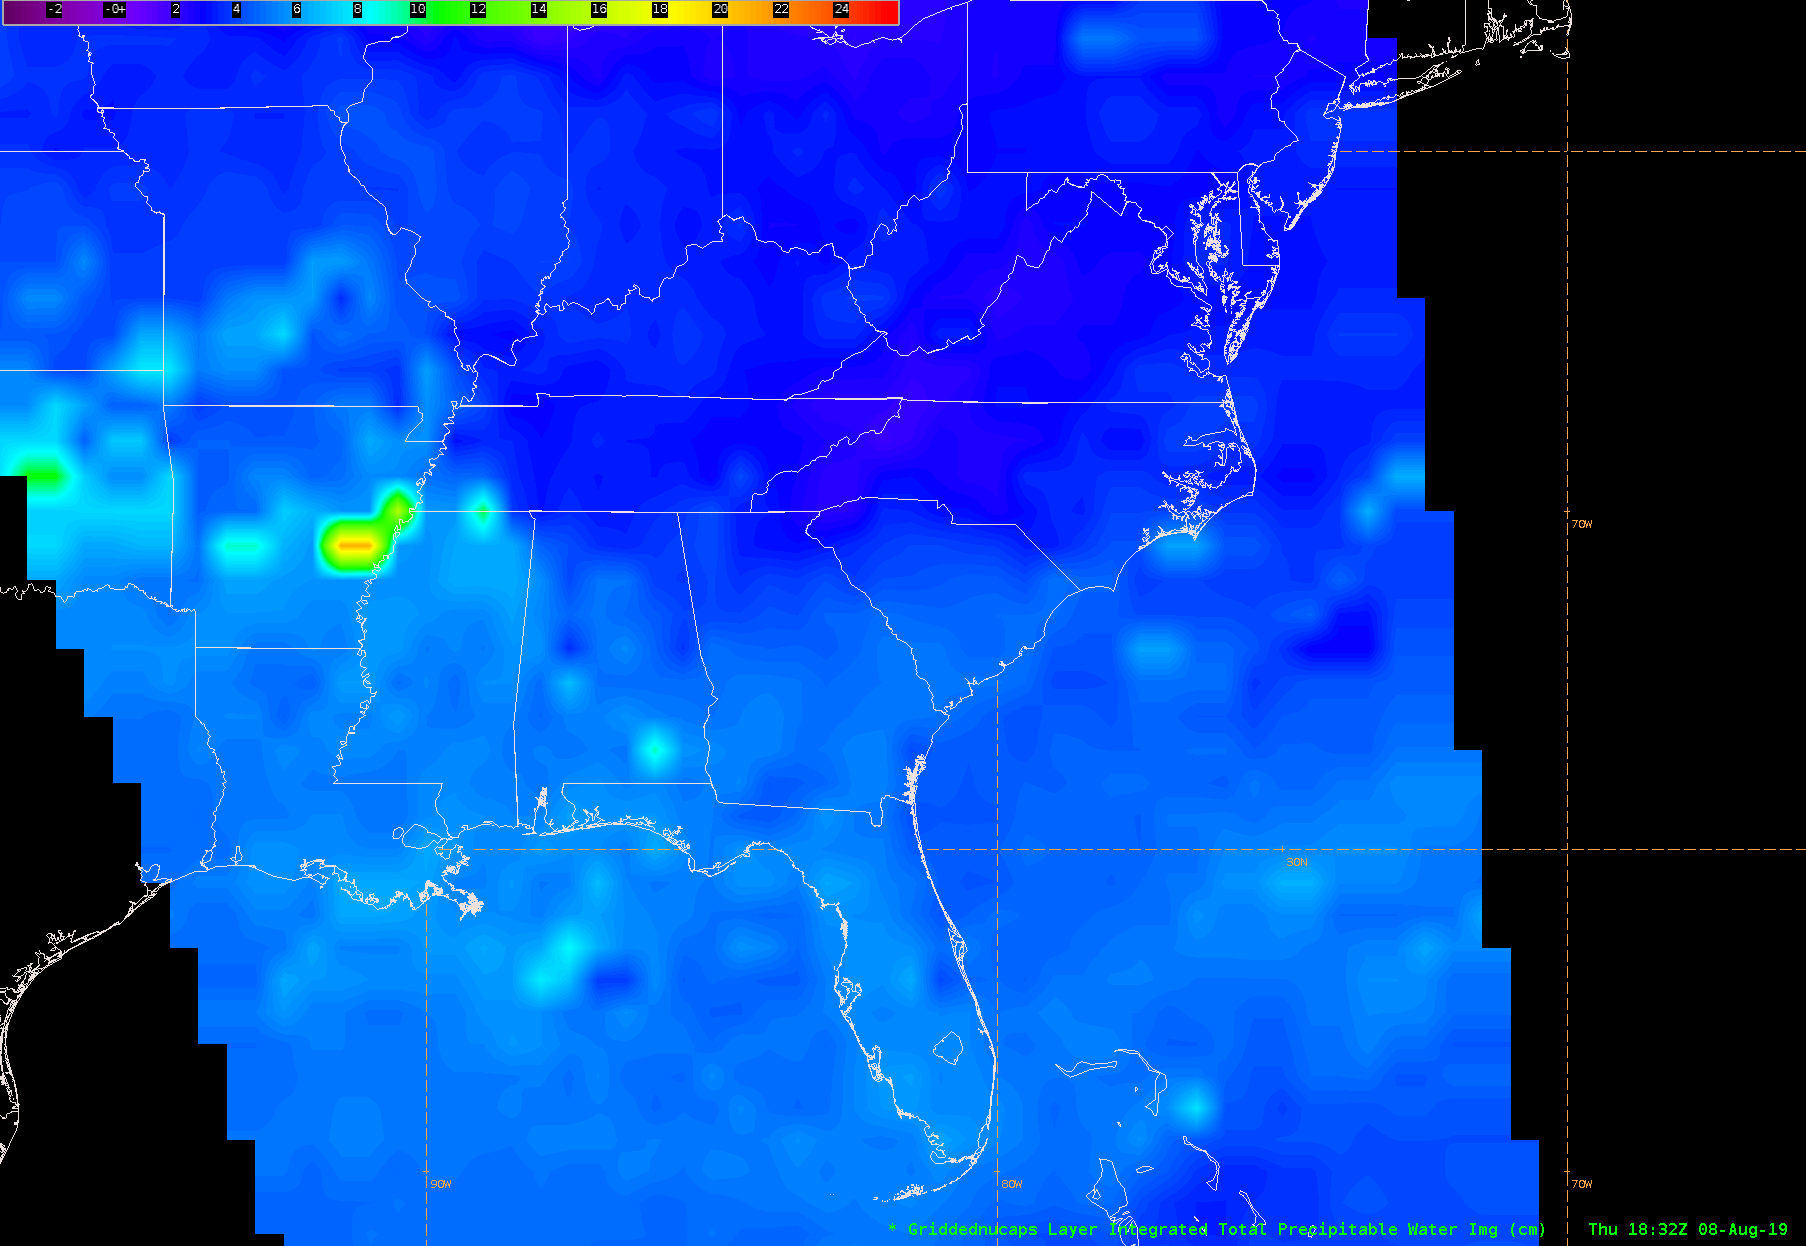
Precipitable Water |
Total Atmosphere, sfc-800, sfc-500, sfc-300 (note: these levels are incorrect in AWIPS. See section on previous page about troubleshooting and ingest) |
Single Level Products
| Sample Image | Parameter | Description | Level |
|
|
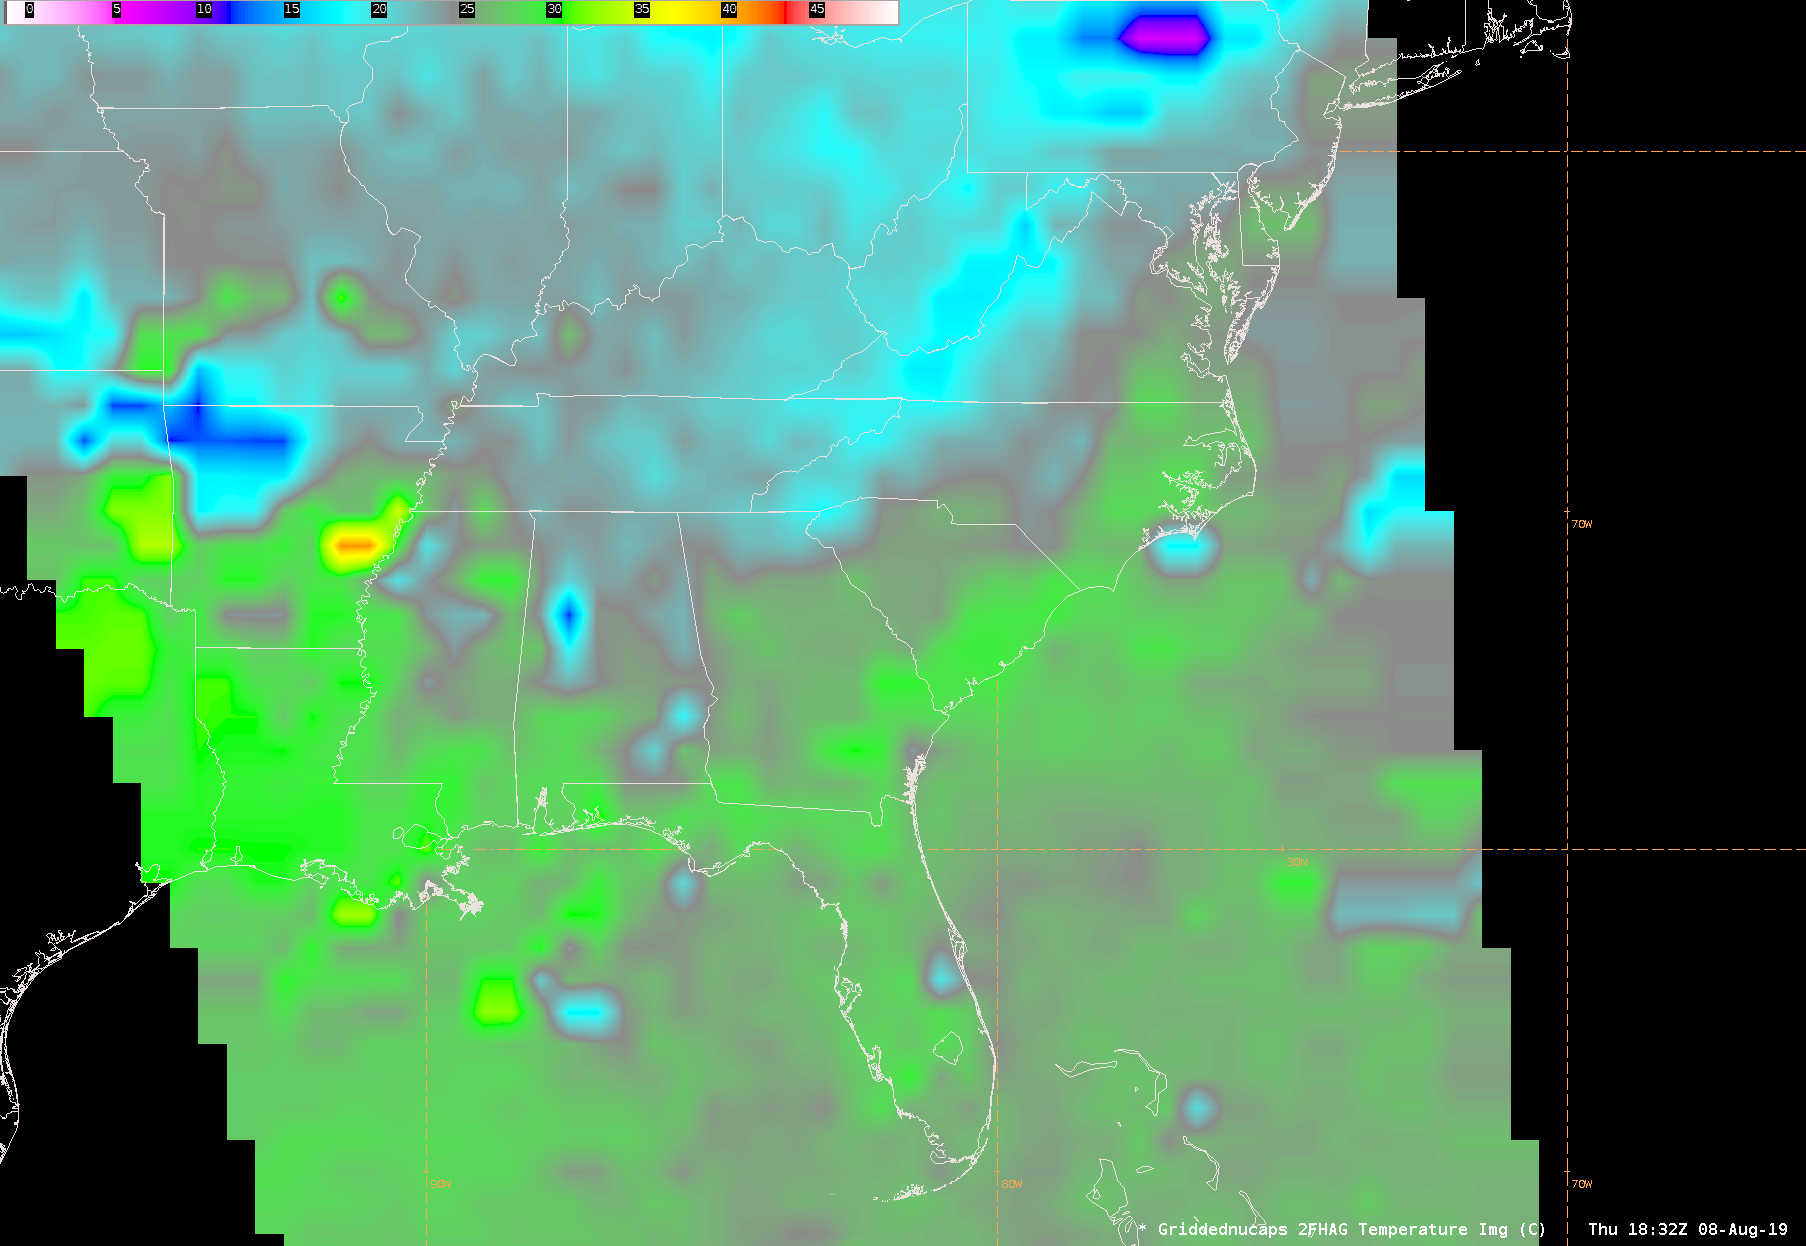
Temperature | Temperature at 2 meters above ground | 2 meter |
|
|
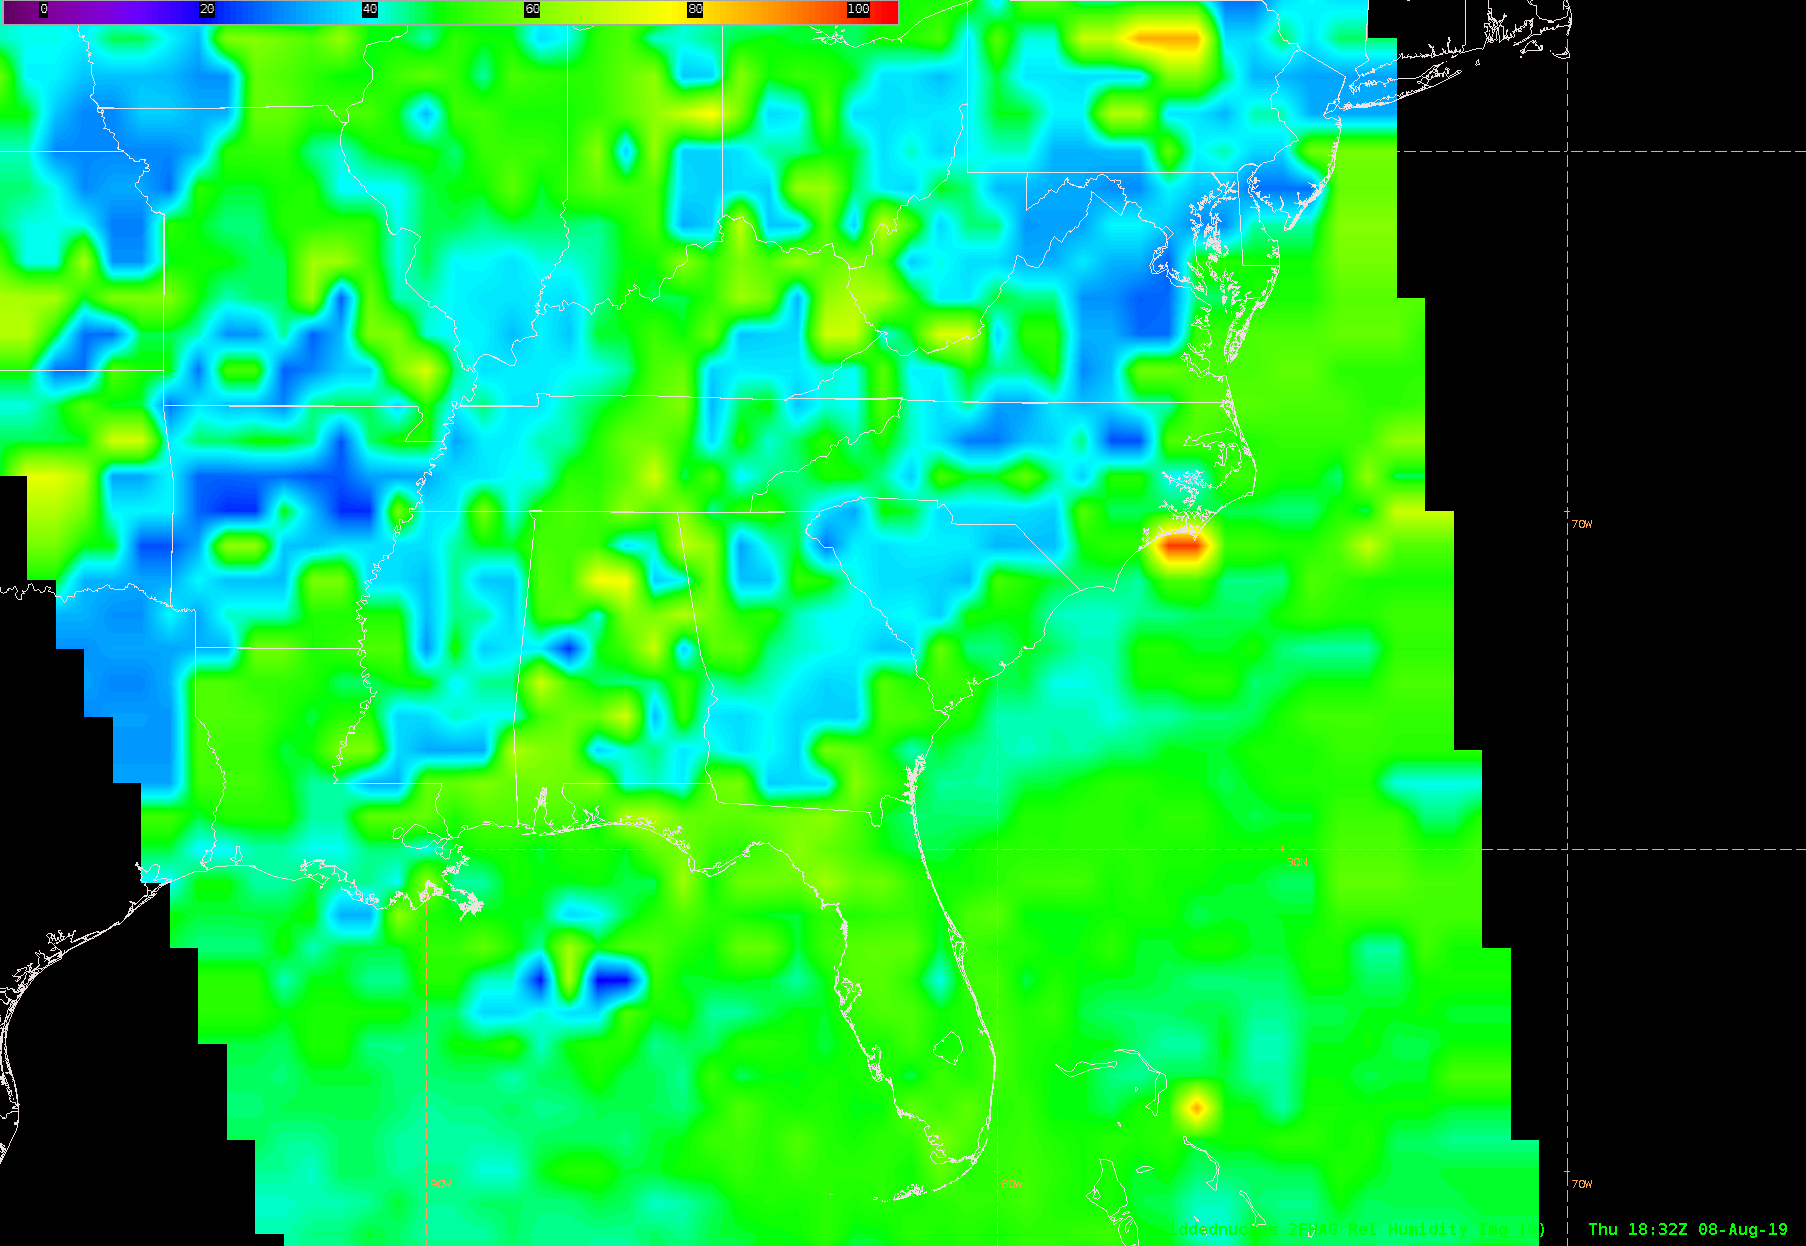
Relative Humidity | RH at 2 meters above ground | 2 meter |
|
|
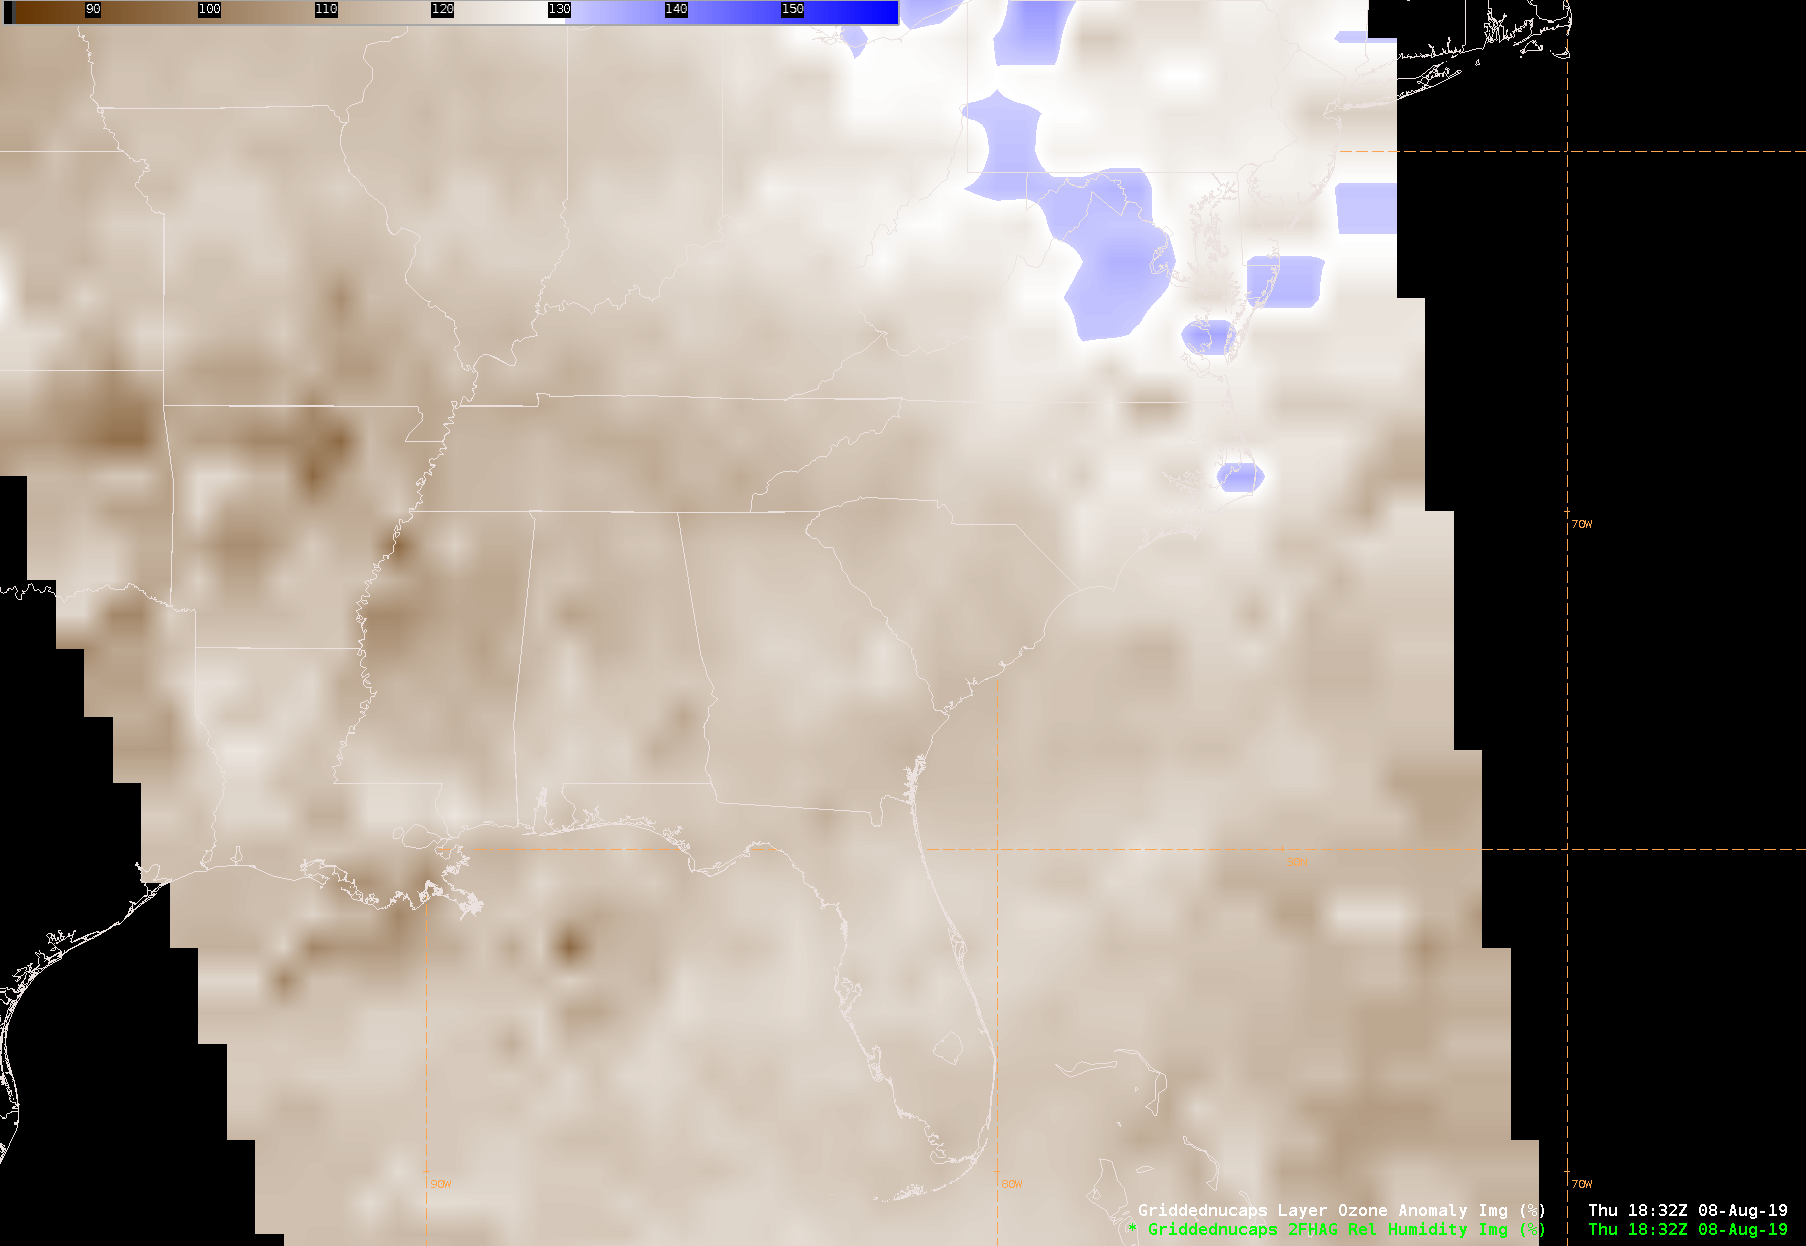
Ozone Anomaly |
A more accurate identifier of stratospheric air compared to total column ozone. This SPoRT developed product is displayed in percent of normal from 0-200%. Shades of blue or values >125% indicate stratospheric air and the ozone values are anomalous for the month and latitude [click to download -> recommended color table] |
|
|
|
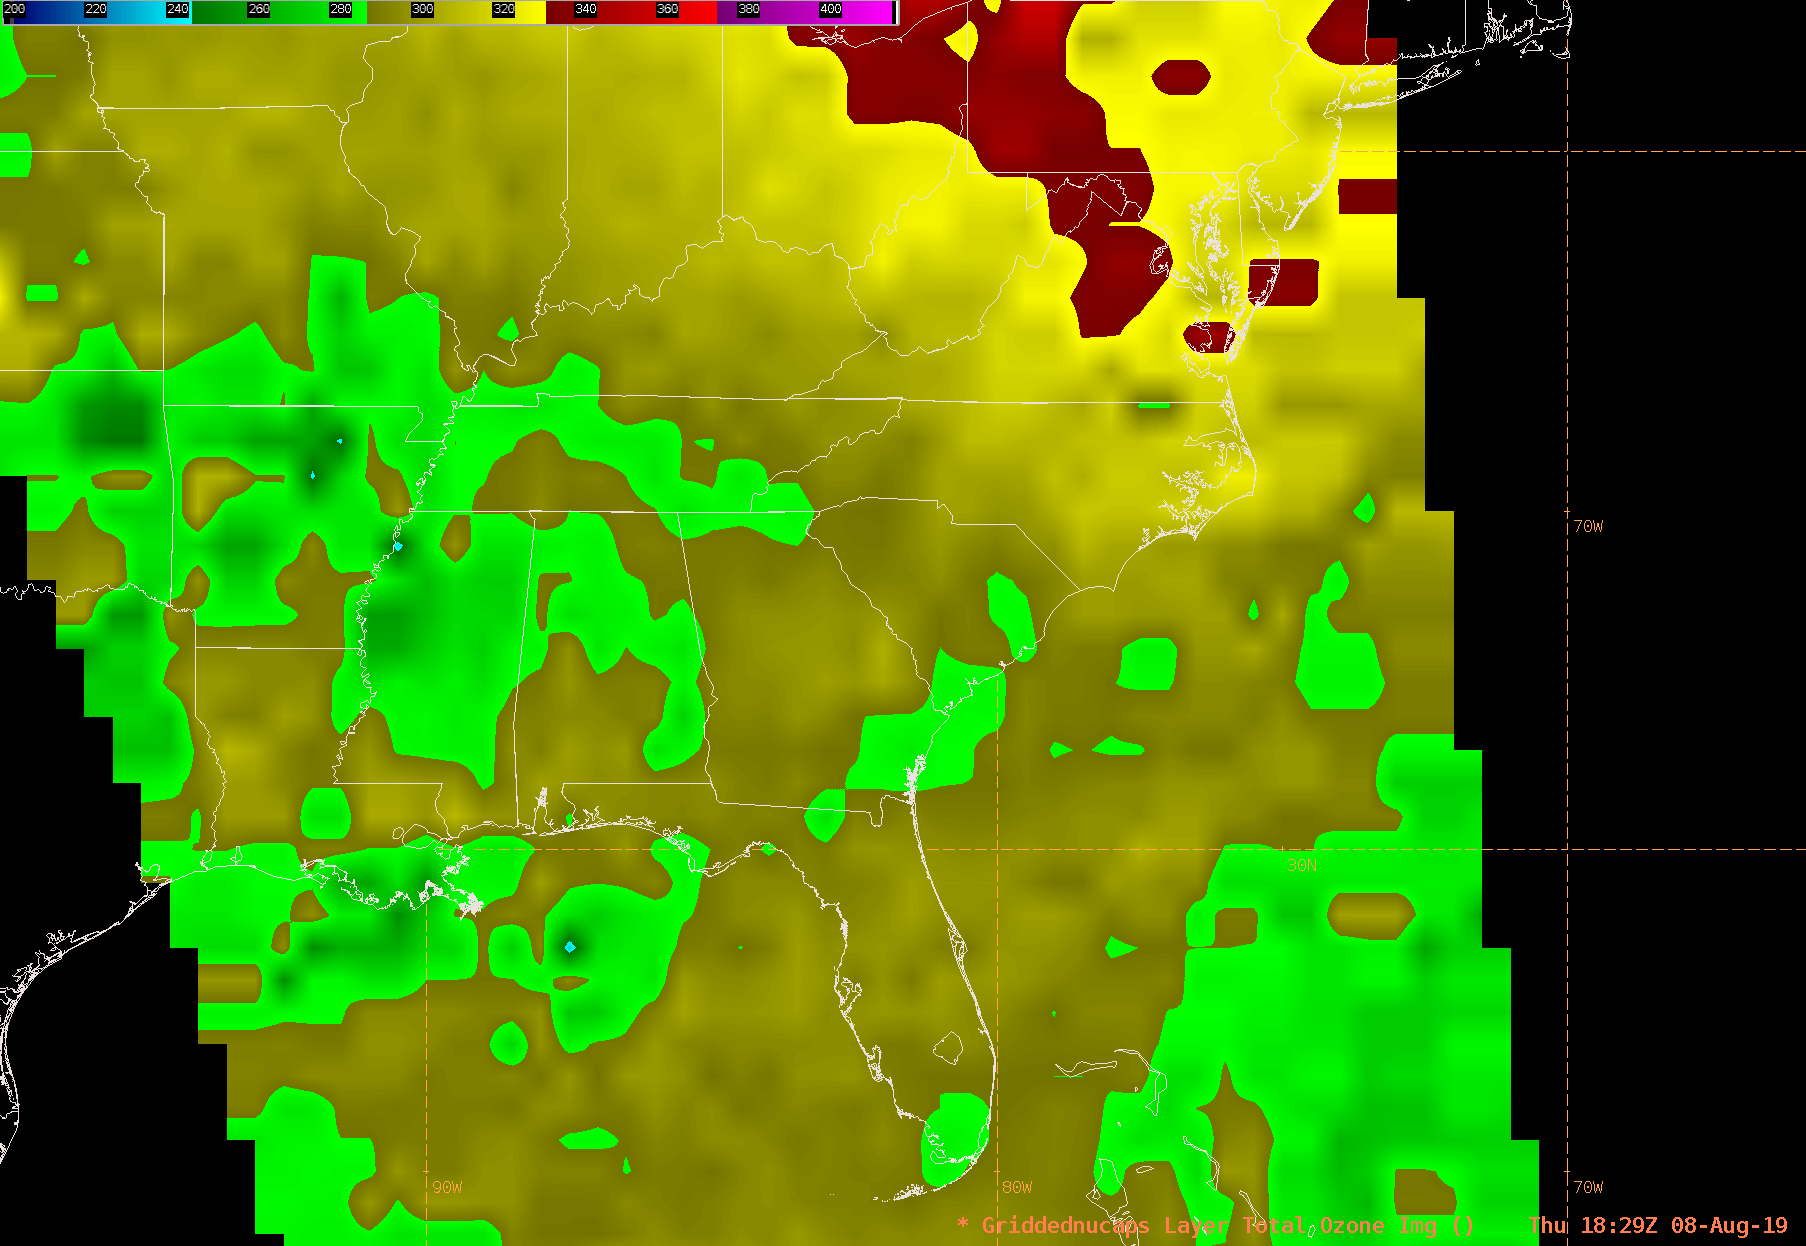
Total Ozone |
High ozone is a tracer for stratospheric air and tropopause folding which can dynamically affect cyclogenesis or hurricane tropical to extratropical transition, or be a driver for non-convective high wind events in the western U.S. A general rule to identify stratospheric air is 300 Dobson Units (DU). Values range from 100-600 DU [click to download -> recommended color table] |
|
|
|
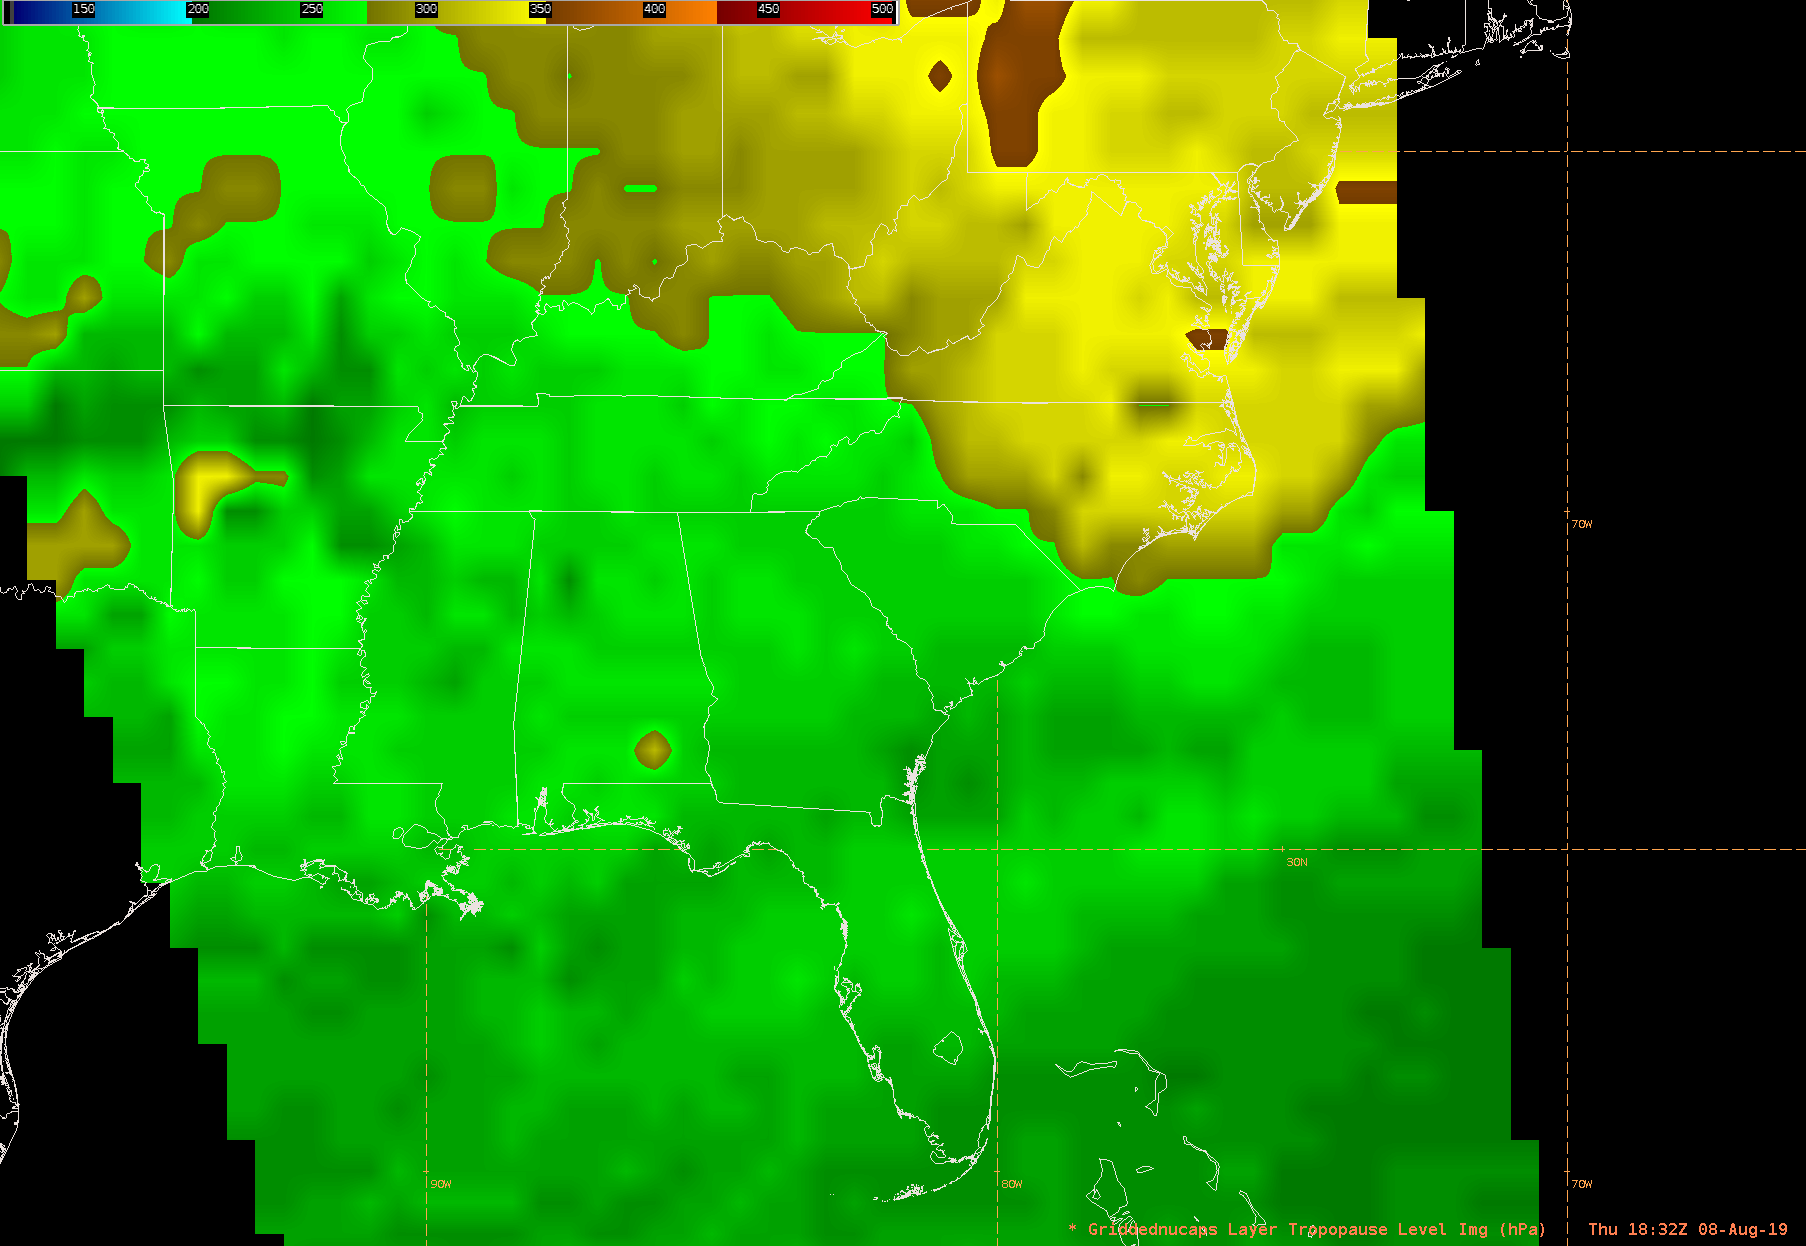
Tropopause Level |
Identification of the dynamic tropopause level based on ozone. [click to download -> recommended color table] |
Variable |
|
|
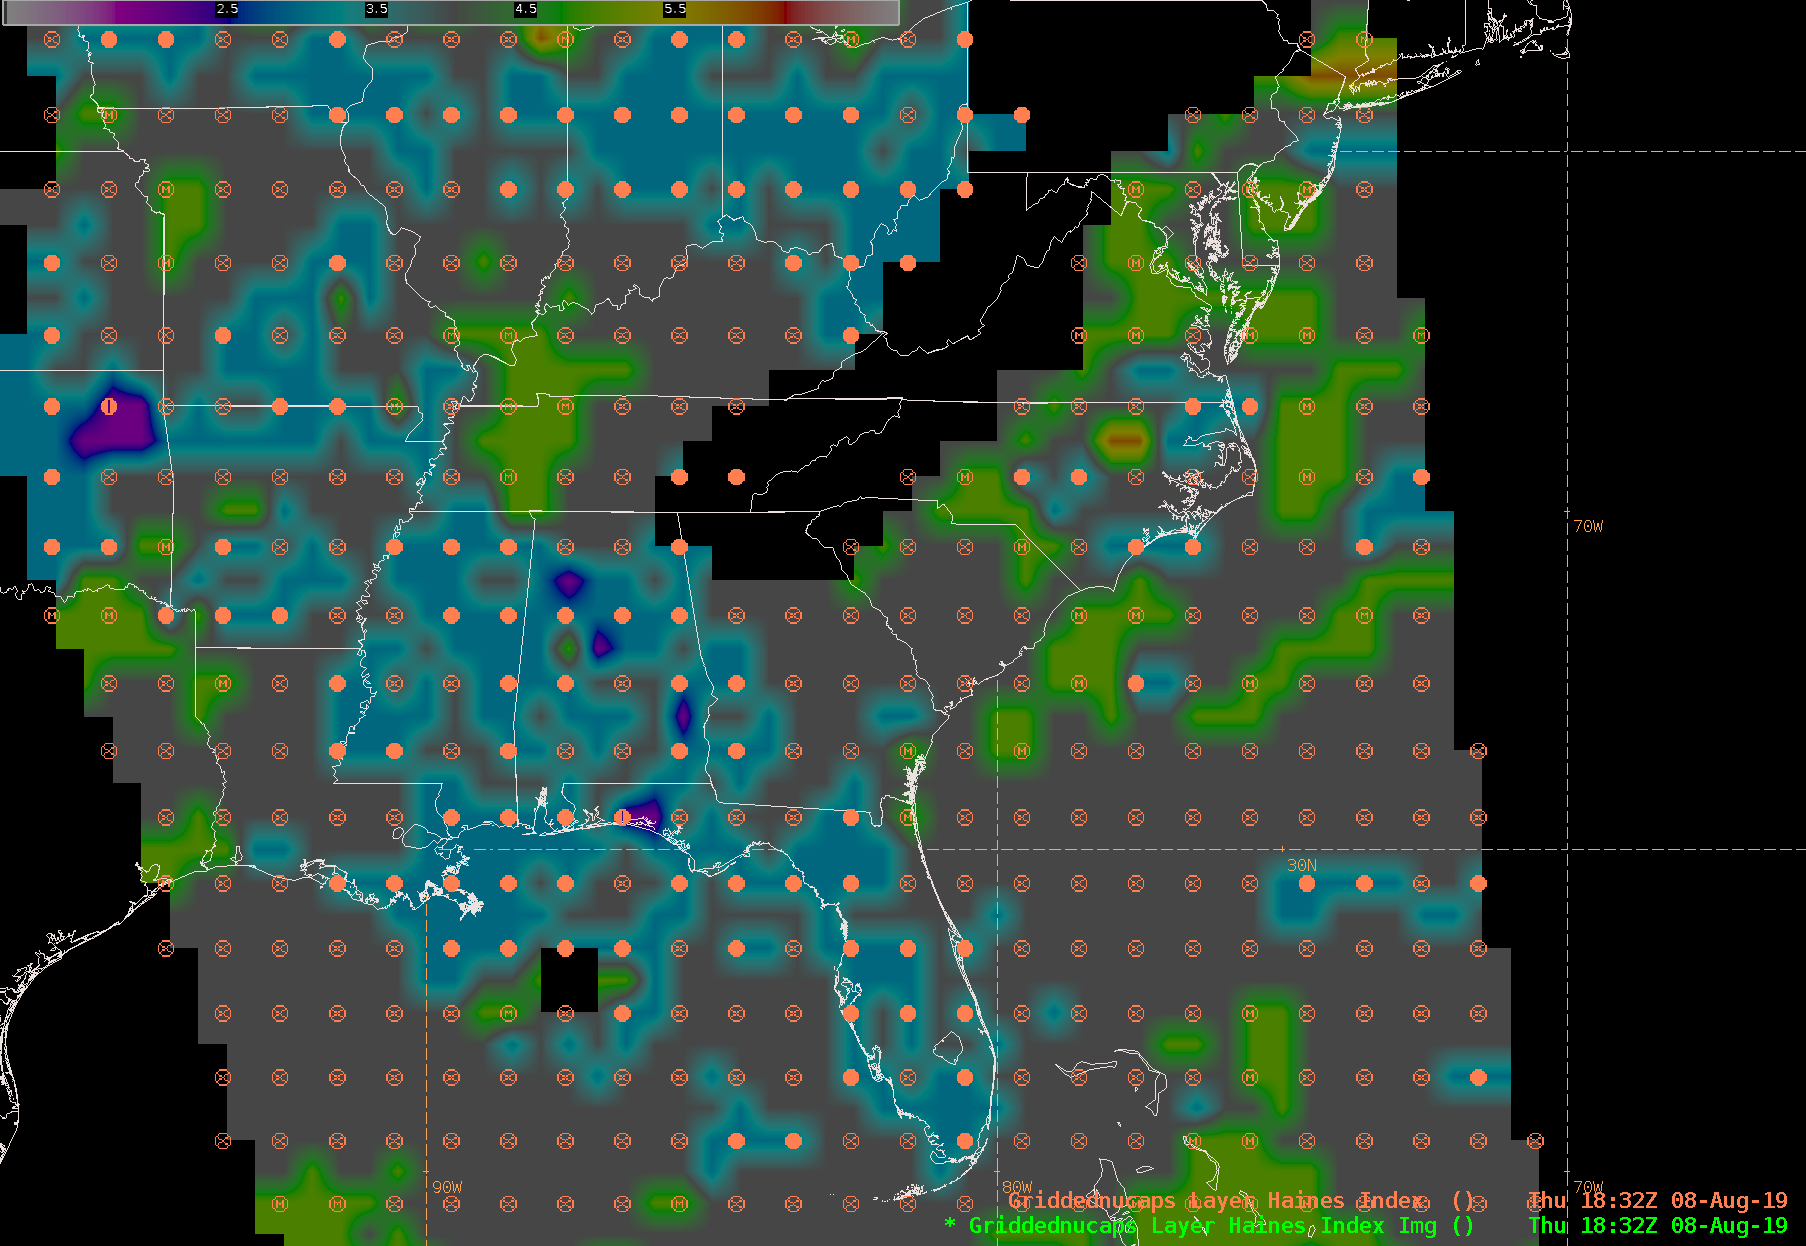
Haines Index |
AWIPS derived parameters calculates the Haines Index based on the stability and moisture terms. See Werth and Ochoa 1993. The levels used to calculate the Haines Index can be adjusted through the AWIPS Localization. For regions with high topography (Alaska and Western U.S.) it is recommended to calculate the Haines index with the 700 and 500 mb levels. If there are gaps in the Gridded NUCAPS Haines Index, check the Haines Index derived parameters to ensure the proper levels are used in the calculation for your region. Click the "see more info" link to the left for more information about adjusting the Haines Index in AWIPS. NOTE: changing the derived parameters will change the levels for Haines Index calculations with ALL model grids. |
Variable/User Selectable |
|
|
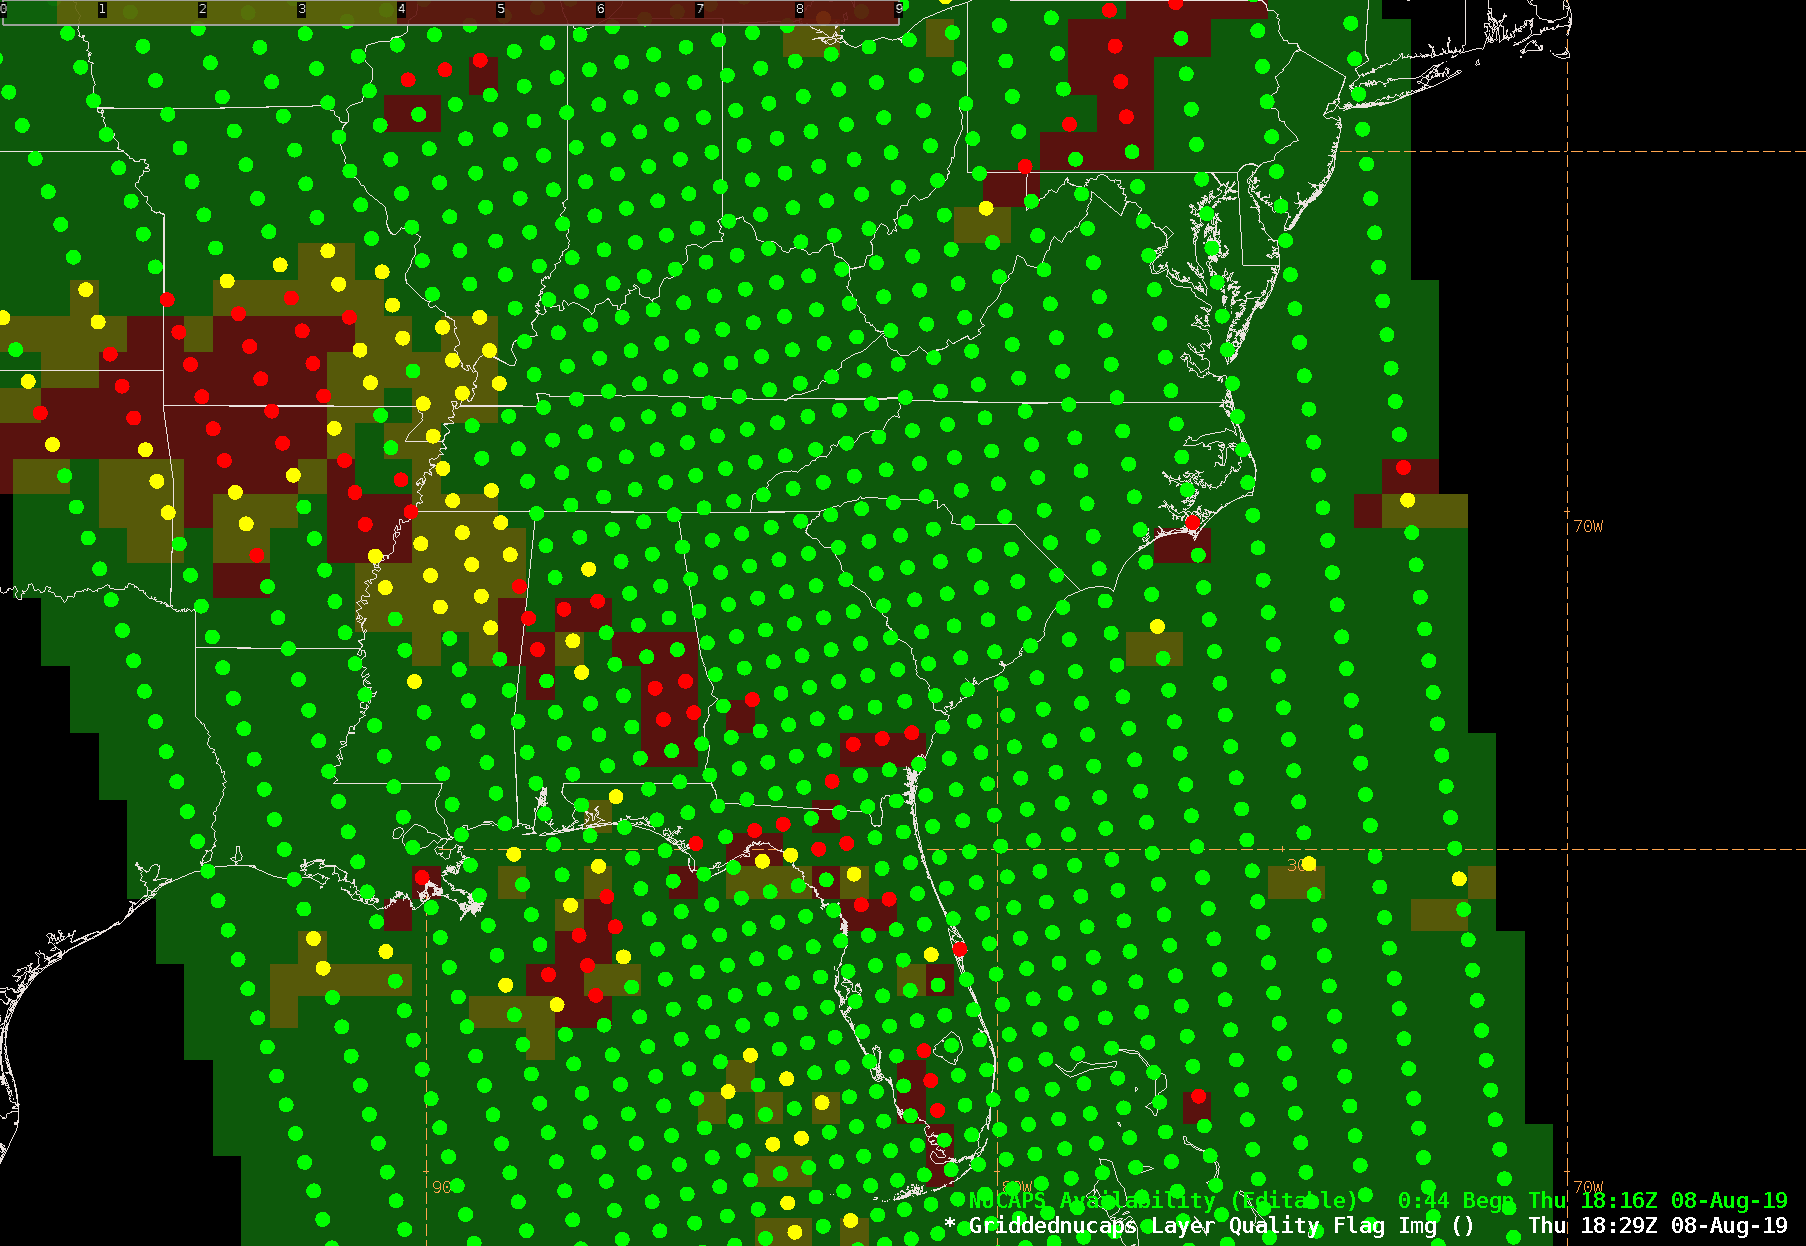
Quality Control |
A plan view display of the quality control fields where green indicates successful infrared and microwave retrieval, yellow indicates the infrared retrieval failed but the microwave retrieval was successful, and red indicates both the infrared and microwave retrievals failed. [recommended color table]. There are cases where the yellow colored soundings are still usable and is not necessarily an indication of moderate quality. |
N/A |