


Tropical Rain Identification - Warning Decision Training Division (WDTD)
Navigation Links
Products Guide
Tropical Rain Identification
Short Description
The Tropical Rain Identification (TRID) algorithm uses the Polar Vertical Profile of Reflectivity (Polar VPR) at each radar site for every volume scan to identify areas that may be experiencing tropical rainfall. Once the VPRs have been identified as "tropical", the TRID identifies whether precipitation at individual grid points are tropical/convective or tropical/stratiform, for use within the Surface Precipitation Type (SPT) product. The main goal is to provide information to help determine the use of tropical Z-R relationships that may improve accuracy of quantitative precipitation estimates (QPEs) in these areas.
Subproducts
None.
Primary Users
None. Primarily used as input to the Surface Precipitation Type product.
Input Sources
Radar Reflectivity, NOAA/NCEP Rapid Refresh (RAP) with nested High-Resolution Rapid Refresh (HRRR) 3-D temperature analysis, Seamless Hybrid Scan Reflectivity (SHSR), Height of Bright Band Bottom, and Probability of Warm Rain (POWR)
Resolution
Spatial resolution: 1km x 1km
Temporal resolution: 2 minutes (i.e., per SPT update)
Product Creation
The Tropical Rain Identification (TRID) algorithm identifies a Polar Vertical Profile of Reflectivity (Polar VPR) has “tropical” if the melting layer is more than 2 km above the ground, and if reflectivity below the melting layer is increasing (even slightly) with decreasing height. An example of a Polar VPR that is “tropical” is shown in Figure 2.
Additionally, once all Polar VPRs are classified as either “tropical” or “non-tropical”, the process identifies the tropical classification for individual grid points across the CONUS for the Surface Precipitation Type (SPT) product. This is done using thresholds of the Seamless Hybrid Scan Reflectivity (SHSR), Surface Wet-Bulb Temperature, Surface Temperature, Height of Bright Band Bottom, and Probability of Warm Rain (POWR) products. If all of these products’ criteria are met, and the grid point is within a defined radius of influence of a tropical radar, the grid point is classified as either Tropical Stratiform or Tropical Convective, based on its classification prior to going through the TRID. Figure 4 is an example of the SPT product where the tropical classifications are present.
Technical Details
Latest Update: MRMS Version 11.5
Current convective and stratiform Z-R relationships can underestimate heavy rainfall in tropical environments, possibly leading to the inability to detect flash flood events. Research on various VPRs found that underestimations of precipitation occurred mainly when:
- The VPR showed increasing reflectivity with decreasing height at lower levels.
- Increasing reflectivity with decreasing height denotes a tropical environment (as opposed to convective or stratiform) because when warm rain processes are dominant, many medium-sized drops are growing all the way to the surface via collision and coalescence (i.e., very moist environment), thus increasing reflectivity to the ground.
- There exists a bright band (BB) where reflectivity increases or remains constant below the bottom of the BB.
- Additionally, studies have found that the coexistence of different microphysical processes can occur within tropical rainfall. Particularly, stratiform and ice processes can occur along with warm rain processes. This fact makes the occurrence of a bright band possible, where hydrometeors (that are formed via warm rain processes) may be lofted into the ice region, but can pass back through the melting layer and reach the ground as liquid precipitation.
The automated Tropical Rain Identification (TRID) algorithm is described below:
- Calculate the instantaneous global Polar VPR using the procedure described in the documentation.
- A Polar VPR is identified as “tropical” if the following criteria are met:
- The melting layer is more than 2 km above the ground.
- Reflectivity below the melting layer is increasing (even slightly) with decreasing height.
- Find the local maximum reflectivity (Zlmax) near the freezing level (using the hourly RAP 0°C height) by looking 500m above the freezing level and continuing downward.
- The VPR is “tropical” if the Zlmax is at the bottom of the VPR.
- If it is not at the surface, determine if there is a bright band using the methodology described in the Height of the Bright Band Bottom product.
- Using the left side of Figure 1, follow the flow chart until the VPR is classified as either “tropical” or “non-tropical”. The default α = 0.8 dBZ.
- Find the local maximum reflectivity (Zlmax) near the freezing level (using the hourly RAP 0°C height) by looking 500m above the freezing level and continuing downward.
The TRID process within the Surface Precipitation Type (SPT) product is described below:
- Using the flow chart on the right of Figure 1, a pixel is “tropical” if all the following criteria are met:
- The pixel has a Probability of Warm Rain (POWR) higher than a predefined threshold, POWR0.**
- The surface temperature is warmer than 10°C.
- The Height of the Bright Band Bottom is higher than 2 km above ground level.
- The pixel is within 120km of the tropical radar (as identified via VPR, see above).
- The pixel has a Seamless Hybrid Scan Reflectivity (SHSR) > 25dBZ.
- The surface wet-bulb temperature is higher than 2°C to assure it is not snow.
- Whether it is tropical/convective or tropical/stratiform will depend on the precipitation type assigned to the pixel before reaching this step in the SPT process.
- Any pixels connected to a tropical pixel are also deemed tropical.
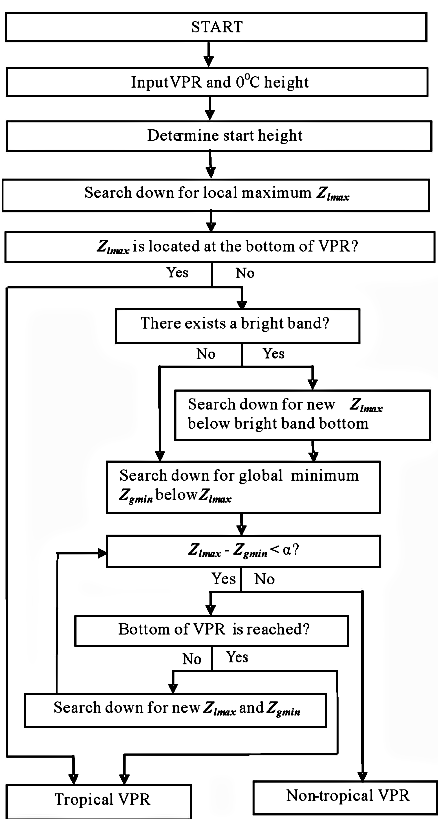
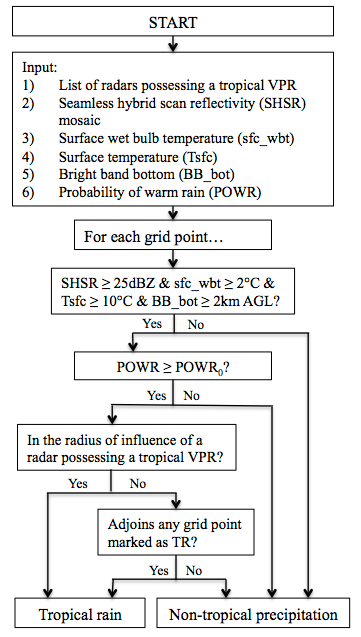
Figure 1. (left) Flow chart of the automated algorithm used to identify tropical VPRs. (Image from Xu et al. 2008) (right) Flow chart of the identification of tropical rainfall regions based on tropical VPRs. (Image updated from Xu et al. 2008) **Note: The Tropical Rain Identification producted was updated in MRMS Version 11.5 to be based on VPR, SHSR, and POWR uniformly across the US. This change was designed to remove discontinuities in the PCP_FLAG at 100°W as well as mitigate some overestimation biases in the radar QPE in the western US during the warm season.
References
Grams, H.M., J. Zhang, and K. Elmore, 2014: Automated Identification of Enhanced Rainfall Rates Using the Near-Storm Environment for Radar Precipitation Estimates. J. Hydromet. 15, 1238-1254.
Xu, Xiaoyong, Kenneth Howard, and Jian Zhang. "An automated radar technique for the identification of tropical precipitation." Journal of Hydrometeorology 9.5 (2008): 885-902.
Zhang, J., K Howard, C. Langston, et al., 2016: Multi-Radar Multi-Sensor (MRMS) Quantitative Precipitation Estimation: Initial Operating Capabilities. Bull. Amer. Met. Soc., 97, 621-638.
Other MRMS product documentation: Polar VPR, Seamless Hybrid Scan Reflectivity (SHSR), Height of Bright Band Bottom, and Probability of Warm Rain (POWR), Surface Precipitation Type, Surface Precipitation Rate
Applications
The Tropical Rain Identification algorithm classifies areas that have the potential to experience warm rain processes (e.g. tropical environments). In turn, it labels pixels within the Surface Precipitation Type (SPT) product as tropical, which is then used to select the proper Z-R relationship needed for the Surface Precipitation Rate (SPR) product. Ultimately, this leads to better quantitative precipitation estimates.
Example Images
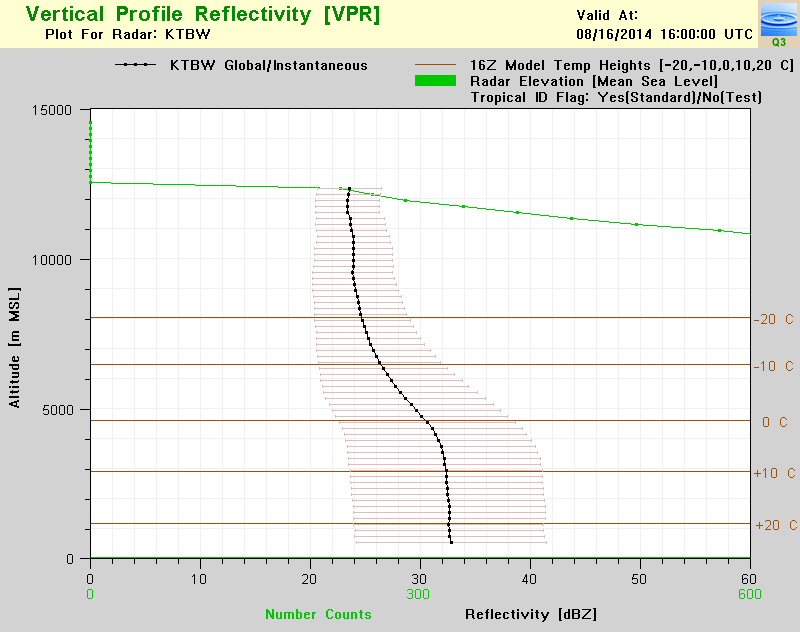
Figure 2. Example of a Polar Vertical Profile of Reflectivity (VPR), valid at 1600 UTC on August 16, 2014 at KTBX, that was classified as “tropical” by the Tropical Rain Identification (TRID) algorithm.

Figure 3. Example of precipitation classified as either Tropical Stratiform (light green) or Tropical Convective (dark green) over the same area as the VPR from Figure 3, valid at 1600 UTC at August 16, 2014.