


Radar Quality Index (RQI) - Warning Decision Training Division (WDTD)
Navigation Links
Products Guide
Radar Quality Index (RQI)
Short Description
An indicator of the single-site radar Quantitative Precipitation Estimate (QPE) uncertainty due to radar beam sampling characteristics (blockage due to terrain, beam height and width) and position with respect to the freezing level. RQI decreases at higher beam heights and more blockage.
Subproducts
None.
Primary Users
NWS: WFO, RFC
Input Sources
Hybrid Scan Radar Reflectivity, Radar Blockage Maps, NOAA/NCEP Rapid Refresh (RAP) with nested High-Resolution Rapid Refresh (HRRR) environmental data
Resolution
Spatial Resolution: 1km x 1km
Temporal Resolution: 2 minutes
Product Creation
The Radar Quality Index (RQI) indicates the single-site radar Quantitative Precipitation Estimate (QPE) uncertainty associated with Vertical Profiles of Reflectivity (VPRs) and beam blockage. RQI decreases with more blockage and higher beam heights.
The beam blockage component of the RQI is based on static terrain maps, and thus, does not change as long as the scanning strategy remains the same. However, the radar beam height component takes into account beam axis height and width, freezing level height, bright band thickness and the beam’s position with respect to the freezing level, and thus, does change with time.
Technical Details
Latest Update: MRMS Version 12.2
Accessible on: MRMS Operational Viewer
In essence, the index is the multiplication of two factors:
RQI = RQIblk * RQIhgt
where RQIblk and RQIhgt represent the RQIs based on blockage and radar beam height, respectively.
RQIblk is nothing more than the determination of the radar beam blockage, under standard atmospheric refraction conditions, using a static terrain map.
For blockages greater than 50%, RQIblk is set to ‘0’, while blockages ≤ 10% it is set to ‘1’. In between these limits, RQIblk is a linear function. RQIblk does not change as long as the scanning strategy is the same. In general, for complex terrain, where QPE errors are higher, the RQIblk value is lower. Regions, such as the plains, that are usually not as affected as much by blockage, would have higher RQIblk values.
RQIhgt takes into account beam axis height with respect to the freezing level. This component is not static because freezing level information comes from the model freezing level height, therefore, providing new information every volume scan.
There are times when radar quality can degrade below the melting layer, such as tropical and orographic environments. As of Version 12, an adaptable reference height was added that decreases RQI beginning at this height or at the bottom of the ML, whichever is lower. The reference height is an adaptable parameter for different domains (e.g. 1km for CONUS). For cases where the beam axis is either within or above the bright band, or if the bright band is on the ground, RQIhgt is an exponential function. In general, the lower the freezing level, the higher the QPE errors and the lower the RQIhgt value.
Figure 1 shows how the RQIblk and RQIhgt grids combine to give the final RQI for a single radar (in this case, KDAX). Notice how the radar QPE quality is relatively good in the NW-SE direction, up to ~150 km. This corresponds to the central valley region that is apparent in the RQIblk field in Figure 1(a). However, to the east, the high quality decreases in range to ~100 km due to blockages in the area. Out west, the QPE quality is much worse than the other areas because of bad blockage around 40 km west of the radar.

The Radar Quality Index (RQI) product (Figure 3) is generated by mosaicking single radar RQI fields.
Version 12 Update:
The precision of the RQI field has increased from 0.1 to 0.01. This is to support the new Multi-Sensor QPE, which blends precipitation estimation data from different sources and uses RQI as a weighting factor for radar QPE input. The higher precision allows a more spatially continuous blending of the radar QPE with other data sources.
Figure 2 below shows the RQI fields from Version 11.5 and Version 12. The RQI Version 12 (right image) shows lower values and a smoother distribution in space than in Version 11.5 (left) as a result of the RQIhgt and precision changes mentioned above.

Figure 2. RQI fields from MRMS version 11.5 (left) and version 12 (right), both valid at 20Z 4 March 2019.
References
Zhang, J., Y. Qi, C. Langston and B. Kaney, 2012: Radar Quality Index (RQI) – a combined measure for beam blockage and VPR effects in a national network. Weather Radar and Hydrology, 351, 388-393.
Applications
The Radar Quality Index (RQI) product is a visual way to check where QPE errors will likely be large due to blockage and VPR uncertainties. Additionally, RQI can be used as a real-time map of radar coverage voids, thus providing guidance for deploying gap-filling radars. RQI is also used as an input for the Gauge Quality Control algorithm, as well as the QPE Mosaic Process.
Example Images
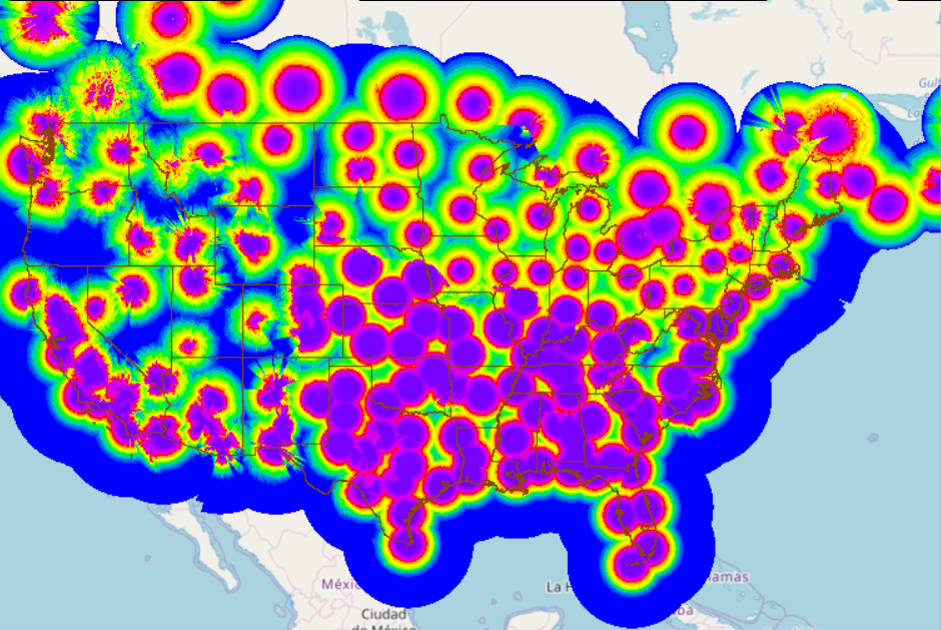
Figure 3. An example of the Radar Quality Index (RQI) product for February 2019. Cool colors denote regions of high QPE uncertainty due to 1) beam blockage and 2) the radar beam position with respect to a low freezing level.
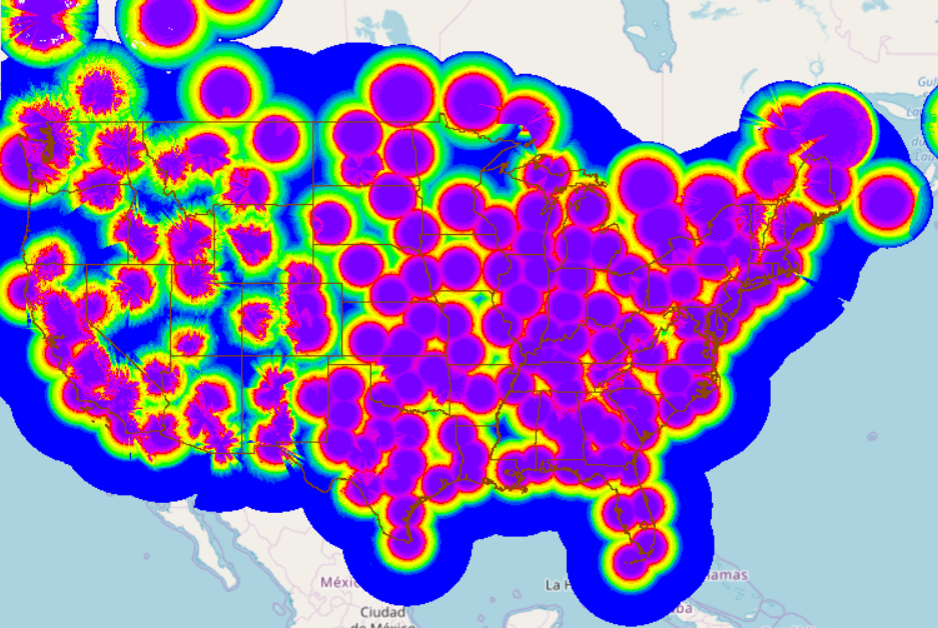
Figure 4. An example of the Radar Quality Index (RQI) product for August 2019. This is an example of a warm season RQI map. Warm colors denote regions of low QPE uncertainty due to minimal blockage and the radar beam position being (generally) below the freezing level. Note how there are still issues in the West due to complex terrain.