Height of Bright Band Top & Bottom - Warning Decision Training Division (WDTD)
Navigation Links
Products Guide
Height of Bright Band Top & Bottom
Short Description
2-D grids of the approximate heights of the top and bottom of the melting layer.
Subproducts
None
Primary Users
NWS: RFC, CWSU, AWC
Input Sources
NOAA/NCEP Rapid Refresh (RAP) with nested High-Resolution Rapid Refresh (HRRR) temperature soundings, reflectivity from individual radar sites
Resolution
Spatial resolution: 1km x 1km
Temporal resolution: 2 minutes
Product Creation
The Bright Band (BB) is a radar signature of the melting layer; a narrow horizontal layer of higher radar reflectivity in precipitation at the level in the atmosphere where snow melts to form rain. It is most commonly associated with stratiform precipitation regions; however, not all stratiform regions have a BB.
The BB identification algorithm first segregates convective and stratiform regions based on vertical reflectivity structure, and then only completes the analysis on stratiform areas. It computes the volume scan mean Vertical Profile of Reflectivity (VPR) for the stratiform region, and then searches the VPR for the local maximum reflectivity near the RAP-derived 0°C level. This level is defined as the BB peak, and then the algorithm finds bounds in the VPR for the BB top and bottom, using default values. Once these top and bottom values are found for each radar site, a 2D objective analysis is performed on the RAP freezing level height grid to create a uniform grid of BB heights, one for BB top heights and one for BB bottom heights.
Technical Details
Latest Update: MRMS Version 10
Accessible on: MRMS Development site
The steps for completing this process are described below:
- Segregate the convective and stratiform regions in the observed radar data.
- A radar bin is defined as convective if it meets one of the following criteria:
- Reflectivity at any height in the column is greater than 50 dBZ.
- Reflectivity at or above the -10°C height is greater than 30 dBZ.
- The -10°C height is derived from RAP temperature soundings from the hourly analysis.
- Otherwise, it is labeled as stratiform.
- A radar bin is defined as convective if it meets one of the following criteria:
- Compute the volume scan mean Vertical Profile of Reflectivity (VPR) for the stratiform region using the procedure described in the Polar VPR documentation.
- Finally, the BB identification scheme is used on the mean stratiform VPR at each scan and temperature profile at the radar site.
- The RAP-derived freezing level (0°C height) is identified at the radar site.
- The local maximum reflectivity near this level in the VPR is located, beginning with looking 500 meters above the freezing level and continues downward.
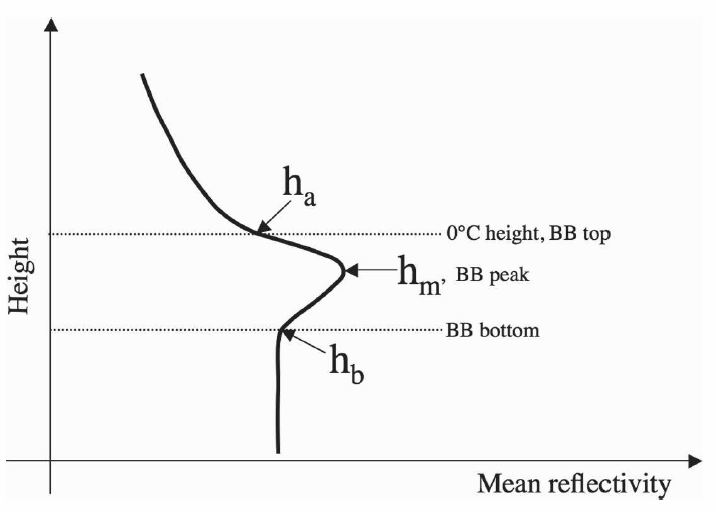
- Once the local maximum height (hm) is found, the algorithm bounds the VPR by finding the heights above (ha) and below (hb) the hm where reflectivity (in dBZ) has dropped by 10% (default value) of the maximum (Figure 1).
- If each of these heights are within 1 km of the hm, and they make a total layer no thicker than 1.5 km, then the BB is deemed to exist. (NOTE: some studies say just look for the heights of the “inflection points” above and below the hm.)
- The top of the BB is defined with the following default values:
- If the ha ≤ 500 m above the hm, then ha is the BB top.
- If ha is > 500 m above the hm, then the BB top is hm + 500 m.
- The bottom of the BB is defined with the following default values:
- If the hb ≤ 700 m below the hm, then hb is the BB top.
- If hb > 700 m below the hm, then the BB bottom is hm − 700 m.
- Since the VPR-derived BB top and bottom heights are irregular in space (because they are collected at various radar sites), a 2-D objective analysis needs to be completed to create a uniform grid of BB heights.
- For the BB top:
- The RAP 0°C height grid will be used as the background grid to which the analysis will be interpolated onto.
- Using the VPR-identified BB top observations (from various radar sites), an interpolation scheme is performed that weighs the BB top values based on their distance from the given grid cell.
- This is the new analysis field for the Height of the Bright Band Top product.
- For the BB bottom:
- The RAP 0°C height grid minus 700 meters (i.e. FLH – 700 m) will be used as the background grid to which the analysis will be interpolated onto.
- Using the VPR-identified height of BB bottom observations (from various radar sites), an interpolation scheme is performed that weighs the BB bottom values based on their distance from the given grid cell.
- This is the new analysis field for the height of the bright band product.
- For the BB top:
References
Zhang, Jian, Carrie Langston, and Kenneth Howard. "Brightband identification based on vertical profiles of reflectivity from the WSR-88D." Journal of Atmospheric and Oceanic Technology 25.10 (2008): 1859-1872.
Applications
The Height of Bright Band Top and Height of Bright Band Bottom products are useful for identifying icing hazards for aviation and for NWP model data assimilation. Also, this product can help identify areas that may have overestimated QPEs, which can help with better interpretation of rainfall amounts, as well as for such biases in other products. As of now, Height of Bright Band Top is only a diagnostic tool, and not directly incorporated into other MRMS products. For instance, it may be compared to the Seamless Hybrid Scan Reflectivity (SHSR) heights to understand the relative altitude of the radar QPE with respect to the melting layer. On the other hand, the Height of the Bright Band Bottom is used as a criterion within the Tropical Rain delineation process, which helps classify where tropical rainfall is occurring in order to define proper Z-R relationships.
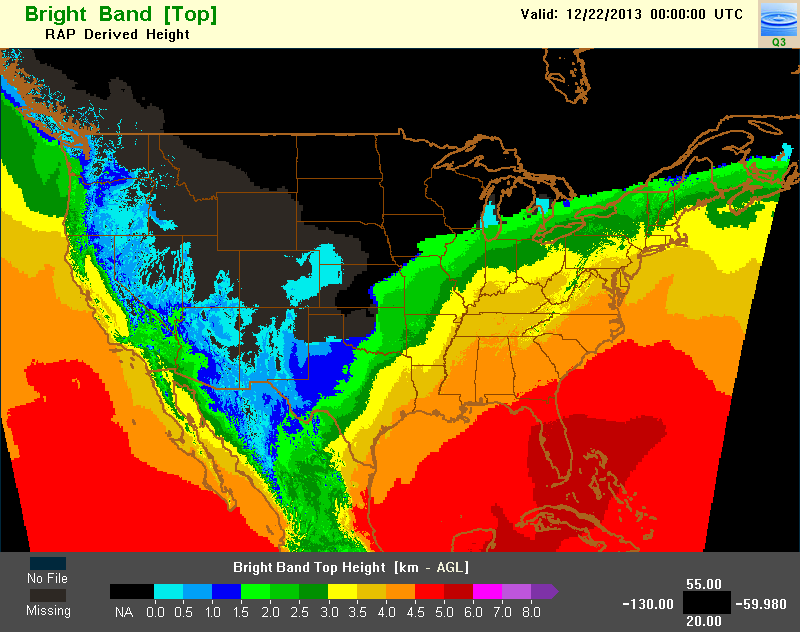
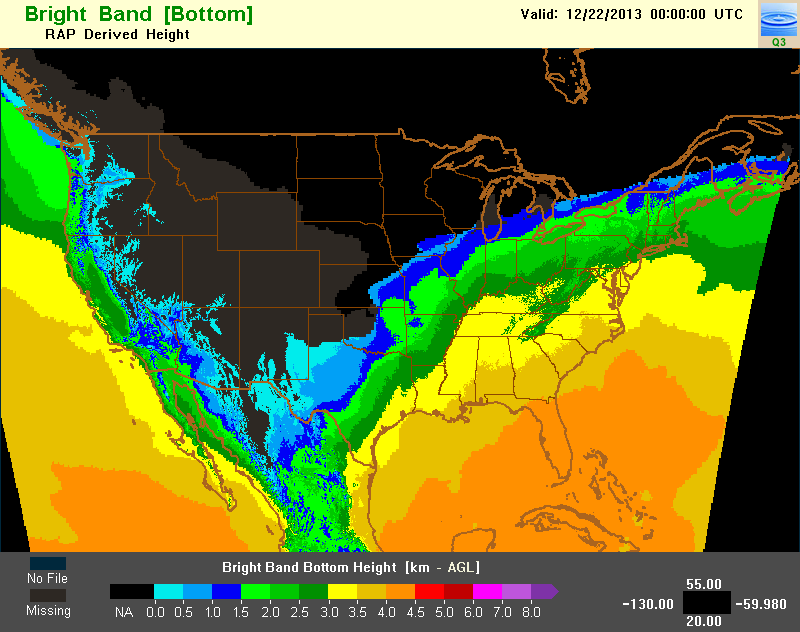
Example Images