Introduction
The newest CoastWatch Utilities version 3.7.1 now has a feature in
the cwrender command line tool to produce images that show both
red/green/blue composites such as true color or false color images, in
combination with a color enhancement such as SST or chlorophyll image.
In the locations where the color enhancement has no valid data, the
red/green/blue composite is used — for this reason we call it
"hybrid mode" rendering because it creates a hybrid of
different types of data.
GOES Example
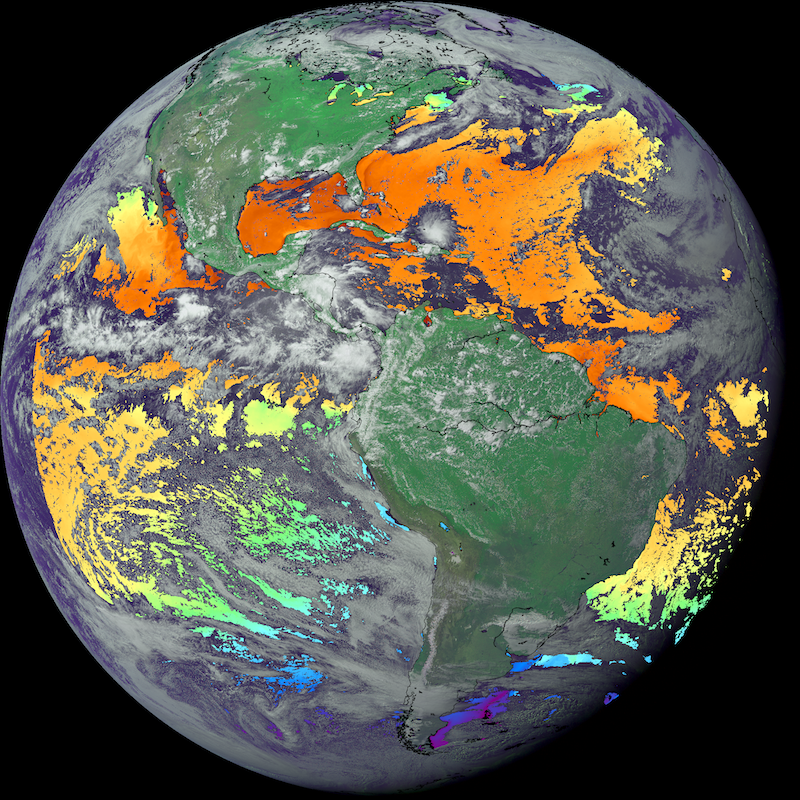
The first example is a GOES image that combines three GOES visible
wavelength channels with sea surface temperature (SST) data produced
from GOES thermal wavelength channels:

All the required data must be in one HDF or NetCDF file in order for
cwrender to use it. In this example, we created an HDF file with the
following contents (this is the output from the cwinfo command):
Contents of goes_output.hdf

Global information:
  Satellite:           G16
  Sensor:              FM1
  Date:                2022/07/22 JD 203
  Time:                19:05:06 UTC
  Scene time:          day/night
  Projection type:     sensor_scan
  Transform ident:     noaa.coastwatch.util.trans.EllipsoidPerspectiveProjection
  Origin:              DOC/NOAA/NESDIS > U.S. Department of Commerce, National Oceanic and Atmospheric Administration, National Environmental Satellite, Data, and Information Services
  Format:              CoastWatch HDF version 3.4
  Reader ident:        noaa.coastwatch.io.CWHDFReader

Variable information:
  Variable   Type    Dimensions   Units             Scale      Offset
  abi_ch1    short   5424x5424    W m-2 sr-1 um-1   0.812106   31.9375
  abi_ch2    short   5424x5424    W m-2 sr-1 um-1   0.158592   127.937497
  abi_ch3    short   5424x5424    W m-2 sr-1 um-1   0.376913   31.937498
  sst        short   5424x5424    kelvin            0.01       -27315
The processing steps that we used to create this file are contained
in the attached Unix script file 'goes_hybrid.sh', but your approach
to create the data file may vary from ours. The call to cwrender for
hybrid mode rendering using this data file is as follows:
cwrender \
  --size 2048 --nolegends --coast black \
  --composite abi_ch2/abi_ch3/abi_ch1 \
  --redrange 1/600 --greenrange 1/350 --bluerange 1/800 \
  --redfunction gamma --greenfunction gamma --bluefunction gamma \
  --enhance sst --palette HSL256 --units celsius --range 5/35 \
  goes_output.hdf goes_output.png
The --composite option specifies which variables to use in the false
color composite, and the --enhance options specifies which variable to
enhance using a color palette. The other options help the composite
and enhancement do their jobs by supplying range, function, and
palette information (see the cwrender manual page for explanations).
VIIRS Example
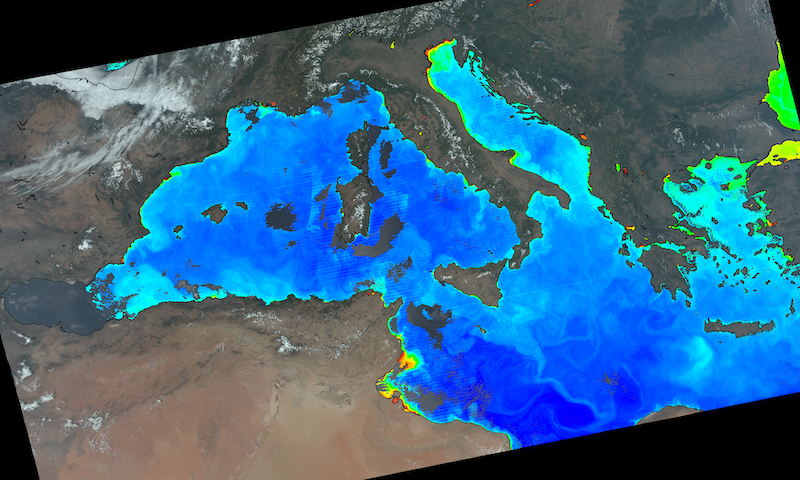
The next example is a VIIRS image that shows a true color composite
from three VIIRS visible wavelength channels combined with
VIIRS-derived chlorophyll data:

As in the previous example, we created an HDF data file with the
following contents:
Contents of viirs_output.hdf

Global information:
  Satellite:           S-NPP
  Sensor:              VIIRS
  Date:                2022/07/22 JD 203
  Start time:          12:10:27 UTC
  End time:            12:14:42 UTC
  Projection type:     mapped
  Transform ident:     noaa.coastwatch.util.trans.TransverseMercatorProjection
  Map projection:      Transverse Mercator
  Map affine:          0 -750 750 0 -1499625 899625
  Spheroid:            WGS 84
  Origin:              NOAA/NESDIS/STAR/SOCD
  Format:              CoastWatch HDF version 3.4
  Reader ident:        noaa.coastwatch.io.CWHDFReader

Variable information:
  Variable    Type    Dimensions   Units                  Scale   Offset
  EV_BandM3   float   2400x4000    mW cm^-2 um^-1 sr^-1   1       0
  EV_BandM4   float   2400x4000    mW cm^-2 um^-1 sr^-1   1       0
  EV_BandM5   float   2400x4000    mW cm^-2 um^-1 sr^-1   1       0
  chlor_a     float   2400x4000    mg m^-3                -       -
The attached Unix script file 'npp_hybrid.sh' shows how we created
this file from a series of consecutive VIIRS level 2 granule files:

The cwrender call is similar to the previous example:
cwrender \
  --size 2048 --nolegends --coast black \
  --composite EV_BandM5/EV_BandM4/EV_BandM3 \
  --redrange 0.74/60.38 --greenrange 1.68/55.87 --bluerange 2.52/61.55 \
  --redfunction gamma --greenfunction gamma --bluefunction gamma \
  --range 0.01/64 --enhance chlor_a --function log --palette Chlora-1 \
  viirs_output.hdf viirs_output.png
In this case we used VIIRS visible channel 5/4/3 data that
corresponds to red, green, and blue wavelengths for the --composite
option, and chlorophyll data for the --enhance option. As before, the
other options help with proper data range and scaling. The ranges for
the VIIRS channel data were determined by running cwstats on the HDF
file to calculate the minimum and maximum data values:
phollema$ cwstats viirs_output.hdf
Variable       Count     Valid     Min        Max        Mean       Stdev      Median
EV_BandM3      9600000   8517567   2.5154     61.5498    8.758797   4.459355   7.732191
EV_BandM4      9600000   8517567   1.6818     55.8729    7.228512   4.817645   5.798152
EV_BandM5      9600000   8517567   0.7442     60.3766    6.454365   6.27909    3.731425
chlor_a        9600000   3229851   0.001      391.1622   0.217629   2.406901   0.120578
