A user asked about using GeoTIFFS from the website in
ArcMap: When I map the raster in my GIS software (ArcMap), the
numbers make no sense—the values go from 0 to over 200, which is not
a reasonable temperature range for ocean water in either Celsius or
Fahrenheit. It also doesn’t match the range shown in the PNG files,
which looks much more reasonable. Do I need to be doing some sort of
conversation on these values?
The values require a conversion step but another option is to use
the NetCDF data. It is a self-describing format and in the case of
the Geo-Polar Blended SST is actually smaller in filesize and will
retain the values (in Kelvin) but if degrees (C or F) are desired, a
step similar to the example below is required. There are also
additional services that leverage the NetCDF and may provide improved
methods of working with our satellite data.
When using the GeoTIFFs from the website, the values are scaled to
8-bit which include 0-255. The inverse scaling (which would give you
temperature units) is embedded in a TIFF tag called
'ImageDescription'. Most programs that can read TIFF usually have a
way of reading these tags. The value for this tag is the mathematical
conversion to get back to the parameter's units. For example:
TIFF Tag: ImageDescription:
sst_analysis =
color_index*0.1411764705882353 + 0.0
Looking in ArcMap and using the identify tool, I can pick a
pixel with a Color Index of 206.
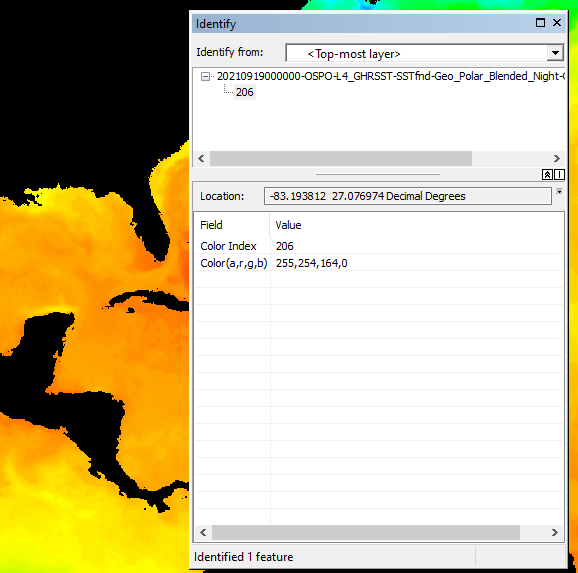
When I use this value in the scaling equation, I get an
sst_analysis value of 29.082 degrees C:
sst_analysis = 206 * 0.1411764705882353 + 0
sst_analysis = 29.082 degrees C
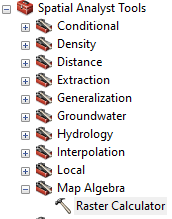
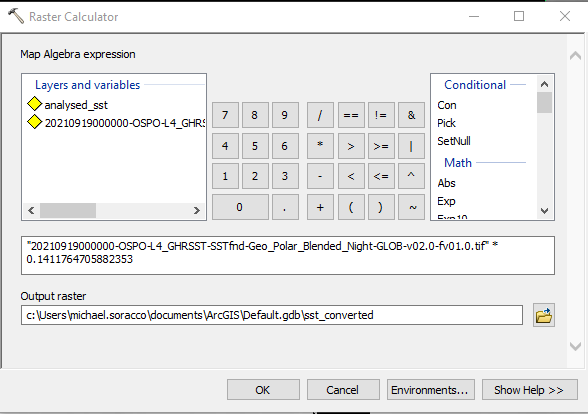
Since it's not realistic to click and calculate for each point, you
can apply the scaling using ArcMap; however, this requires the Spatial
Analyst extension. The Raster calculator can be used to apply the
scaling to the entire layer:
The layer then is converted to a raster and added to your view. You
can leave the colormap as is and keep the GeoTIFF on top to visualize
the data but use the sst_converted in any calculations. Here I've
selected the pixel with the Color Index of 206 and get the same value
in degrees Celsius that I calculated before. Also shown is the
analysed_sst (in Kelvin) directly from the NetCDF. Note, if I wanted
the NetCDF to bin in degrees Celsius or Farenheit, I would use the
Raster Calculator in a similar manner. An advantage of the NetCDF is
that if any scaling is used within the NetCDF, it's automatically
applied. In other words, because you are using GeoTIFFs from
multiple dates (years), you will need to verify the scaling equation
for each GeoTIFF.
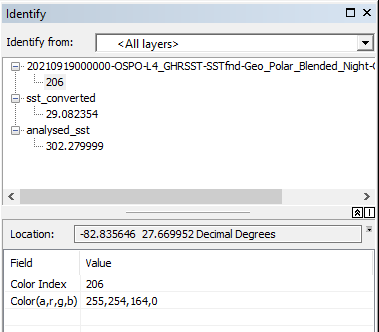
Note, by scaling to 8 bit and doing the inverse calculation from
scaled space to degrees, it is possible some precision is lost. We
can see this when converting the NetCDF Kelvin (analysed_sst layer) to
degrees C:
Degrees C = analysed_sst K - 273.15
29.129999 C = 302.279999 K - 273.15
Recall, our converted value was 29.082354, a difference of 0.047645
degrees. This is due to the rounding to an integer during the scaling step.
Color Index = 29.129999 C / 0.1411764705882353
Color Index = 206.3374929166667 => 206
Another method is to use the NetCDF data. It is a self-describing
format that in the case of the Geo-Polar Blended SST is actually
smaller in filesize and will retain the values (in Kelvin).
