Jack,
Glad to see you checking things out and trying to keep us honest.
1) We are retrieving and showing current NDFD point forecasts
from digital.mdl.nws.noaa.gov on Point Vis in real time. We are
not storing previous NDFD forecasts. Therefore, the current NDFD
toggle gets dimmed when in dProg/dt Mode.
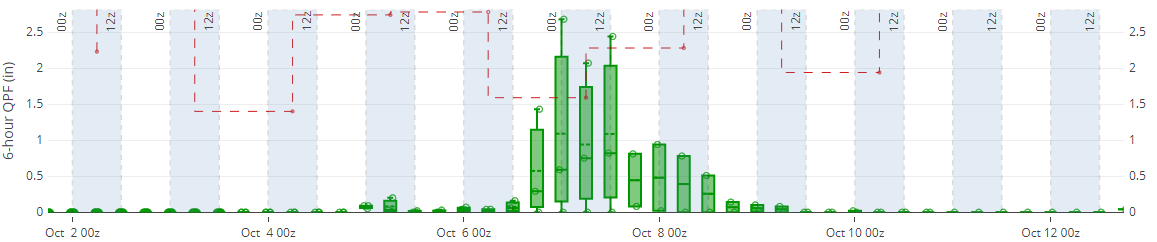
Daily WIC records for QPF only show up on the middle graph when a
forecast nears record amounts. As WIC records are for daily
amounts (not 6-h or total accumulations), we didn't think it made
sense to plot them elsewhere in Pt Vis for this element.
The example below is for KBWI.
https://wsup.mdl.nws.noaa.gov/ptvis/?cycledatetime=202110011700&station_id=KBWI&domain=conus&version=v4.0&dataset=nbm&windsuv=uv10&elmt=qpf06total
None of forecast amounts on your KDFW example are near the WIC
daily record.
https://wsup.mdl.nws.noaa.gov/ptvis/?cycledatetime=2021100117&station_id=KDFW&domain=conus&version=v4.0&dataset=nbm&windsuv=uv10&elmt=qpf06total
2) What you are seeing in Dprog/dt mode is the Total Accumulated
QPF as of the valid time indicated by the vertical slider. For
NBM issuances that are closer to the valid time, the amounts go
down, because the number of periods included in the total
decreases, which is probably not very useful. Perhaps we should
be plotting QPF06 in dprog/dt Mode instead. That way, the change
over time would be for the same period length forecast.
I'll see what we can do.
DR
On 10/1/2021 3:24 PM, Jack Settelmaier wrote:
I was in the WSUP taking a look at the new NDFD offerings, and
1) I'm not seeing that d(NDFD)/dt style views are possible, ala
the style of the d(NBM)/dt view in the attached? Is that
correct, or do I need to dig more? 1a) I see the toggle for the
"WIC Records" but toggling ON/OFF, though I see the High
and Low dotted lines show up in the Legend, I see nothing
plotted on the time/height display. What am I missing, or
is it not fully implemented yet in this view?
2) In the attached, I wanted to make sure I understand the view
I'm seeing. When I first choose the Accumulated QPF for a
desired time, like 18UTC Sat Oct 2, as I have, when I enter in
to the d(prog)/dt mode, I'm less clear on the time period for
the QPF Accums that are shown. I get that they all end at my
desired time, of Sat afternoon, but what period are they
accumulated over. Surely they are not all 6-hr accumulations,
but are more likely 24-hr accumulations, since when I made this
the most recent NBM v4.0 run was 17UTC Fri Oct 1.
If they ARE 24-hr QPF amounts, then that matches what I
expected to see, but I have no easy text reference on the screen
to know for sure, especially when the middle area shows 6-hr
QPFs.
https://wsup.mdl.nws.noaa.gov/ptvis/?cycledatetime=2021100117&station_id=KDFW&domain=conus&version=v4.0&dataset=nbm&windsuv=uv10&elmt=qpf06total
What I was exploring was how earlier in the week, ~Tuesday,
forecast rainfall totals for KDFW from the NBM were on the order
of 3.00" (for a 24-hr period ending Sat), but with subsequent
runs since Tuesday, NBM forecast amounts have dropped
considerably, down to about 1/10th of the earlier forecasts--now
about 0.36"
Is my interpretation correct?
--
Jack Settelmaier Whole Story Uncertainty
& Probabilities Viewer Virtual Lab Forum https://vlab.noaa.gov/web/wsup/forums/-/message_boards/view_message/17862895VLab.Notifications@noaa.gov


