Mesoanalysis Using the Three Ingredients Method in North Texas: 2/20/2018 - Operations Proving Ground
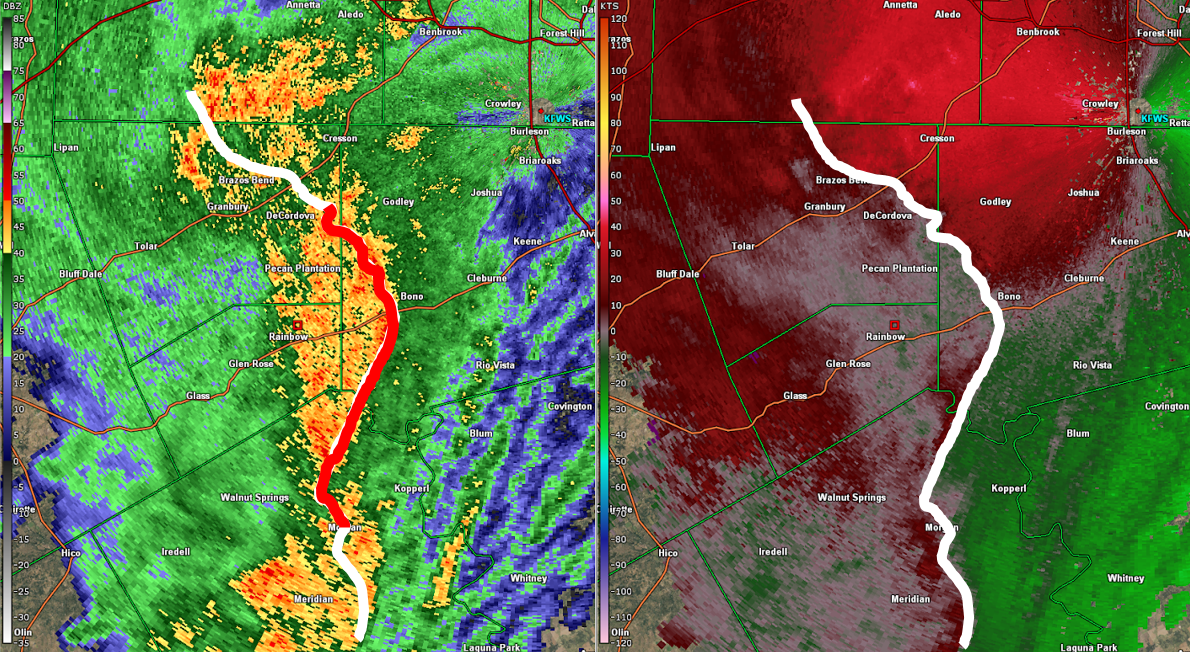
Would you issue a tornado warning based on the radar imagery in Figure 1? The rotational velocity (Vrot) of the circulation just northwest of Godley, TX (located about 20 minutes southwest of Fort Worth, TX) was only 15 kts; notably below what might be considered the typical “threshold” of 30 kts for Quasi-Linear Convective System (QLCS) tornadoes (Smith et al. 2015; Rogers et al. 2016).
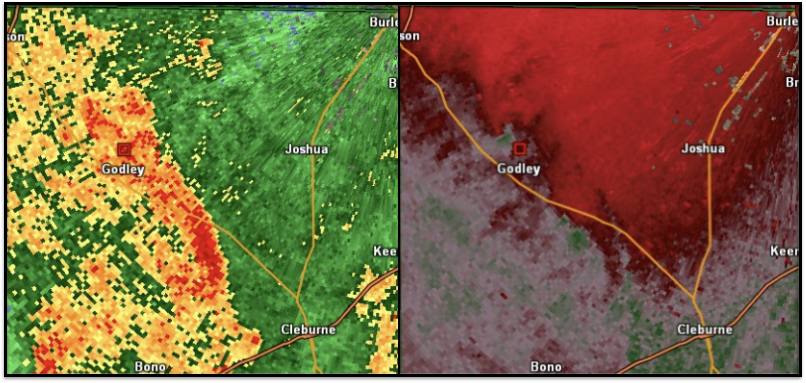
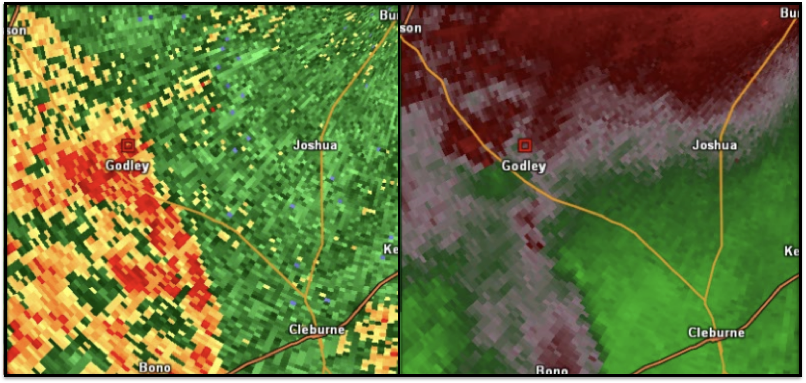
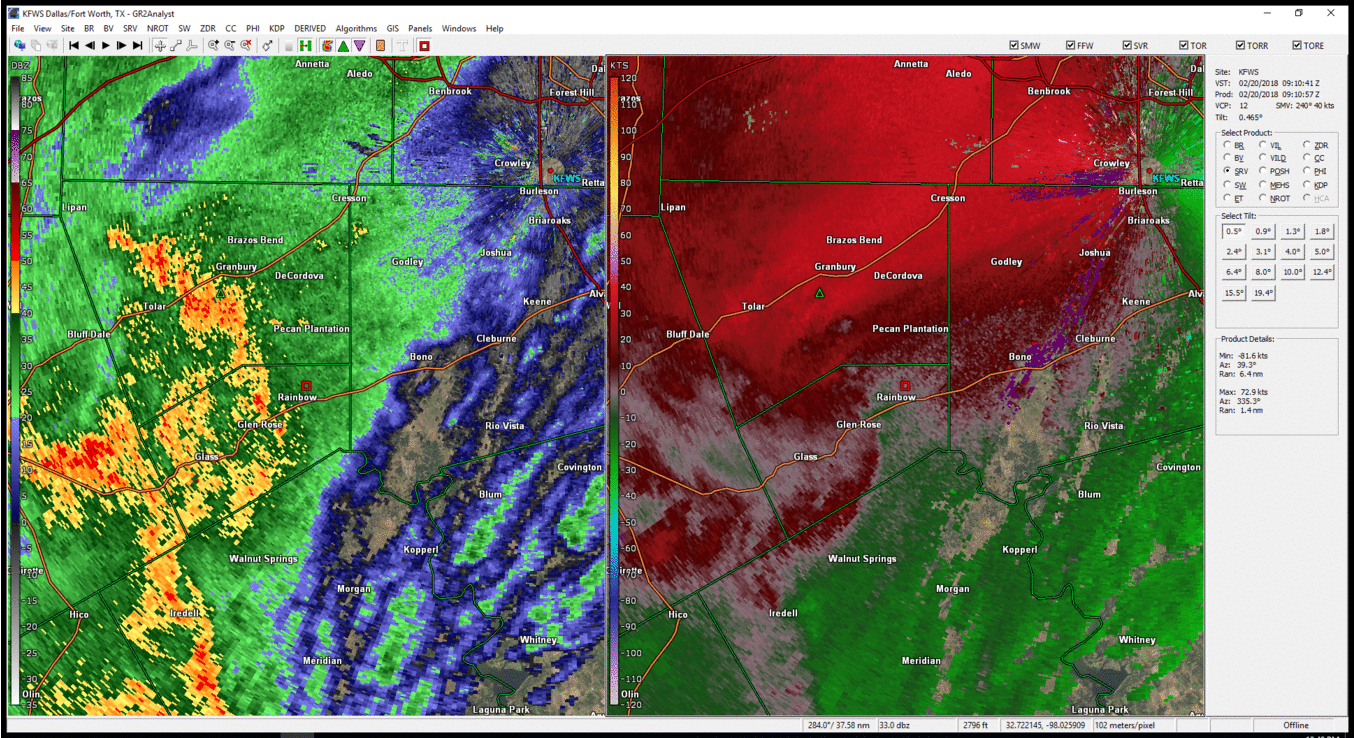
It is unlikely that anyone would issue a tornado warning on this circulation with this information alone. It should be noted that given Godley’s close proximity to the radar site, the 0.5° scan was only sampling the circulation a few hundred feet above the ground. However, Vrot is often highest at 3,000 to 4,000 ft (~1 km) above ground level (AGL; as in Figure 12 of Atkins et al. 2004). So in this instance, it would be advantageous to examine the circulation at a higher scan. But even when looking at storm relative velocity around 3,000 ft, Vrot was still only 20 kts (Figure 2; Note: Figure 2 is ~3 minutes prior to Figure 1).
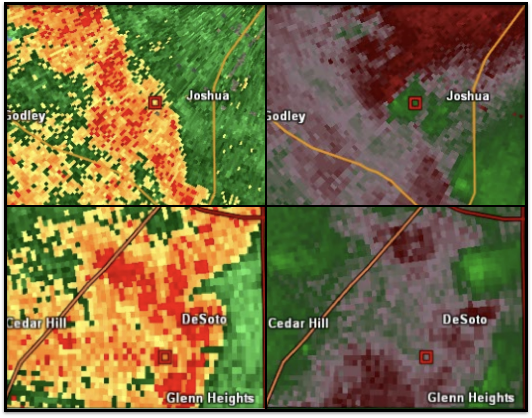
Despite the lack of rotation observed by radar, an EF-0 tornado occurred northwest of Godley. There was a brief debris signature detected at 09:41Z (not shown), as noted by a drop in correlation coefficient colocated with the rotation and high reflectivity, which provided the only solid evidence that a tornado warning was needed. Otherwise, this tornado could have easily gone undetected. Weak rotation with similar magnitudes of Vrot occurred three additional times on the morning of February 20th, 2018 (Figure 3); but, the additional circulations were without debris signatures. Devoid of any additional information, each of these subsequent circulations did not indicate the need for tornado warnings. However, all three circulations also produced EF-0 tornadoes. One of these tornadoes hit a mobile home which resulted in three injuries.
There are other environmental clues that can aid in convective warning operations though. In this case, using mesoanalysis, and in particular what is known as the “three ingredients method” (Schaumann & Przybylinski 2012) would yield a heightened concern for QLCS tornadoes in a localized area.
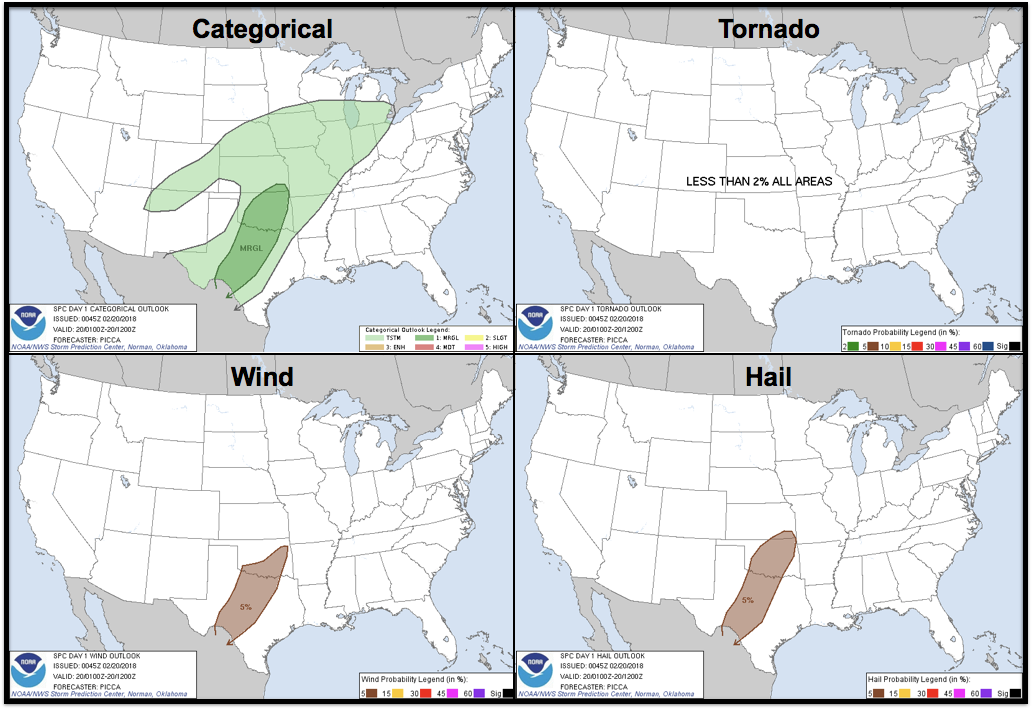
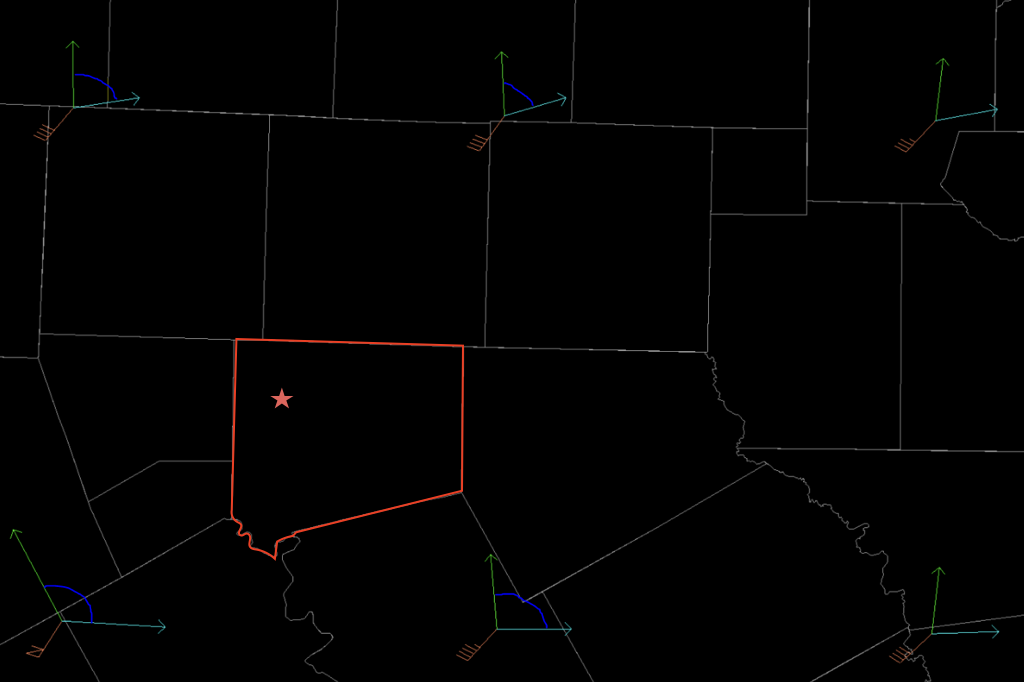
The evening prior to the event, the Storm Prediction Center had highlighted a broad area across central Texas and Oklahoma, including the Fort Worth area, with a Marginal Risk for severe thunderstorms (Figure 4). The Marginal Risk was based on areas of a 5% risk for severe hail and wind. The tornado risk was described as “non-zero due to an amplifying low-level jet and related low-level shear,” however, “the expected line orientation and continued uncertainty with regards to convective development precludes the introduction of [tornado] probabilities from the Rio Grande to north-central Texas.” Meanwhile, the Fort Worth/Dallas NWS afternoon area forecast discussion noted the uncertainty, and furthermore noted that “stronger storms will be more likely if the cluster is able to organize into a broken QLCS structure, which given the strong shear in the 0-3 km layer, seems plausible.” The convective line orientation, if the line even developed, would be a key factor in determining the tornado potential.
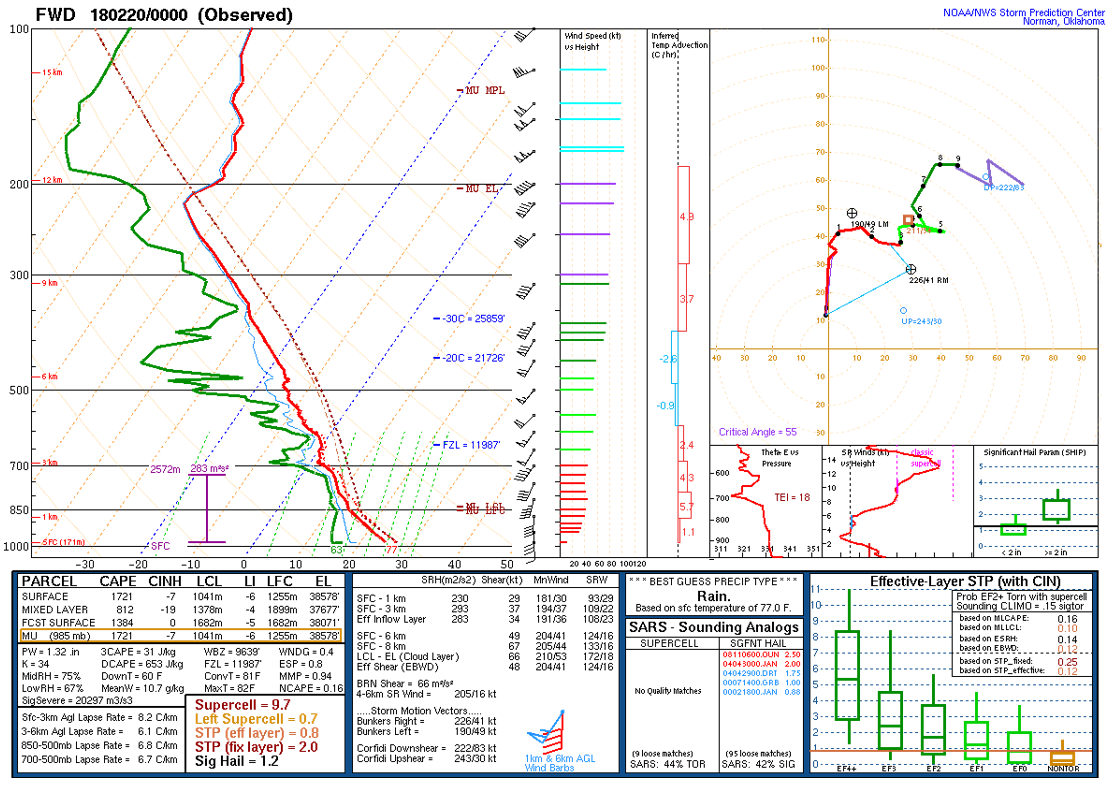
The 00Z Fort Worth/Dallas sounding (Figure 5) sampled an unstable air mass with around 800 J/kg of mixed-layer CAPE along with moderate shear (48 kts of effective bulk shear). Convective inhibition (CIN) was also weak. Thus, the environment was such that severe thunderstorms were possible, with severe wind gusts likely being the primary threat.
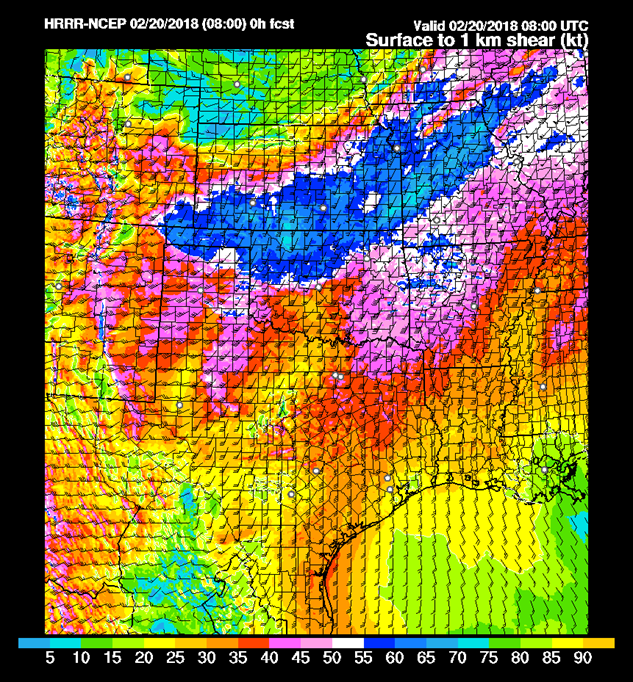
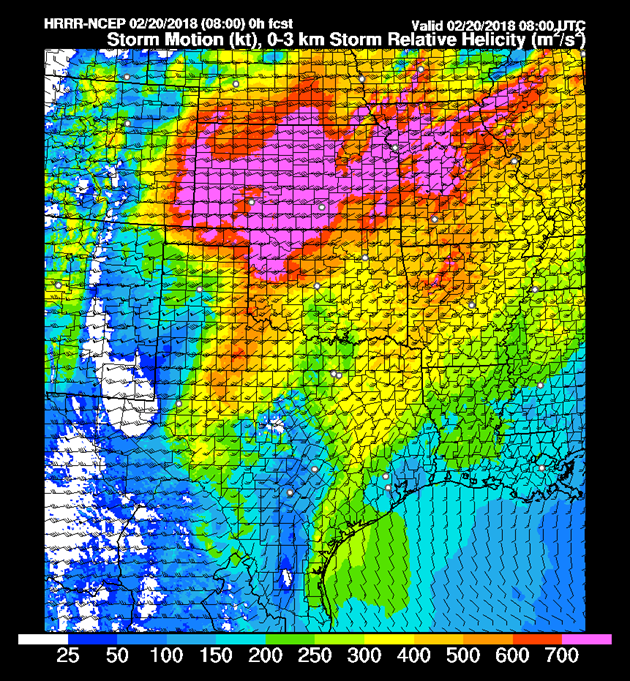
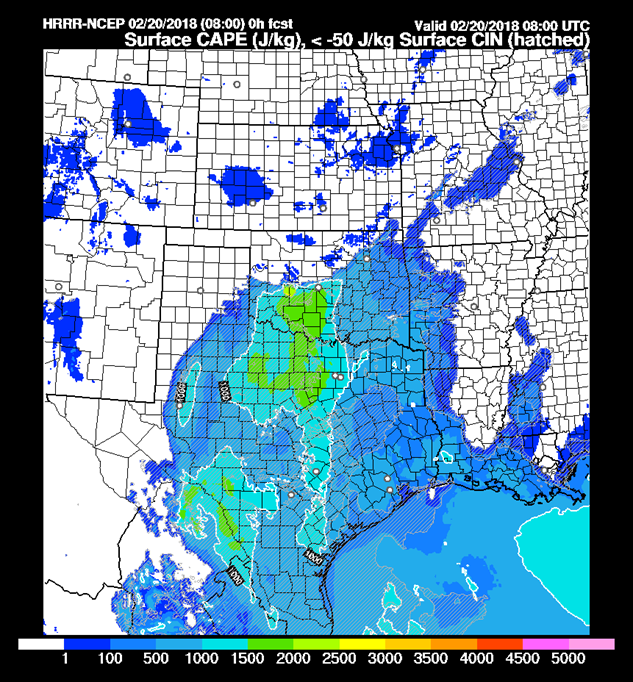
The environmental parameter space remained conducive for severe weather into the early morning hours. As of 08Z, 0-1 km shear was high with values greater than 30-35 kts ahead of an incoming area of convection (Figure 6). Values of 0-3 km storm relative helicity were in excess of 250 m2/s2 across most of the Fort Worth area (Figure 7). And finally, CIN was weak and surface-based CAPE was greater than 1000 J/kg along and west of I-35 (Figure 8). Thus, with a QLCS in an environment of sufficient instability and strong low-level shear, there was good reason for a heightened tornado potential. But this tornado potential was conditional on the line orientation with respect to the 0-3 km shear; 30 kts of 0-3 km line normal shear is required for the second ingredient in the three ingredients method to be met.
The three ingredients method is an excellent mesoanalysis and nowcasting technique that heavily utilizes radar data, in addition to parameters such as 0-3 km shear, to infer where values of favorable shear and storm scale dynamics are coming together for mesovortex intensification and possibly tornadogenesis. While it may at first seem unusual to use the radar for mesoanalysis, it's no different than using other remote sensing instruments, like satellite, to find areas of increasing concern before warning criteria are seen.
The first ingredient in the three ingredients method is a balanced or slightly shear dominant Updraft Downdraft Convergence Zone (UDCZ). The UDCZ can be traced in the storm-relative velocity product by identifying the line of convergence near or along the convection of interest. To assess whether the UDCZ is balanced or slightly shear dominant, this trace is then compared to the reflectivity values. Where the UDCZ is along the leading edge of the reflectivity gradient, the UDCZ is shear balanced. Similarly, where the UDCZ is only slightly behind the leading edge of the reflectivity gradient, the UDCZ is considered to be slightly shear dominant. In this case, 10 minutes prior to the first tornado, a large portion of the QLCS was balanced or slightly shear dominant (bold red line in Figure 8); thus, the first ingredient was met.
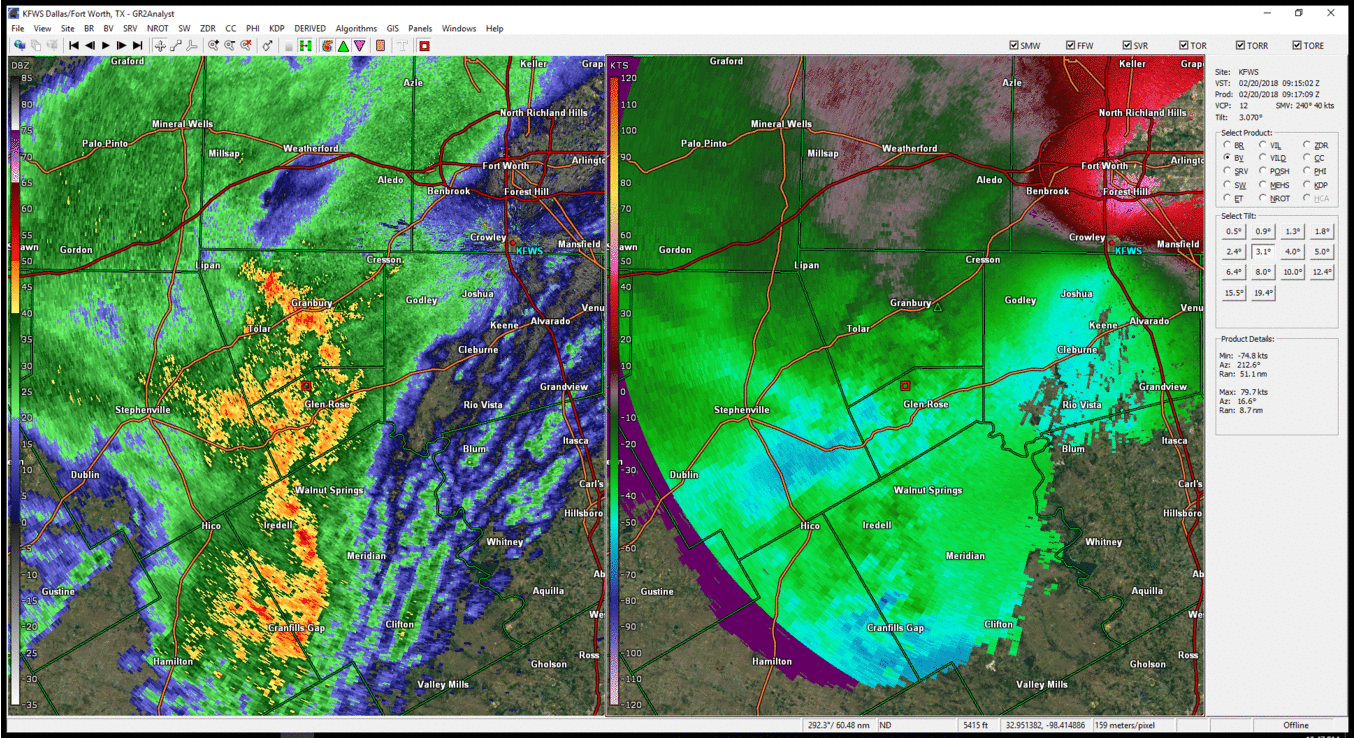
In order to analyze if 30 kts of 0-3 km line normal shear was present, the second of these ingredients, the line normal shear left/right vectors were examined (Figure 9). Both the left and right vectors of the shear vector are needed, as opposed to the simple shear vector, because the 30 kt line normal shear threshold can still be met if the line is moving slightly orthogonal to the shear vector in the presence of high shear. Any storm motion that falls in between the two vectors has at least 30 kts of shear normal to the line (highlighted by the drawn blue lines in Figure 9). As the speed of shear increases, as indicated further to the southwest in this scenario (Figure 9), the range of motions that result in 30 kts of line normal shear gets larger. For this event, any storm or line motion that is moving east-northeast to north will meet the 30 kt requirement for line normal shear. Examining the 30 minutes prior to the first tornado that occurred near Godley, TX (Figure 10), there is a portion of the line in northern Johnson County, TX that is moving east-northeast, which satisfies the second ingredient.
Finally, the third ingredient of this method is the presence of a rear inflow jet, line-surge, or bow. Rear inflow jets develop in the mid-levels (4,000 - 10,000 ft AGL). When these jets reach the front of the line of convection, a bow echo is often formed and the threat for damaging straight-line wind increases. Similar to analyzing the UDCZ, the rear inflow jet or bow is assessed using radar data. In this case, the 3.1° tilt samples the line around 8,000 ft AGL where inbound winds increase from 50 to 80 kts in the 30 minutes leading up to the first tornado near Godley (Figure 11). As a result of the strengthening rear inflow jet, the line bows near Cleburne, TX, making the motion of the portion of the line just north of the apex more orthogonal to the environmental 0-3 km shear (second ingredient).
Therefore, all three ingredients were met for mesovortex intensification and possibly tornadogenesis just as the line was moving into Johnson County, TX. Having this awareness, a message could be sent to partners in NWSchat regarding the localized threat for tornadoes. In this scenario, that would have resulted in 10-15 minutes of lead time. Furthermore, the knowledge that there was an enhanced localized tornado potential could also improve internal operations at the WFO. For example, you could switch the radar mode so that it is appropriate for a quick spin-up tornado situation (such as SAILSx3) in order to increase your opportunity at observing key radar signatures. And ultimately, if only poor radar signatures are observed, meeting the three ingredients could lend increased confidence to issue a tornado warning despite weak rotational velocity.
In summary, the three ingredients method is an excellent mesoanalysis technique to help identify if and where a tornado threat exists. In this case, all three ingredients were present shortly before multiple EF-0 tornadoes occurred. Having knowledge of this technique would allow meteorologists to provide enhanced IDSS by alerting partners to the localized threat for tornadoes. Furthermore, the awareness of the enhanced tornado potential could create enough confidence in less-than-optimal radar signatures to issue a tornado warning. More broadly speaking, this case highlights the need to make mesoanalysis a regular operational practice in convective situations, including in low confidence or marginal scenarios.
Want to learn more about the three ingredients method? For those in NOAA, search “TWIP - Landspouts and QLCS Tornadoes” in the CLC. Also, check out the "Deep Shear & the 3-Ingredient QLCS Approach" training module as a part of the new Mesoscale Environment Analysis (MEA) course (these links are accessible to NOAA employees only).
Authored by Ted Ryan, SOO FWD. Editor: Ryan Difani (OU CIMMS/OPG). Special thanks to the OPG team for their support, especially Dr. Connor Nelson (CSU CIRA/OPG) for the review.