Forecasters who participated in the Hazardous Weather Testbed (HWT) Spring 2018 Experiment provided useful feedback on GLM gridded products as they tracked numerous convective systems over the four-week period. Alongside imagery of the data, they provided use cases of the GLM in several forecasting situations, suggested interesting trends, and provided potential applications of the gridded products. The following imagery and quotes taken from their blog posts on the HWT page illustrate their situation-based findings.
Please note that given the experimental nature of the data, some imagery may contain GLM products that will not be included in AWIPS. Additionally, data visualization (e.g. colormaps and scales) was (and still is) undergoing changes, so variability in imagery throughout the posts and in final NWS implementation is inevitable.
Forecasters noted several times that GLM gridded products were useful in identifying convection and updrafts embedded within a broader area of cloud cover and precipitation. The products’ colormaps drew attention to areas with high-density, small areal, and/or bright flashes.
Here, one forecaster used GLM FED and TOE to pinpoint developing convection within an MCS:
“Radar imagery would also suggest a developing MCV…GLM flash extent density and total energy has seen a marked increase over this time period, coincident with colder IR temps (indicating stronger updraft development).” –Rosie Red
Later, in the same system, the forecaster noted the stark difference in GLM FED in convective versus stratiform/anvil flashes:
“…flash extent density [was] substantially lower in the stratiform regions compared to the convective areas”-Rosie Red

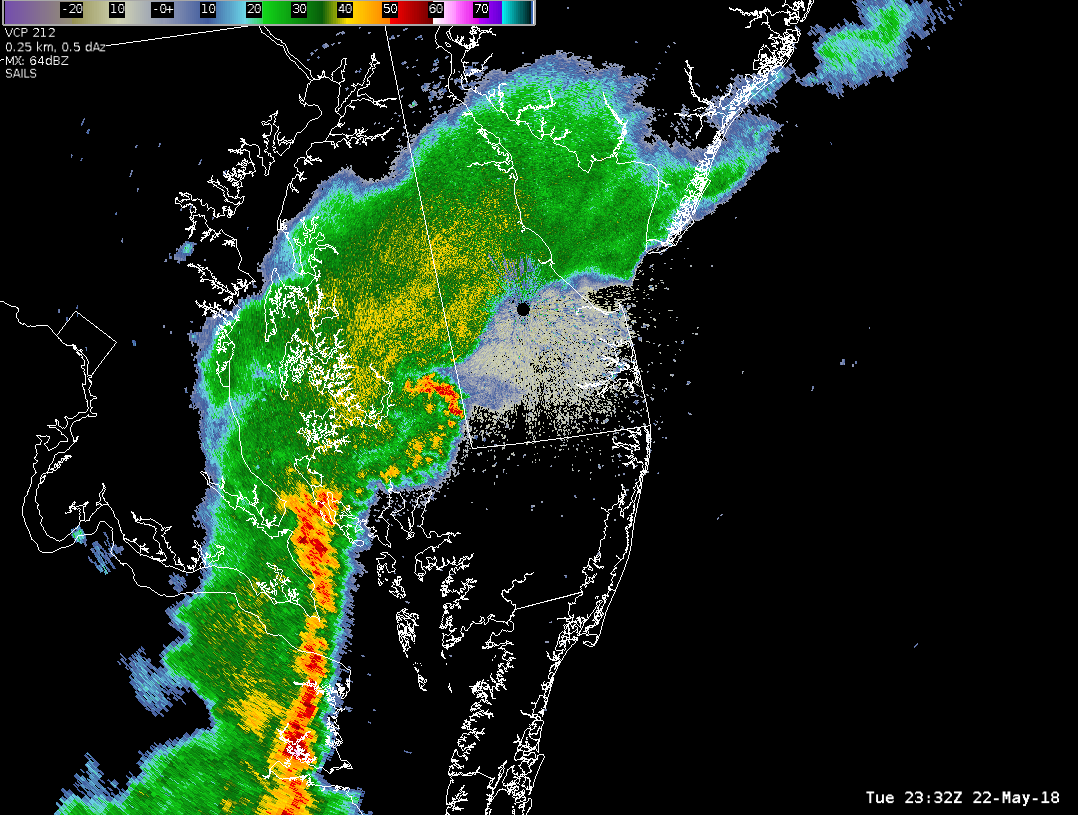
In a different case, this forecaster used FED to easily diagnose where new cells were developing and identify the strongest convection in a line of intense thunderstorms:
“I watched a new cell develop over southern NJ. The main reason this cell stood out was because of a significant increase in Flast [sic] Extent Density. This increase really drew my eye to that part of the line where a cell was rapidly intensifying. This was just another example of the GLM data providing a good overview for situational awareness.” – “wall cloud”
On a more detailed note, signatures in the AFA product appear to vary within individual cells themselves in this case:
“I did notice that it seems that the average flash area near the overshooting tops (used here as a proxy for approximate updraft location) seems to be lower/smaller than in surrounding anvil areas or in areas where updrafts do not appear quite as strong (or have become weaker)”-Rosie Red
Finally, FED was used again to identify a particularly strong updraft within a squall line (also note the large stratiform flashes ahead of the main line):
“Notice the one area with a higher Flash Extend [sic] Density. It's indicative of a stronger, consistent updraft. There is more mixing of the charges going on, which is helping to generate more lightning activity.” –Kevin