Forecasters who participated in the Hazardous Weather Testbed (HWT) Spring 2018 Experiment provided useful feedback on GLM gridded products as they tracked numerous convective systems over the four-week period. Alongside imagery of the data, they provided use cases of the GLM in several forecasting situations, suggested interesting trends, and provided potential applications of the gridded products. The following imagery and quotes taken from their blog posts on the HWT page illustrate their situation-based findings.
Please note that given the experimental nature of the data, some imagery may contain GLM products that will not be included in AWIPS. Additionally, data visualization (e.g. colormaps and scales) was (and still is) undergoing changes, so variability in imagery throughout the posts and in final NWS implementation is inevitable.
Several HWT forecasters asserted that GLM gridded products (specifically AFA) capture the areal extent of lightning better than ground-based networks are able to. They proposed that this information would be invaluable to forecasters in terms of issuing severe advisories, communicating lightning threats to the public, and debriefing emergency personnel.
On forecaster used AFA to note that stratiform flashes can occur far outside the primary convective line, which is something that aviation forecasters need to be aware of:
“One thing that GLM data is going to change for aviation forecasters at the Aviation Weather Center, CWSUs, etc. is Convective SIGMET (C-SIG) and CWA size… As GLM data becomes available to aviation forecasters, I think it is going to open some eyes as to just how much areal extent to lightning there can be in individual t-storms & t-storm clusters/lines/line segments. Consider the following example, which compares GLM average flash area to a C-SIG (again, valid for up to 2 hrs) in NE/KS/N OK. Clearly, the areal coverage of the lightning will extend beyond the boundaries of the C-SIG soon” –Thomas Bell


Another forecaster stated that AFA would be useful for conveying lightning extent information to NWS core partners, adding that low FED and bright signatures on TOE further confirmed the presence of stratiform flashes:
“The GLM data is providing a great example of anvil lightning this afternoon... The GLM data shows a large area of low flash density, but the total energy signature and average flash area are relatively high. I find this to be very useful in the IDSS realm where lightning can occur at various distances from the storms themselves. The GLM provides a good situational awareness whereas the ENI data is somewhat difficult to see given the small size of the data points.” – “wall cloud”

Another forecaster echoed the importance of using AFA in IDSS:
“Pairing FED with Flash Area as in this example helps more easily diagnose the long flash through the stratiform region of this storm over northern IA. The higher flash rates associated with the smaller flash sizes along the leading edge of the northward moving complex are more easily explained with the companion product. As the flash extended north into MN and another CWA, this information could be used to enhance DSS since the main convective line was still 50-60 mi away. ENI and other commercial lightning networks would not have alerted to the threat of lightning overhead at such a great distance. An event organizer or EM looking at static radar also may not be aware of the increased threat of lightning well ahead of the main storm band” – S. Coulomb

The AFA provided a useful tool for a broadcast meteorologist explaining the threat of lightning to the general public:
"It was interesting to see how the lightning from the GLM data ramped up quickly shortly before the storm became severe (it produced quarter sized hail) …I was able to note the 1 minute average flash area spread will out ahead of the precipitation area in front on the storm and also extend in the anvil behind the storm as well. As a broadcast meteorologist, it was a great way to explain to viewers the lightning threat away from the precipitation.” – Gary Cannalte

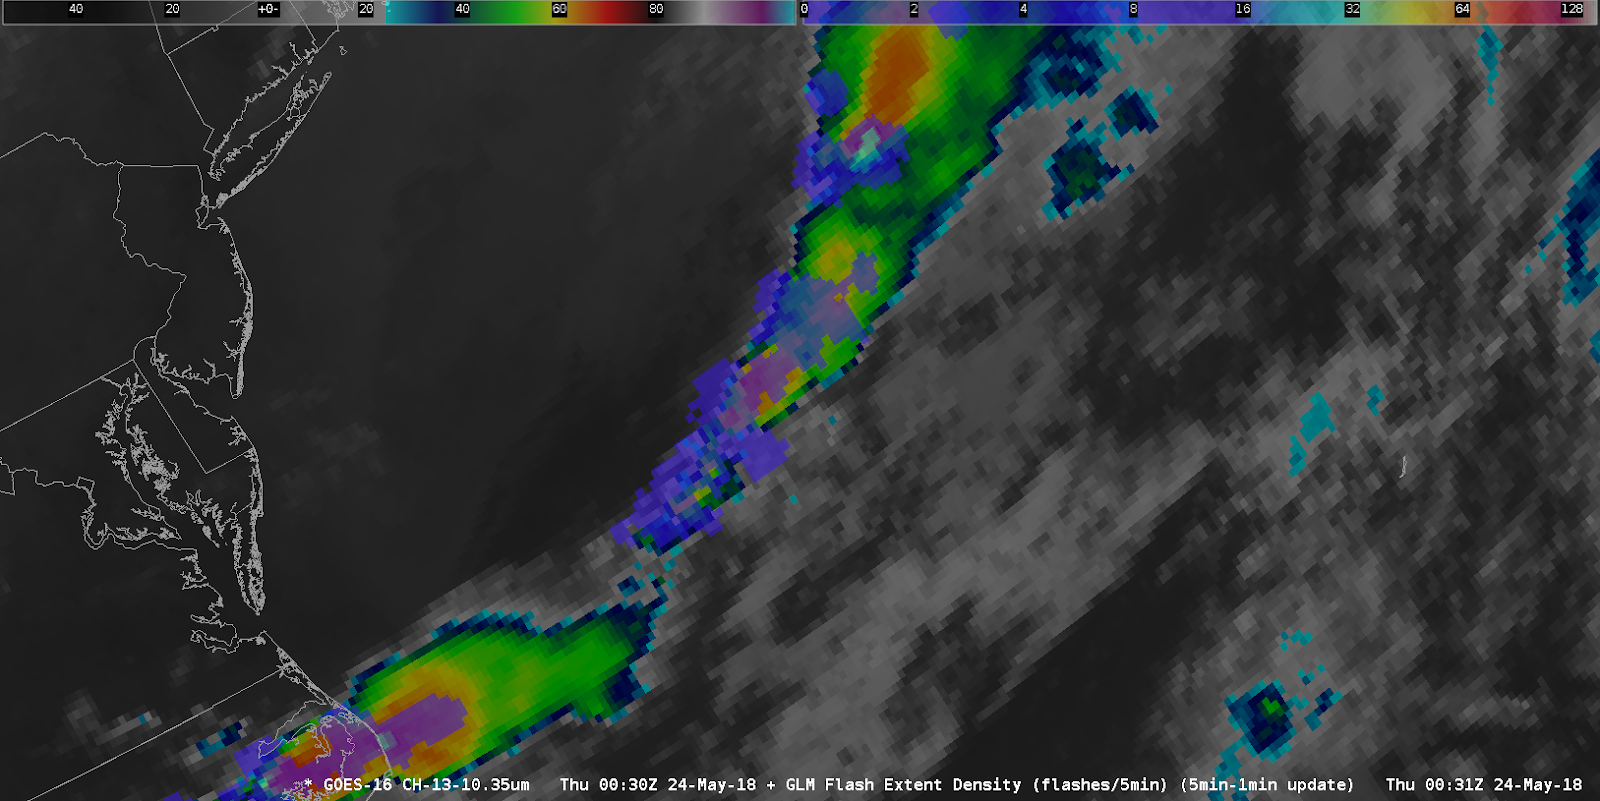
Finally, this forecaster appreciated the value in having GLM gridded products available offshore, noting that having this knowledge will be highly beneficial to both the aviation and marine sectors:
"Over the Atlantic Ocean, GLM data will eliminate much of the guesswork in determining what is and what is not a thunderstorm. Not only will this help the aviation community, but it will help the Navy as well as shipping, fishing, marine, recreational boating and cruise liner communities, to name a few.” – Thomas Bell