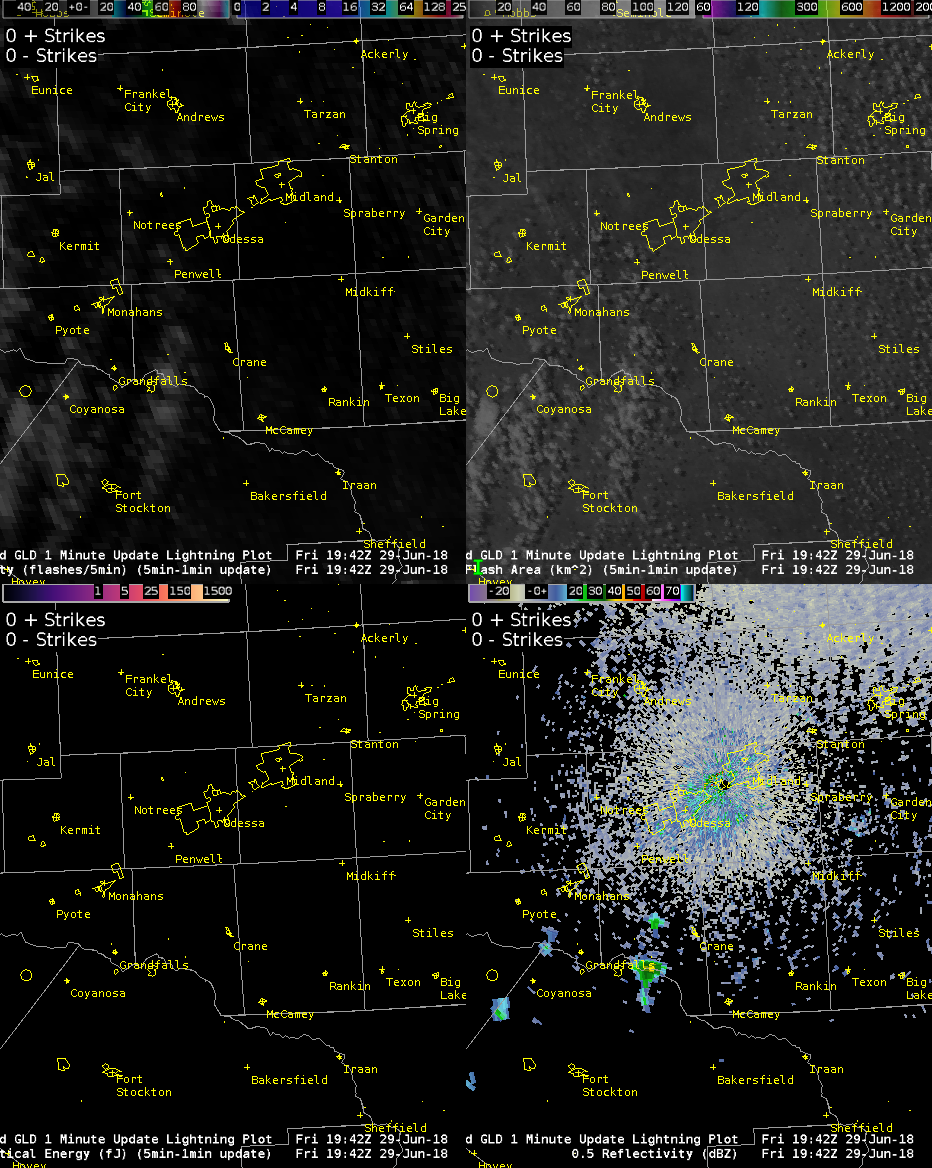
Note: all images have the following convention: Top Left - GOES-16 Legacy IR (11.21 um) Window overlayed with 5-minute Flash Extent Density, 1-minute update. Top Right - Red Visible Band (0.64 um) Window overlayed with Flash Area. Bottom Right - 0.5° Reflectivity Mosaic. Bottom Left - Optical Energy. All panels: GLD 5-minute Plot with 1-Minute update, Time Match Basis on this product. Last few images include ENTLN Pulse data in bottom left pane.
2018 June 29 - Isolated convection started to develop near the Pecos River between Midland, TX and Fort Stockton, TX in an environment of high CAPE and low shear. Radar echoes started to appear around 19:42 UTC on the KMAF 88D (Midland) with visible satellite showing an area of enhanced cumulus.
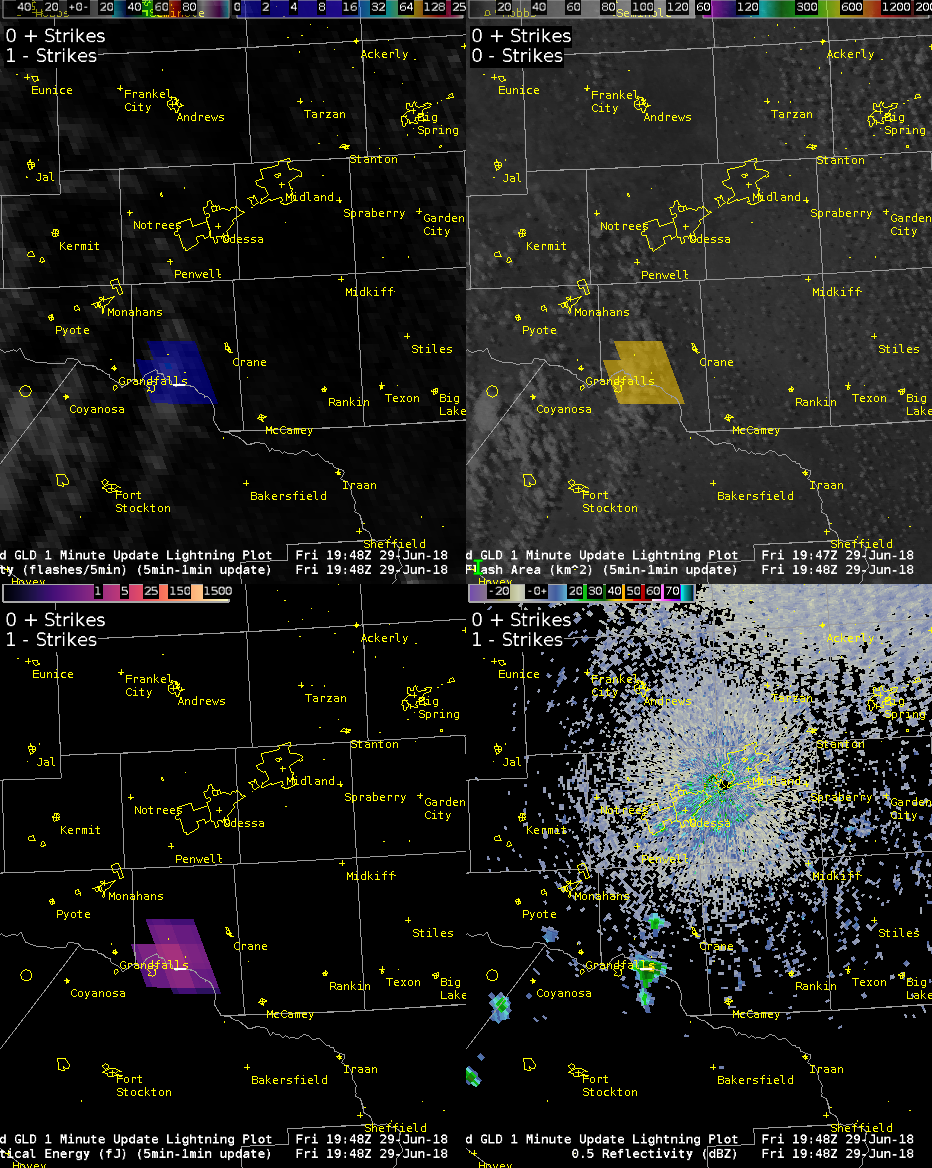
The first flash detected by both the GLM and Vaisala's GLD360 Network (used in this case instead of the NLDN to indicate all strokes detected as opposed to the NLDN's clustering algorithm to show one flash for all strokes) occurred at 19:48 UTC just east of Grandfalls, TX. Of interest is that the GLM indicated this as a large flash; 592 km2 even though the storm itself of visible satellite looked rather small in comparison. Interesting...wonder why that is the case?
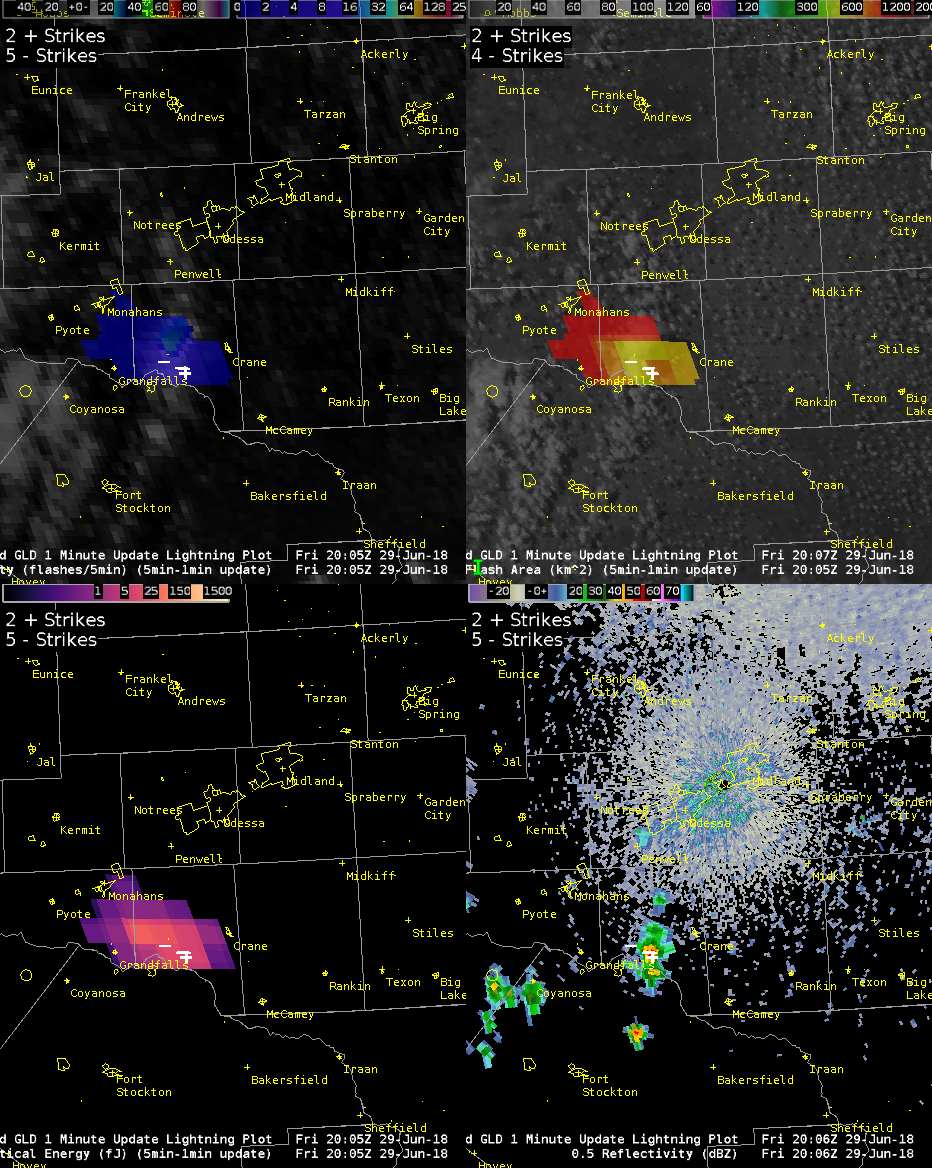
By 20:05 UTC, the storm has stared to produce an anvil and multiple CG strokes were detected in the core of the storm with one negative flash outside of the reflectivity core. Flash Area shows ~500 km2 flashes near the core of the storm with one larger flash (~1000 km^2, in red).
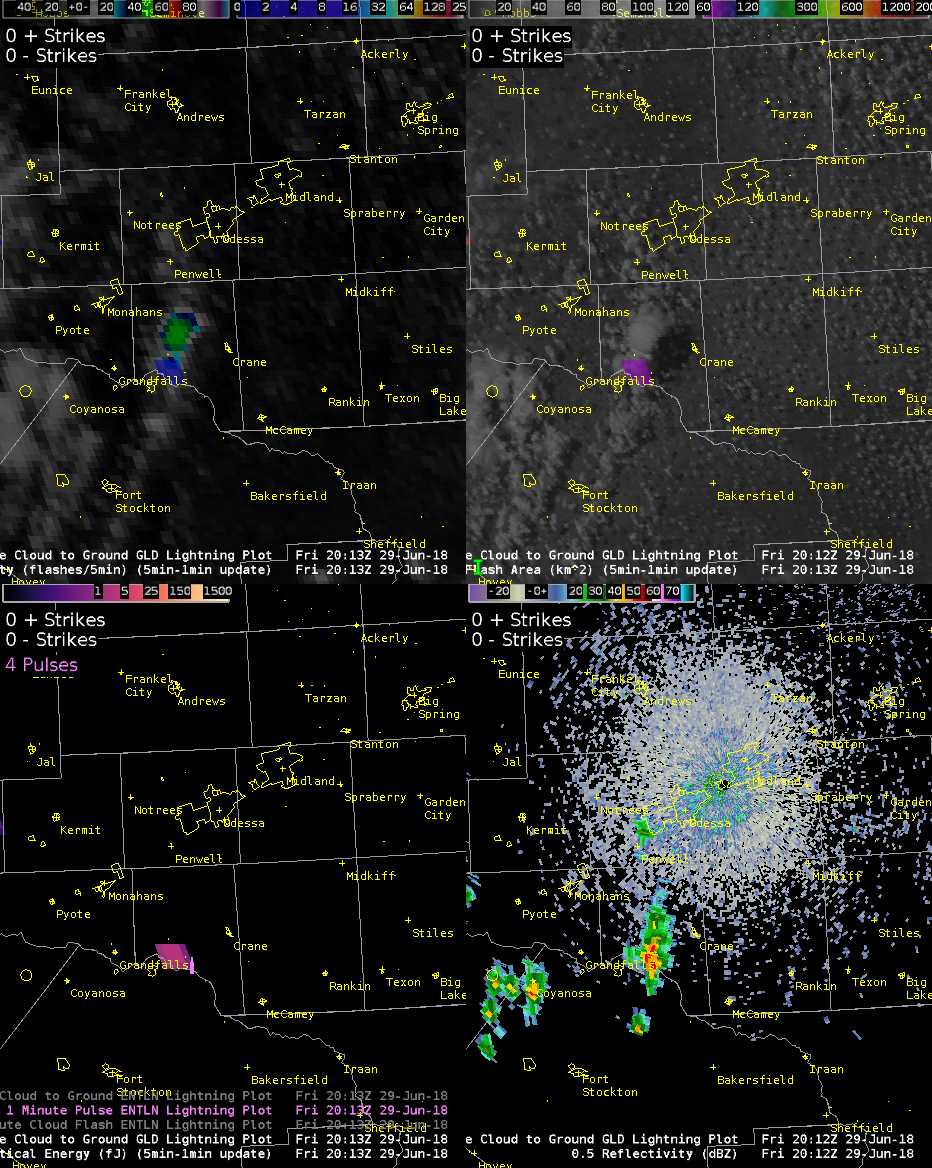
This storm weakened a bit and electrical activity stopped until 20:13 UTC when GLM detected small flashes upstream of the old anvil and in an area of new growth on visible satellite (purple area, 75 km^2). A comparison of the GLM with the Earth Networks/ENTLN Pulse plot overlayed with Flash Energy (bottom left panel) shows that there was a detection of in-cloud lightning in this area and also in the right location (don't forget parallax is not corrected with GLM data!!).
Over the next 13 minutes, the storm continues to produce lighting detected by the GLM, and both Vaisala and Earth Networks detection networks. At 20:26 UTC, the GLD detects a negative stroke outside of the area of any GLM flash detection with one positive stroke that appears to correlate well with the GLM flash.

So, what happened? Based on the negative stroke's location, it is quite possible that the GLM didn't see this flash! Why? Viewing angle. The negative stroke was located to the northwest of the core of the storm. It is possible that there was not enough optical energy making it through the storm to the GLM that it registered that flash. And before you ask, that is probably a valid stroke; ENI Total Lightning Network detected pulses pretty close to the location of the GLD negative flash.


